Electric Vehicles The Benefits and Barriers Part 11 doc
Bạn đang xem bản rút gọn của tài liệu. Xem và tải ngay bản đầy đủ của tài liệu tại đây (1.82 MB, 20 trang )
Applications of SR Drive Systems on Electric Vehicles
189
The electromagnetic torque created by phase A is:
2
eLa
1
τθ,i
g
i
2
(24)
According to the torque balance equation 25:
3
ednLω
n1
dω
τθ,i ττωk ω J
dt
(25)
When the system enters steady state, the torque is invariable:
3
ednLω
n1
τθ,i ττωk ω
(26)
τ
L
(
) is load torque and k
is coulomb friction coefficient.
Compare equation (7) with equation (8), we get:
e
dω
Δτ θ,i J
dt
(27)
If the sample time T is small enough, load torque and
k
can be seen as constant in the
sample interval. So
τ
e
(
)
is proportational to
, equation (28) is:
e
Δω
Δτ θ,i J
T
(28)
In the equation above,
d
dt T
. Thus we get the torque deviation signal from speed
deviation signal through the PI regulator.
ep
Δτ θ,i K Δω (29)
The bandwidth of speed closed loop is small. It will be better when the proportional
regulator used. But it is hard diminish to the steady-state error. So, in order to minimize the
steady-state error and strengthen the disturbance rejection ability, we select the PI regulator.
Equation 30:
i
ep
K
Δτ θ,i K Δω
s
(30)
4.2 Fuzzy controller design
From the figure 14, the inner loop is a direct torque control loop which is a three dimension
self-adjust fuzzy logic control system, in which the torque loop is composed of the
instantaneous sum torque negative feedback control. The inner loop is completed by
software to complish the feedback of the fuzzy logic control itself, so that the SRM can be
controlled in an optimal state. The following detail is about the fuzzy logic controller design
and the adaptive “soft feedback“ complement.
Electric Vehicles – The Benefits and Barriers
190
4.2.1
,i
Fuzzy logic tables
The SRM is multi input multi output controlled object. The fuzzy logic table describes the
connection between input and output. In mathematics, this table can be seen as a two input
single output non linear functions. The steps to build the table are as follows:
First step: confirm input and output fuzzy domain and its membership function.
Input variable is the rotor position angle and winding current. Their corresponding
variation range are 0—45
0
and 0—200A. In order to improve learning rate, we assign that the
membership function of fuzzy system input is isosceles triangle and its vertexes are located
in the centre of triangle bottom. Shown in figure15(a)(b). The membership function of
output flux linkage is shown in figure15(c) and its corresponding range is 0-0.18Wb. The
fuzzy subset of linguistic value which describes input and output value are:
,,SMB ,
which S=Small,M=Medium,B=Big.
:,
Mn Min M n
ii i i
Rif isA iisB then isC
(31)
Second step: generate fuzzy rules from input data.
When every membership functions of input and output fuzzy domain is confirmed, we can
get fuzzy rules from the measured data. Every input-output data pair is consist of current,
rotor position and flux linkage which has specifically numerical relationship. In the first
place, we get the membership degree from the corresponding fuzzy membership domain.
Second, we assign the max membership degree to the variable in the domain. So, the value
of nth data pair is
(n), i(n),
(n). The assigned value will point to the fuzzy domain with the
max membership degree, which can be written as the following fuzzy rules. In this equation,
,,
M
nMinMn
iii
ABC
are respectively represent the fuzzy domain of discrete data to
(n),
i(n),
(n). Table 2 is fuzzy rules. For example, if current is max and rotor position is max, the
flux will be max.
Third step: confirm fuzzy rules membership degree.
When every new fuzzy rule is created from the input output data pair, a rule degree or fact
is connected to this rule. The rule is defined as trust degree to the fuzzy rule. Actually the
rule degree is related to the function, which describes the relationship between current,
angle and flux linkage. The rule degree equals to the product of membership degree in each
fuzzy domain. Like equation 31, can be depict as equation 32.
()
MMM
nin n
iii
ABC
Degree Rule
(32)
The instantaneous torque sum can be get from current, the rotor position angle and flux
linkage in the following fuzzy logic table (Table 6).
4.2.2 Fuzzy model trainning
The phase current I is obtained by magnetic balance Hall current sensor and the angle θ by
photoelectric position sensor. The flux linkage is calculated by the finite element analysis of
current and the rotor position angle. The torque order is acquired from rotate speed order
and then the current order is get from the torque order. Thus the current control can be
realized. Figure 16 is the fuzzy controller based on MATLAB fuzzy toolbox. Figure 17 shows
Applications of SR Drive Systems on Electric Vehicles
191
the finite element analysis
-
i
-
graph. According to finite element data, the model is
training in the offered Matlab fuzzy toolbox. Figure 18 presents the
-
i
-
graph acquired
by training the static data in fuzzy model. As we can see from the Figure 17, the established
fuzzy rules are correct that we can get accurate flux linkage from the input phase current
and the rotor position.
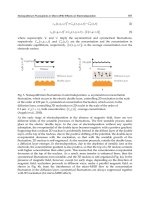
Fig. 15. Fuzzy domain regions and membership for each variable (a) Rotor position, (b)
Current, (c) Flux linkage
Flux linkage
Current
Medium (M) S M B
Big (B) S S B
Small (S) Medium (M) Big (B)
Rotor position
Table 6. Fuzzy logic table between and i-
SM1
BIG1
BIG1
BIG1
μ(Ψ)
θ(deg)
i (A)
Ψ (Wb)
(c)
μ()
M
μ(i)
BIG11
BIG40
0.09
1
1
1
(b)
(a)
0
0
0.18
23
37.4
30.2
SM11
23
M
SM1
BIG6
SM6
13
………
200 100
M
SM1
81
………
SM4
Electric Vehicles – The Benefits and Barriers
192
5. Result
5.1 Tests on the motor platform
Before the experiment on vehicle, we do the bench load test with the selected motor first.
The experiment table includes three phase dynamometer, torque measurement oscilloscope,
DC generator, resistance box and so on. The DC power needed by EV drive is supplied by
25 lead acid traction batteries. DC generator and resistance box make up the load of the
Fig. 16. Variation of the flux linkages of FEM for a single phase winding with rotor position
and phase current
Fig. 17. Variation of the flux linkages of FEM for a single phase winding with rotor position
and phase current
Applications of SR Drive Systems on Electric Vehicles
193
Fig. 18. Variation of the flux linkages of fuzzy controller for a single phase winding with
rotor position and phase current
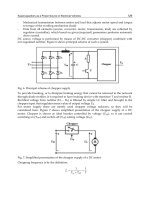
drive motor, which is adjusted by excitation voltage.Figure 19 shows the two phase winding
current waveform of SRM when the motor speed at 500r/min and load with rated torque.
From this figure we can see that the effective current increases so as to output required
torque. The out power is 3.2kW, the efficiency is 84% of the SR drive system. Figure 20
shows the two phase winding current waveform of SRM when the motor speed at 500r/min
and load with peak torque.
Fig. 19. Winding current waveform of n=500r/min under loaded 72Nm
The output torque is 1
44N.m and output power is 6.4kw. It is obviously that winding
current is controlled below the peak value (189A). The waveform of the current is flat top
Electric Vehicles – The Benefits and Barriers
194
and the drive system is working with full load. This status is used to provide peak torque
when EV startup or accelerate. In order to improve system reliability, it is allowed to work
overload for one minute. After that, the control system will lock trigger pulse and give
overload alert to prevent system damage. The figure 21 shows steady state torque profile at
speed of 400r/min and output power is 4kW , it shows the torque ripple is only within less
than 10 N· m.
Fig. 20. Winding current waveform of SRM when the motor speed at 500r/min
Fig. 21 Steady state torque profile at speed of 400r/min
5.2 Tests on the PEUGOT 505 SW8
The SR drive system designed in this chapter was installed on the PEUGEOT 505 SW8 to
do vehicle tests.The van preserves clutch, gearbox and other transmission mechanism.
Thus we can reduce effect on vehicle traction performance. On the other hand, in doing so
can improve startup torque. The installment of Lead-acid Battery mainly considers axis
Applications of SR Drive Systems on Electric Vehicles
195
distribution and its structure. The battery is assembled by the space and axis load
distribution rather than central installation to ensure the balance of front and rear bearing.
The SR motor is in the position of engine and motor controller is fixed above it. It shows
the excellent mechanical characteristics of the SRM when the van starts up. Pictures of the
modificated EV and the SR drive system are showed respectively in figure 22 and 23. The
starting torqueis almost twice the rated torque, which meet the requirement of starting,
accelerating, climbing and some other complicated working conditions. The van starts up
smoothly, the current of the bus is low which is less than 15A. The vehicle test was
arranged with the battery which was charged full voltage (360V). The driving range was
205km. The battery voltage was 265V when the van stopped. Table 7 is running test data
under different dears. Figure 24 shows the battery voltage and bus current when the EV
climbed the hill which grade was greater than 25º. They were respectively 255V and 70A.
The current was 120.5A when the EV accelerated and the maximum speed reached
165km/h.
Fig. 22. Modification of PEUGEOT 505 SW8
Electric Vehicles – The Benefits and Barriers
196
Fig. 23. SR drive system for EV
Number Gear Speed(r/min) Battery voltage(V) Bus current(A)
1 3 40 360 38
2 4 50 360 43.3
3 5 75 355 57
4 5 95 355 77
5 5 85 355 60
6 5 80 335 50
7 4 80 335 60
8 5 80 335 52
9 5 90 330 57
10 5 65 330 33
11 5 73 330 45
12 5 80 320 60
13 5 70 320 49
14 5 80 312 55
15 5 80 313 67.4
16 5 75 290 72.5
17 5 70 280 62.7
Table 7. Testing data of EV running parameter
Applications of SR Drive Systems on Electric Vehicles
197
Fig. 24 Battery voltage and bus current climbing the hill
6. Conclusion
Through the refitment of the gasoline car,the designed SR motor and drive system satisfy
the demand of dynamic characteristics, the startup characteristics and the acceleration
characteristics. In the stage of startup, the current of the SRM is 15A, the torque is stepless
and the acceleration characteristics are quite well. The maximum speed comes up to
165kmph and the continuation of the journey reaches 205km or upward. The new rotor
structure decreases the wind noise,the noise of SRM is only 76dB.
This chapter designed a 30kW SRD system used on PEUGEOT 505 SW8. The system applied
fuzzy logic adaptive control based on instantaneous torque sum against the big torque
fluctuation and strong noise on SRM.The vehicle tests automotive load experiment shows
that the measures taken are effective. The designed SRD system has a low startup current,
small torque fluctuation and high efficiency, all of which are especially suited for the
dynamic characteristics of electric vehicle. So it has a broad application prospects. If the
batteries and power systems are planed together, the designed SRD system will display its
superiority by adjusting and integrating the subsystems.
7. Acknowledgment
The scientific research of SR drives system for EV was supported by Beijing Jiaotong
University in 2006. Beijing Tongdahuaquan Ltd. Company provided author a PEUGEOT 505
SW8 to test. We acknowledge them provide the fund and material.
8. References
J. C. Moreira, “Torque ripple minimization in switched reluctance motors via bicubic spline
interpolation,” IEEE Power Electronics Specialists Conference Record, Toledo, Spain,
June 1992, 0-7803-0695-3/92, pp. 851–856.
Electric Vehicles – The Benefits and Barriers
198
F. Filicori, C. G. L. Bianco, and A. Tonielli, “Modeling and control strategies for a variable
reluctance direct drive motor,” IEEE Trans. Industrial Electronics, vol. 40, no. 1, pp.
105–115, 1993.
D. G. Taylor, “An experimental study on composite control of switched reluctance motors,”
IEEE Control System Magazine, vol. 11, no. 2, pp.31–36, 1991.
Nigel Schofield, Electric Vehicle Systems Notes, the University of Manchester, 2006
Yin Tianming. A novel rotor structure for SRM. China, Utility Model Matent. 03279782.6
2003
Technical information, IGBT-Module BSM300GA120DLC, EUPEC Power Electronics in
Motion
11
LiFePO
4
Cathode Material
Borong Wu, Yonghuan Ren and Ning Li
School of Chemical Engineering and Environment,
Beijing Institute of Technology
China
1. Introduction
Rechargeable batteries have largely replaced primary cells as they save resource and reduce
pollution. Recent increases in demand for oil, with the associated environment sustainable
issues are continuing to exert pressure on an already stretched and strained world energy
infrastructure. Clean and efficient energy production from renewable sources is wanted in
our energy and environment-conscious society. Among the secondary batteries, lead
batteries and NI-MH batteries have stepped back from market since a new and strong
system comes into our sight, Li-ion batteries. Li-ion batteries meet what we need. High
capacity, high electrochemical potential, superior energy density, durability, as well as the
flexibility in design, all the above outstanding properties accelerate the substitution of
conventional secondary batteries. They are now prevailingly used in portable electronic
devices, 57.4% of sale on mobile phone, 31.5% on notebook computer and 7.4% on camera.
Their application has also been extended over other fields, including hybrid electric vehicle,
space application, military vehicle et al. The differences between various batteries are
exhibited in Tab.1.
cathode Li-ion Pb-Acid Ni-Cd Ni-MH
lifetime/cycle
Working potential/V
Specific energy/Wh kg
-1
Specific energy/Wh L
-1
500~1000
3.6
100
240
200~500
1.0
30
100
500
1.2
60
155
500
1.2
70
190
Table 1. The comparison between various batteries
cathode LiFePO
4
LiFePO
4
+5%C
LiMn
2
O
4
LiCoO
2
LiNi
0.8
Co
0.2
O
2
Density/g cm
-3
Potential/V
Specific capacity
/mAh g
-1
Specific energy
/Wh g
-1
3.60
3.50
169
0.59
3.48
3.50
159
0.56
4.31
4.05
148
0.56
5.10
3.90
274
0.98
4.85
3.6
274
0.98
Table 2. Electrochemical parameters of several cathode materials
Electric Vehicles – The Benefits and Barriers
200
LiCoO
2
is first chose to work as cathode materials when Li-ion batteries come out in 1990. Its
long history supports LiCoO
2
a big progress. During that process, other cathode materials
are discovered, LiNiO
2
, LiMn
2
O
4
, LiNi
1/3
Co
1/3
Mn
1/3
O
2
, LiFePO
4
et al. Comparisons of
electrochemical parameters of several cathode materials are listed in Tab.2.
Each of them has their own characteristics. For example, LiCoO
2
is costly and toxic, and its
resource is no longer abundant (A. G. Ritchie, 2001). LiMn
2
O
4
owns a much lower capacity
and inferior cycle stability (Yuan Gao & Dahn J. R, 1996). Iron-based compounds look
attractive as Fe is abundant, inexpensive, and less toxic than Co, Ni, or Mn. The phospho-
olivine LiFePO
4
is currently under extensive studies due to its low cost, low toxicity, high
thermal stability and high specific capacity of 170mAhg
−1
. Reduced reactivity with
electrolytes results in the very flat potentials during charge-discharge processes.
The potential of material is partly decided by the Fermi level (A. K. Padhi et al, 1997). Much
lower Fermi level is wanted to attain a higher working voltage. Among the iron-based
compound, especially in LiFePO
4
, (PO
4
)
3-
lowers the Fe
3+
/Fe
2+
redox energy to useful levels.
Strong covalent bonding within the polyanion (PO
4
)
3-
reduces the covalent bonding to the
iron ion, which lowers the redox energy of iron ion. The Fe
3+
/Fe
2+
redox energy is at 3.5 eV
below the Fermi level of lithium in LiFePO
4
. The lower is the Fe
3+
/Fe
2+
redox energy and the
higher the V vs. lithium for that couple. In LiFePO
4
, approximately 0.6 lithium atoms per
formula unit can be extracted at a closed-circuit voltage of 3.5 V vs. lithium. The most
prominent advantages of LiFePO
4
are (1). The structure of material hardly changes while Li
ion intercalation and deintercalation; (2). It holds a long voltage platform.
The working principle of Li-ion battery is revealed in Fig.1. Lithium ions extract from anode
to insert in cathode in the discharge process. The route is inversed as charge takes place.
FePO
4
is the second phase that is present on electrochemical extraction of lithium from
LiFePO
4
. The extraction of lithium from LiFePO
4
to charge the cathode may be written as
Formula (1) and the insertion of lithium into FePO
4
on discharge as formula (2).
LiFePO
4
— xLi
+
— xe
-
→ xFePO
4
+ (1 — x)LiFePO
4,
(1)
FePO
4
+ xLi
+
+ xe
-
→xLiFePO
4
+ (1 — x)FePO
4,
(2)
Fig. 1. The schematic diagram of working principle for lithium battery
More efforts are conducted on the investigations of new electrode materials for lithium-ion
batteries (Li-ion). The iron based olivine type cathodes (mainly lithium iron phosphate,
LiFePO
4
Cathode Material
201
LiFePO
4
) are regarded as possible alternatives to cathodes based on rare metal composites
(i.e. the transition metal oxides LiCoO
2
, LiNiO
2
).
2. Feature of LiFePO
4
2.1 Crystal structure of LiFePO
4
LiFePO
4
owns an ordered olivine structure, orthorhombic space group Pnma. Its systal
constants of a, b and c are 1.033, 0.601 and 0.4693μm respectively. Fig.2 and 3 show the
crystal structure of LiFePO
4
, an ideal model and actual structure. The framework of LiFePO
4
consists of FeO
6
-octahedra and PO
4
-tetrahedra. FeO
6
-octahedra and PO
4
-tetrahedra contact
each other by sharing oxygen vertices in b-c plane. The FeO
6
-octahedra then links another
PO
4
-tetrahedra by sharing a edge. All the PO
4
-tetrahedra don’t touch each other. Lithium
atoms are situated in the interstitial voids of the framework, forming infinite chains along
the c-axis in an alternate a-c plane. Li atoms occupy M1 site and Fe M2 site. The Fe atoms
occupy zigzag chains of corner-shared octahedra running parallel to the c-axis in the other a-
c planes. O arranges in terms of hexagonal close packed structure with a slight distortion.
Fig. 2. Crystal structure of LiFePO
4
(a) ideal model and (b) actual structure.
Fig. 3. Crystal structure of (a) LiFePO
4
and (b) FePO
4
Electric Vehicles – The Benefits and Barriers
202
The strong P-O covalent bond forms the 3D delocalizating chemical bond, herein LiFePO
4
is
thermodynamically and dynamically stable even at temperature above 200°C.
A.K.Padhi pointed out that LiFePO
4
and FePO
4
almost possessed the same structure (Fig.3),
both of them were of orthorhombic system (A. K. Padhi et al, 1997a, 1997b). The small
distinction between the two compounds results in only slight volume change, so then it
won’t cause crystal structure damage during charge and discharge process. Not like other
cathode materials, the unique olivine structure of LiFePO
4
can assure an excellent stability,
therefore its lifetime is much longer.
Fig.4 illustrates the theoretical insertion/extraction process of LiFePO
4
which is different
from others. During lithium ions insert into a cathode particle (discharge), the surface region
of particles becomes lithiated. And a phase interface emerges between two distinct phase
regions (a lithiated phase and a delithiated phase region). The interface shrinks with charge
process until the particle becomes one phase region. As discharge proceeds, the surface
region becomes delithiated. The phase interface between lithiated phase and delithiated
phase propagates inwards until disappear so that a complete charge and discharge
procedure is finished.
Fig. 4. Complete Li insertion and de-insertion cycle of a spherical LiFePO
4
particle.
That distinct mechanism can
explain the phenomenon of super flat voltage plateaus which
are related to the surface Li concentration of particles. Since the incoming Li leads only to
inner shift of the phase interface, the Li concentration of surface region is constant. That
unique flat voltage plateaus are caused by unusual insertion/extraction process of this
material.
2.2 Progress in preparing material
LiFePO
4
occurs in nature as the mineral triphylite. However, its impurity could worsen the
electrochemistry properties so that triphyllite can’t be utilized efficiently. Synthesis of
LiFePO
4
is another way to obtain better materials. Preparation methods decide the
microstructure of compounds which will carry a big weight in the performance of LiFePO
4
.
LiFePO
4
Cathode Material
203
2.2.1 Solid and liquid state reaction synthesis technology
1. High temperature solid state method
It processes as follows: mix the precursor-salts and lithium salt with a definite ratio, sinter
the mixture first at a much lower temperature (300~400°C) to remove volatiles second at a
higher temperature (500~800°C) to crystallize LiFePO
4
, and then cool, grind and sieve to
prepare the product. Solid state reaction method has been a developed technology and been
used much frequently since it’s simple to synthesis and easy to make mass production. The
need for high temperature unfortunately upgrades cost, what’s more, the product size
always can’t be small. So other measures are added to circumvent those problems, such as
slightly lowdowning temperature or adding carbon granules.
2. Co precipitation method
Blend the soluble precursor-salts and lithium salt in water, adjust the PH value under N
2
atmosphere with stirring until the mixture react to precipitate LiFePO
4
. Filter, wash and dry
LiFePO
4
so then dispose it under high temperature. The temperature won’t largely affect the
microstructure as high temperature solid state method does .This technology needs a shorter
reaction time and lower temperature compared with solid state reaction. The particle size
can reach the nanometer level and this reduced size can help to enhance the charge-
discharge performance especially at big current condition. The inadequacies inhibiting mass
production are the complex process and large power consumption.
3. Sol-gel method
Complexing agent helps the Li
+
, Fe
2+
and PO
4
3-
to form sol in water solution. Sinter the
precipitation of sol-crystal at 400~900°C. The uniform distribution of ions in solution finally
acts out a much uniform product that in nanometer size. Monitor the process is easy but
industrialization of this technology is hard as the method is complex. Much waste water is
produced at last also.
4. Hydrothermal method
The reactions of reactants that dissolve in water proceed in high pressure autoclave at a
fixed temperature (<150°C). The product is then watered, filtered and dried to receive pure
phase LiFePO
4
, in small uniform size just like sol-gel does. This pure phase material can’t
behave excellent unless be doped with carbon. So then its capacity could reach to
137~160mAh g
-1
. Rietveld analysis from S. Yang found that 7~8% Fe
2+
occupy the Li
+
sites,
which is related to the weaker charge/discharge behavior (S. Yang et al ,2002). LiOH as
precipitator is added excessively to make sure the completeness of reaction which increases
the cost. This system no more needs the protection from inert gas since O
2
is hardly
dissolved in water. But operation is on a tiny scale constrained by the manufacture
condition.
5. Carbothermal method
J. Barker adopt a new way to synthesize LiFePO
4
with the very inexpensive and readily
Fe
2
O
3
as available precursor source, instead of FeC
2
O
4
et al (J. Baker et al, 2003). The
precursors are intimately mixed and pelletized. The reaction mixture is then heated in a tube
furnace (at ~750°C) equipped with a flowing Ar atmosphere holding for about 8h. The
transition metal reduction and lithium incorporation processes are each facilitated by the
high temperature carbothermal reaction based on the transition from C to CO. The Fe
3+
Electric Vehicles – The Benefits and Barriers
204
always can’t be deoxidated absolutely and impurities can’t be avoided virtually which will
have a bad effect on battery performance.
6. High energy ball mill method
The reaction of Ball mill method is drived by the energy generated from steel balls in high
speed revolution. A homogeneous solid solution with a small amount of contaminant,
coming from the milling equipment, are obtained after 10~24h of high-energy milling of the
initial mixture. A single calcination step goes on for no more than 1h. High energy ball mill
method (also called Mechanochemical activation) is able to produce homogeneous powders
with a particle size in the nanometer range, an increased specific surface area and typically,
a high degree of activity. So the discharge capacity of LiFePO
4
can reach 150mAh g
-1
at rate
0.5C as S.Franger have achieved (S.Franger et al, 2003).
7. Microwave synthesis method
The starting materials are mixed with ethanol in an agate mortar. The mixed powder is
dried at ~60°C (lower than that required for furnace heating) and pressed into pellets. Each
pellet is covered with glass wool and placed in an alumina crucible with a lid to be heated in
microwave oven. Electromagnetic energy is simultaneously absorbed by all parts of
precursor so that uniform and rapid heating can be achieved within a short period of time.
This distinctive character results in no temperature gradient within all parts. The initial
discharge capacity was about 125mA g
-1
at 60°C by Masashi Higuchi et al which can
increased to 161mAh g
-1
if LiFeOP
4
is doped with carbon.(Min-Sang Song et al, 2007) This
method can be used together with other synthesis approach so to largely reduce their
process time.
8. Pulsed Laser Deposition (PLD)
Thin film electrode can relief the problem of poor conductivity. Pulsed Laser Deposition has
been used to fabricate LiFePO
4
thin film electrodes. During the synthesis process of LiFePO
4
,
a laser with a fixed wavelength is used in the deposition. The films are deposited on
platinum plates or basal planes of highly oriented pyrolytic graphite for minutes at room
temperature. The films are then annealed at high temperature for hours under Ar or O
2
gas
flow. The electric characters of thin film electrodes can be easily influenced by the articles
size and fabrication process. Large particles on the surface of thin film electrode will lead to
a bad capacity and poor cycling performance.
9. Electrostatic Spray Deposition (ESD)
A positive voltage of 8.0kV from a direct current power supply is applied to a stainless steel
nozzle of a syringe to generate an aerosol. A syringe pump with a definite flowing rate is
used to pump the precursor solution. The sample deposited on the substrate by ESD is
calcinated at 500~750◦C for hours under pure Ar ambient.(A. Yamada et al, 2001)
Electrostatic force shatters the solution into small drop of liquid with charge. So then the
coulomb repulsion between drops can prevent them from collecting together. Dispersion
degree is flexible by adjusting various voltage electrostatic fields. ESD method offers many
advantages for thin-film deposition, such as low cost set-up, high deposition efficiency and
easy control of composition of the deposited films.
10. Template-mediated approach
Templates such as silica and polycarbonate are used in the process. Charles R. Sides adopted
polycarbon to manipulate the method as follows. An approximately 1cm
2
piece of the
LiFePO
4
Cathode Material
205
polycarbonate filter is immersed in the electrode precursor solution of 1M LiFePO
4
prepared
by sol-gel method in water for 24h. The impregnated template is then attached to a Pt
current collector and dried in air at 80°C for 10min. The template does not require tedious
etching with HF or KOH to be removed since it is decomposed into carbon just for
improved conductivity. The nanocomposite electrode prepared by Charles R. Sides (C. R.
Sides et al, 2005) delivers almost 100% of its theoretical discharge capacity at the high
discharge rate of 3C, and 36% of its theoretical capacity at the enormous discharge rate of
65C.
Lim et al reported the mesoporous LiFeO
4
using silica (KIT-6 and SBA-15) as template
which is removed finally (Sunhye Lim et al, 2008). Both the nanowire and hollow LiFePO
4
cathodes demonstrate excellent rate capability, showing 137mAh g
-1
at 10C rate. However
such ex situ templating methods are both expensive and inefficient.
Biological systems offer capabilities for environmentally benign materials synthesis. An M13
virus–based biological toolkit has been developed for the design of nano-architectured
structures and materials. Yun Jung Lee fabricated high-power nanowire batteries materials
using M13 bacteriophage (phage or virus) organized on a polymer surface (Yun Jung Lee et
al, 2009). The gene VIII protein (pVIII), a major capsid protein of the virus, is modified to
serve as a template for amorphous iron phosphate (a-FePO
4
) growth. The first discharge
capacity of electrode generated by this method at 10C reaches 130mAh g
-1
. And also this
nanowire LiFePO
4
shows the stable capacity retention. Cycling at 1C, up to 50 cycles,
virtually no capacity fade is observed.
11. Other novel methods
Ultrasonic spray pyrolysis (USP)
An aqueous solution containing sugar and raw material is ultrasonically nebulized and a
flow of argon carries the droplets through a heated tubular reactor where solvent
evaporation and precursor decomposition occur. The pyrolysis product is collected in a
series of water bubblers at the reactor outlet where the salt byproduct dissolves leaving
LiFePO
4
. The manufacturing process is one-step process and can prepare the well
crystallized and homogeneous small particles with the spherical shape, pure phase. LiFePO
4
powders, reported by Mu-Rong Yang, can get the initial discharge capacity of 150mAh g
-1
at
C/10 and 50 ◦C. ( M. R. Yang et al, 2006)
Freeze-drying
The procedure includes four steps: preparing the precursor solution, freezing the solution,
drying the congelation, and calcining the drying product. The products of freeze drying are
pure amorphous nanopowder without hard agglomerations. Nanocrystals are subsequently
obtained by calcination.
Coupling technique
Quantities of methods have been developed but each generated with different
characteristics. The combination of two and several techniques can take the merits and
discard the defects.
Microwave hydrothermal method
Compared with Hydrothermal method, the process is almost the same but only the the type
of heating is changed. The mixture in water is treated in a vessel using a microwave
digestion system (Maria Cristina D’Arrigo et al, 1998). Microwave-hydrothermal method
can be used to crystallize nanophase materials with very high surface areas in a matter of a
few minutes.
Electric Vehicles – The Benefits and Barriers
206
Microwave-Co. precipitation method
K. S. Park reported a capacity of 151mAh g
-1
of LiFePO
4
at small current density through
this coupling technique (K. S. Park et al, 2003). The use of microwave greatly cut down the
reaction time for Co. precipitation method so that can save the power.
Ball-milling followed by solid-state reactions
Byoungwoo Kang successfully synthesized high-rate material though ball-milling and solid-
state reaction. At 50C, corresponding to a time of 72s to fully discharge the capacity, the
material achieves about 80% of its theoretical capacity (Byoungwoo Kang et al, 2009).
Precursor is synthesized by ball-milling, then heating the mixture at 350◦C for 10h. The
sample is cooled, ground and pelletized manually then heated at 650◦C for 10h under argon.
The excellent rate property is thought to be caused from the strategy to facilitate transport
across the surface by creating a poorly crystallized layer with high Li
+
mobility.
Various approaches have been developed to improve electrochemical performance. In
addition, the performance can be enhanced though the optimization of the synthesis
processes, adjusting weight and ratio of the raw materials even with common routes. Yanyi
Liu fabricated nanocomposite film cathodes by sol–gel processing with excessive polymer
additive (l-ascorbic acid C
6
H
8
O
6
) while carbon serving as both defects and conductive
nanocoating on the surface of LiFePO
4
particles. High electrochemical performance with
initial discharge capacity of 312mAh g
-1
is observed (Yanyi Liua et al, 2011). Capacities
higher than theoretical limit observed in other nanostructured electrode materials have also
been reported in literatures by other authors (Colm O'Dwyer et al, 2009; Chunhai Jiang et al,
2007; Dawei Liu et al, 2009). On the other hand, different carbon sources for carbon coating
around LiFePO
4
particles have been implemented at enhancing the intrinsic electronic
conductivity of LiFePO
4
. However, many obstacles have been encountered for these
methods from a laboratory process to mass production because of the complicated synthesis
techniques and the hard controlled synthesis situation. The lack of an excellent large-scale
synthesis technique is the obstacle to the commercial application of LiFePO
4
. Therefore, it is
critical to develop economic and efficient synthesis routes for the practical application of
LiFePO
4
materials.
2.3 Drawback analysis
Despite the above mentioned advantages, the observed electrochemical performances of
LiFePO
4
are found to be less impressive at high rates as this material has intrinsically poor
ionic and electronic conductivity. A report (Amin et al, 2007) on the electronic and ionic
properties of LiFePO
4
single crystals pointed out that the Li
+
conductivity was nearly four
orders of magnitude lower than the electronic conductivity along the b-and c-axes and many
orders of magnitude lower along the a-axis, implying that mass transport of Li
+
was crucial
for improving the kinetic issues. The low ionic conductivity can be attributed to the one-
dimensional nature of Li diffusion in unique olivine LiFePO
4
, as clearly shown by a recent
first principles calculation (Chuying Ouyang et al, 2004a, 2004b). Normally speaking, there
are three kinds of possible paths for lithium ions to transport, i.e. [010], [001], [101]. Fig.5 (b)
directs that three move paths, denoted as A, B and C direction, respectively. Figuring out
the diffusion pathways is always crucial in understanding the microscopic diffusion
mechanism. Some articles investigate the diffusion via computing with sorts of methods.
Saiful Islam calculated the activation energy of various passageways to estimate the most
possible transport route using well-established atomistic modeling techniques (Saiful Islam
LiFePO
4
Cathode Material
207
et al, 2005). The lowest Li migration energy is found for the pathway along the [010] channel
with a nonlinear, curved trajectory between adjacent Li sites. D Moran attained the diffusion
constant of Li ions in different axis with density functional theory (DFT)-based calculations
(D.Morgan et al, 2004) on LiMPO
4
(M Fe, Mn, Co, Ni), and have found low activation
barriers for Li ion motion through one-dimensional channels. Different calculation methods
lastly come into the same result as Tab.3 revealed.
a. b.
Fig. 5. Curved trajectories for Li ion migration between sites in the [010] direction. The
diffusion path lies out of the x-y plane. (a,2D model. b,3D model, A, B, C denote [010], [001],
[101] direction respectively)
This unique structure constrains the Li ions to move only in one wave-like chain since the
polyhedra are slightly distorted (illustrated in Fig.5a). This “wavelike” trajectory for long-
range migration results in lower migration energy than that of condition if the Li ion
followed a direct, linear path. The different energy barriers for the three species are mainly
due to the different atomic surroundings of the diffusion pathway, including the different
ionic position and bonding length. Distortion of the hcp oxygen array has been related to the
cation-cation coulomb repulsion across the shared edges.
D. Morgan M. Saiful Islam
[010] [001] [101] [010] [001] [101]
Space between Li-Li
Emig(eV)
Eact(eV)
D(cm
2
s
-1
)
3
0.27
10
-8
4.7
>2.5
10
-45
5.7
1
10
-19
3.01
0.55
4.67
2.89
5.69
3.36
Table 3. Description of Li+ migration path in LiFePO
4
crystal structure form some references
And within this crystal, all the FeO
6
-octahedra can’t form a share-edge network structure
because polyanions PO
4
separate them. Therefore electrons also can’t pass smoothly. In the
layered compounds such as LiCoO
2
, transition state of hybrid Co
4+
/Co
3+
anions make a
contribution to the electron conductivity between layers, whereas that don’t happen in
olivine LiFePO
4
structure because FePO
4
was formed after extraction of Li
+
.
Electric Vehicles – The Benefits and Barriers
208
The low temperature performance of LiFePO
4
is inferior. The capacity at 0.1C (156mAh g
-1
)
and 0.3C (148mAh g
-1
) at 25◦C deteriorate largely, and only 91mAh g
-1
and 65mAh g
-1
are
yielded at 0.1C and 0.3C at -20◦C respectively.
3. Avenues to enhance performance
The performances of LiFePO
4
, however, are limited by its poor electronic conductivity and
the sluggish kinetics of lithium ions to diffuse through the LiFePO
4
/FePO
4
interface, which
can result in a significant loss of capacity at high currents (Padhi et al., 1997; Prosini et al.,
2002). And the high power density is the requirement of the power batteries for electric
vehicles. Avenues of synthesizing composite materials, doping ions, nanocrystallization and
others are introduced to clarify its improved electrochemical properties.
3.1 Composite materials
Owing to the poor inherent electronic conductivity, LiFePO
4
can be incorporated with
conductive additives to form composite materials.
Fig. 6. The performances of C-LiFePO
4
composite materials (Aricò et al., 2005)
Carbon sources, such as acetylene black, glucose, sucrose and other organics, are added into
the raw material and then carbonized at high temperature to form LiFePO
4
/C materials. The
LiFePO
4
particals are tightly coated with carbon and the interface between crystallized
LiFePO
4
and amorphous carbon is nicely observed in Fig.6. An excellent cyclical stability is
also observed. The reasons of its outstanding electrochemical performances are that the
addition of carbon does not only perform its electrical conductivity, but also enhances
electrolyte penetration into the cathode (Aricò et al., 2005). And the uniform small grain size
would be beneficial to high rate performance. While the density of carbon is 40% lower than