Heat and Mass Transfer Modeling and Simulation Part 11 doc
Bạn đang xem bản rút gọn của tài liệu. Xem và tải ngay bản đầy đủ của tài liệu tại đây (1.11 MB, 20 trang )
Nonequilibrium Fluctuations in Micro-MHD Effects on Electrodeposition
191
*
,,, ,,, ,
a
mmm
cx
y
zt C x
y
zt C zt (2)
,,, ,,, ,,,
s
mm
cx
y
zt C x
y
zt C x
y
zt (3)
where superscripts ‘a’ and ‘s’ imply the asymmetrical and symmetrical fluctuations,
respectively.
,,,
m
Cx
y
zt
and
*
,
m
Czt are the concentration and the concentration in
electrostatic equilibrium, respectively.
,,,Cxyzt is the average concentration over the
electrode surface.
<C
m
(z)>
0
b
Double Layer
Diffusion Layer
Distance
Double Layer
Diffusion Layer
a
C
m
(z=∞)
0
Distance
c
m
(x, y, z, t)
a
c
m
(x, y, z, t)
s
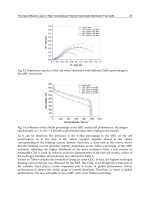
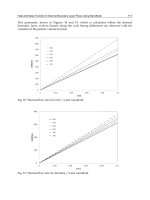
Fig. 3. Nonequilibrium fluctuations in electrodeposition. a, asymmetrical concentration
fluctuation, which occurs in the electric double layer, controlling 2D nucleation in the scale
of the order of 100 μm. b, symmetrical concentration fluctuation, which occurs in the
diffusion layer, controlling 3D nucleation on 2D nuclei in the scale of the order of
0.1 μm.
()
m
Cz , bulk concentration;
m
Cz, average concentration
(Aogaki et al., 2010).
At the early stage of electrodeposition in the absence of magnetic field, there are two
different kinds of the unstable processes of fluctuations. The first unstable process takes
place in the electric double layer. In the case of electrodeposition without any specific
adsorption, the overpotential of the double layer becomes negative with a positive gradient.
Supposing that a minute 2D nucleus is accidentally formed in the diffuse layer of the double
layer, at the top of the nucleus, due to the positive shifting of the potential, the double-layer
overpotential decreases with the nucleation, so that with the unstable growth of the
fluctuation, 2D nucleus is self-organized. As the reaction proceeds, outside the double layer,
a diffusion layer emerges. In electrodeposition, due to the depletion of metallic ions at the
electrode, the concentration gradient is also positive, so that the top of a 3D nucleus contacts
with higher concentration than other parts. This means that the concentration overpotential
decreases at the top of the nucleus. As a result, mass transfer is enhanced there, then the
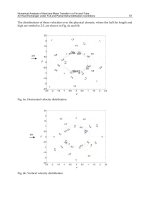
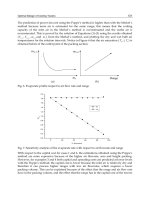
symmetrical fluctuations turn unstable, and the 3D nucleus is self-organized (Fig. 4a). In the
presence of magnetic field, however, except for early stage, depending on the direction of
magnetic field, nucleation proceeds in different ways; under a parallel magnetic field, as
shown in Fig. 4b, from the interference of the micro-MHD flow to the concentration
fluctuation in the diffusion layer, symmetrical fluctuations are always suppressed together
with 3D nucleation (1st micro-MHD effect).
Heat and Mass Transfer – Modeling and Simulation
192
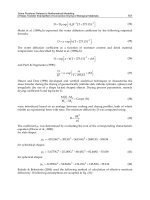
In the secondary nodule formation after long-term deposition, it has been newly found that
the flow mode of the solution changes from a laminar MHD flow to a convective micro-
MHD flow induced by the asymmetrical fluctuations, so that the diffusion layer thickness
slowly decreases with time, increasing electrolytic current. The mass transfer to 2D nuclei is
thus enhanced, and secondary nodules are self-organized (2nd micro-MHD effect). Figure 5
schematically exhibits the change in the flow mode.
a
b
Fig. 4. Disturbance of symmetrical concentration fluctuation around a 3D nucleus by micro-
MHD flow. a, without magnetic field, positive feedback process; b, with magnetic field,
suppression of fluctuation by micro-MHD flow.
a b
c
*
u
B
*
u
c
B
Fig. 5. Change in the flow mode from laminar one (a) to convective one (b). u*, velocity; B,
magnetic flux density;
c
, convective-diffusion layer thickness
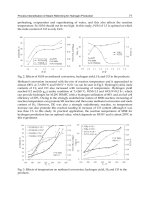
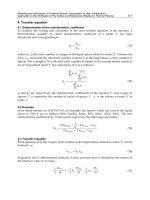
In a vertical magnetic field, for the appearance of chirality in vortex motion, ionic vacancy
formed with electrodeposition plays an important role; as shown in Fig. 6, ionic vacancy is a
vacuum void with a diameter of ca. 1 nm surrounded by ionic cloud (Aogaki, 2008b; Aogaki
et al., 2009b), which expands the distance between solution particles, decreasing their
interaction as a lubricant. In Fig. 7, it is shown that the vacancy generation during
electrodeposition yields two kinds of electrode surfaces; a usual rigid surface with friction
under a downward spiral flow of vortex, and a frictionless free surface covered with the
vacancies under an upward spiral flow. This is because at the bottom of the downward
flow, generated vacancies are swept away from the center, whereas under the upward flow,
they are gathered to the center of the bottom. Theoretical examination suggests that the
vortex rotation on the free surface is opposite to that on the rigid surface. As shown in Fig. 8,
in a system rotating counterclockwise from a bird view, on the rigid surface, due to friction
only a downward counterclockwise flow is permitted, while on a free surface, due to
slipping of solution, only an upward clockwise flow is permitted.
Nonequilibrium Fluctuations in Micro-MHD Effects on Electrodeposition
193
A
z
_
M
Zm
H
2
O
H
2
O
IHP
OHP
M
H
2
O
H
2
O
IHP
OHP
-
-
-
-
-
-
-
-
+
+
+
+
+
+
+
+
H
2
O
A
z_
H
2
O
H
2
O
A
z_
ez
m
z-
+
+
+
+
+
+
+
+
+
+
+
+
+
+
+
-
-
-
-
-
-
-
-
-
-
-
-
-
-
-
+
+
+
+
+
+
+
+
+
+
+
+
+
+
+
+
+
+
+
vacuum
a b
Fig. 6. Ionic vacancy. a, formation process, b, structure (Aogaki, 2008b). IHP, inner
Helmholtz plane; OHP, outer Helmholtz plane; M
zm+
, metallic ion; A
z-
, counter anion.
a b
Fig. 7. Formation of free and rigid surfaces by vacancies. ○, Vacancy; a, rigid surface exposed
without vacancies; b, free surface covered with vacancies (Aogaki et al., 2009c).
a b
Fig. 8. Two kinds of vortexes on rigid and free surfaces in a counterclockwise rotating
system from a bird view. ○, Vacancy; a, rigid surface; b, free surface (Aogaki et al., 2009c).
In such a system, not always magnetic field, but also macroscopic rotation such as vertical
MHD flow and system rotation mentioned above are required; the magnetic field generates
micro-MHD vortexes, and the macroscopic rotation, as shown in Fig. 9, bestows rotation
direction and precession on them, which induces the interference of the vortexes with the
concentration fluctuations. On the free surface of 2D nucleus, the metallic ions deposit in
keeping the clockwise motion, yielding micro-mystery circles with chiral screw dislocations.
This is the process of the formation of micro-mystery circle with chiral structure. On the
rigid surface of 2D nucleus, due to friction of the electrode surface, a stationary diffusion
layer is formed. Inside the static diffusion layer, in a fractal-like way, 3D nucleation induces
smaller micro-MHD vortexes of symmetrical fluctuation, creating concentric deposits called
nano-mystery circles. In the following sections, the roles of these nonequilibrium
fluctuations will be more precisely elucidated.
Heat and Mass Transfer – Modeling and Simulation
194
B
electrode
micro-MHD flow
vertical MHD flow
B
electrode
micro-MHD flow
System rotation
a b
Fig. 9. Precession of micro-MHD flows. a, by system rotation; b, by vertical MHD flow.
2. Instability in electrochemical nucleation
2.1 The first instability occurring in 2D nucleation
Assuming that a minute 2D nucleus is accidentally formed in the diffuse layer belonging to
electric double layer, we can deduce the first instability of asymmetrical fluctuations
(Aogaki, 1995). The electrochemical potential fluctuation of metallic ion at the outer and
inner Helmholtz planes (OHP, IHP) of the nucleus peak is, as will be shown in Eq. (15),
expressed by the electrostatic potentials and the concentration overpotential in the electric
double layer. The electrostatic potential fluctuation at the top of the nucleus
2
,, ,
a
a
x
y
t
in the diffuse layer is written by the potential fluctuation at the substrate
2
,,0,
a
x
y
t
and
the potential fluctuation varied by the nucleus
,,
a
a
Lx
y
t
,
22
,, , ,,0, ,,
a
aa
aa
x
y
tx
y
tLx
y
t
(4a)
where
a
is the surface height fluctuation of the 2D nucleus, and
a
L
is the average potential
gradient in the diffuse layer, defined by (Aogaki, 1995)
2
a
L
(4b)
where
is the Debye length, and
2
is the average potential fluctuation in the diffuse
layer. In the case of deposition at early stage, as shown in Figs. 10 and 12, due to cathodic
polarization, the average diffuse layer overpotential
2
takes a negative value
2
< 0 for
no specific adsorption or aniodic specific adsorption, and takes a positive value
2
> 0 for
cationic specific adsorption, so that the average potential gradient in the diffuse layer
a
L
becomes positive and negative, respectively. From Eq. (4a), the difference of the potential
fluctuation at the OHP between the top and bottom of the nucleus is thus given by
2
,, ,
a
a
x
y
t
=
a
L
,,
a
x
y
t
(5)
Nonequilibrium Fluctuations in Micro-MHD Effects on Electrodeposition
195
where
2
,, ,
a
a
x
y
t
2
,, ,
a
a
x
y
t
2
,,0,
a
x
y
t
(6)
In the same way as Eq. (5), the difference of the concentration fluctuation in the diffuse layer
is expressed by
,, , ,,
a
a
aa
mm
cx
y
tLx
y
t
(7a)
where
a
m
L
is the average concentration gradient in the diffuse layer, defined by (Aogaki,
1995)
*
2
0,
a
m
mm
zF
LCt
RT
(7b)
where
R is the universal gas constant, T is the absolute temperature,
m
z is the charge
number,
F
is Faraday constant, and
,, , ,, , ,,0,
aa
a
aa
mmm
cx
y
tcx
y
tcx
y
t
(8)
Since both fluctuations are in the Boltzmann equilibrium in the diffuse layer, from Eqs. (4b)
and (7b), the following relationship between
a
m
L
and
a
L
is obtained
*
0,
aa
m
mm
zF
LCtL
RT
(9)
On the other hand, the concentration overpotential is written by the Nernst equation.
*
,, ,
,, , ln
a
m
a
m
m
Cx
y
t
RT
xy t
zF
Cz
(10)
where
*
m
Cz is the bulk concentration. From Eq. (2), the concentration at the top of the
projection is written as
*
,, , 0, ,, ,
a
aa
mmm
Cx
y
tC tcx
y
t
(11)
Under the condition
*
,, , 0,
a
a
mm
cxy t C t
(12)
Eq. (10) leads to the concentration overpotential fluctuation
Heat and Mass Transfer – Modeling and Simulation
196
*
,, ,
,, ,
0,
a
a
a
m
a
m
m
cx
y
t
RT
Hxy t
zF
Ct
(13)
where the approximation
**
,, , 0,
a
mm
Cx
y
tC t
(14)
is used. Therefore, expanding the potential area to Helmholtz layer, we obtain the difference
of the electrochemical potential fluctuation between the top and bottom of the nucleus.
12
*
,, , ,, ,, , ,, ,
0,
aaa
a
aaa
mm m
m
RT
xy t z F xyt xy t c xy t
Ct
(15)
1
,,
a
x
y
t
and
2
,,,
a
x
y
zt
are the fluctuations of the electric potentials at the inner
Helmholtz plane (IHP) (Helmholtz layer overpotential) and outer Helmholtz plane (OHP)
(diffuse layer overpotential), respectively. Substitution of Eqs. (5) and (7a) into Eq. (15) with
Eq. (9) leads to the cancellation of
2
,, ,
a
a
x
y
t
and
,, ,
a
a
m
cx
y
t
, so that only the term
of the Helmholtz layer overpotential
1
,,
a
x
y
t
survives. i.e.,
1
,, , ,,
a
a
a
mm
x
y
tzF x
y
t
(16)
1
,,
a
x
y
t
and
2
,, ,
a
a
x
y
t
are related by the differential double-layer potential
coefficient
12
/
(Aogaki, 1995).
1
12
2
,, ,, ,
a
a
a
x
y
tx
y
t
(17)
where it should be noted that
1
and
2
denote the average values of the asymmetrical
overpotential fluctuation of the Helmholtz and diffuse layers
1
,,
a
x
y
t
and
2
,, ,
a
a
x
y
t
, respectively. The subscript
suggests that chemical potentials (activities)
of the components are kept constant. Therefore,
1
,,
a
x
y
t
is expressed by
1
,,
a
xyt
=
1
2
2
,, ,
a
a
x
y
t
(18)
Substituting Eq. (18) into Eq. (16), we have
1
2
,, ,
a
a
mm
xy t z F
2
,, ,
a
a
x
y
t
(19)
Nonequilibrium Fluctuations in Micro-MHD Effects on Electrodeposition
197
a b
Electrode
IHP
Solution
0
Electrode
IHP
Solution
0
0
2
1
Distance
Electrode
Solution
IHP
OHP
HL DL
1
2
L
0
L
Electric potential
0
2
1
Distance
Electrode
Solution
DL
0
L
Electric potential
2
1
L
IHP
OHP
HL
Fig. 10. Electrostatic potential distribution in the electric double layer. a; the case when
specific adsorption is weak or absent, b; the case when anionic specific adsorption is strong.
HL, Helmholtz layer; DL, diffuse layer.
The sign of the difference of the electrochemical potential fluctuation is determined by the
difference of the potential fluctuation in the diffuse layer and the differential double-layer
potential coefficient. As shown in Fig.10, in the case where no specific adsorption or anionic
specific adsorption takes place, since the former is positive in the early stage of deposition (Eq.
(5)), the sign of the electrochemical potential fluctuation depends on the latter value. When the
specific adsorption of anion is absent or weak, i.e.,
12
/
> 0 is fulfilled,
,, ,
a
a
m
x
y
t
becomes positive. In view of the cathodic negative polarization in the diffuse
layer, this means that at the top of the peak, the reaction resistance decreases, so that the
nucleation turns unstable. In the case of strong specific adsorption of anion, due to the
minimum point of the potential at the OHP shown in Fig.10b, on the contrary,
12
/
< 0 is derived. As a result, the difference of the electrochemical-potential
fluctuation in Eq. (19) becomes negative, which heightens the reaction resistance, leading to
stable nucleation. When cationic specific adsorption occurs, as shown in Fig. 12b, due to
negative potential gradient, .
2
,, ,
a
a
x
y
t
. becomes negative (Eq. (5)). Since cation does not
yield intense specific adsorption, the potential distribution does not have a maximum point, so
that
12
/
>0 is held. Therefore,
,, ,
a
a
m
x
y
t
< 0 leads to stable nucleation.
Namely, at early stage, specific adsorption always suppresses 2D nucleation.
Without strong adsorption of anion or cation, the deposition process is accelerated, so that
the asymmetrical fluctuation turns unstable, finally the 2D nucleus is self-organized. It is
concluded that the asymmetrical fluctuations control the total electrode reaction, and the
total electrolytic current increases.
Heat and Mass Transfer – Modeling and Simulation
198
2.2 The second instability in 3D nucleation
As the reaction proceeds, outside the double layer; a diffusion layer is simultaneously
formed, where the second instability occurs. According to the preceding paper (Aogaki et
al., 1980), Fig. 11 shows the potential distribution in the diffusion layer, where an embryo of
3D nucleus is supposed to emerge. Since in the diffusion layer, due to metal deposition, the
average concentration gradient of the metallic ion
m
L
becomes positive, the difference of the
concentration fluctuation between the top and bottom of the embryo becomes positive.
Electrode
Diffusion Layer
Solution
0
Distance
Electrode
Solution
Concentration overpotential
0
0
H
0H
Fig. 11. Concentration distribution of metallic ion in the diffusion layer.
,, , ,,
s
s
s
mm
cx
y
tLx
y
t
(> 0) (20)
where
s
is the surface height fluctuation of 3D nucleus. As will be discussed later, with the
average thickness of the convective-diffusion layer
c
(> 0) and the concentration
difference between the bulk and surface
*
(> 0), the average concentration gradient of the
diffusion layer is written by
*
m
c
L
(> 0) (21)
According to Eqs. (3) and (13), for the symmetrical fluctuations, it is held that the difference
of the concentration overpotential is also positive in the following,
,, ,
s
s
Hx
y
t
=
,,0,
mm
RT
zFC xy t
,, ,
s
s
m
cx
y
t
( > 0 ) (22)
where
s
H
is defined by the difference of the fluctuation between the top and the bottom
of the nucleus
Nonequilibrium Fluctuations in Micro-MHD Effects on Electrodeposition
199
,, ,
s
s
Hx
y
t
,, ,
s
s
Hx
y
t
,,0,
s
Hx
y
t
(23)
Since the concentration overpotential takes a negative value for metal deposition, this means
that at the top of the nucleus, the concentration overpotential decreases, accelerating
instability, i.e., the following unstable condition is always fulfilled.
,, ,
s
s
Hxy t
> 0 (24)
Since the concentration gradient is positive, the top of the 3D nucleus contacts with higher
concentration than other parts. Namely, the concentration overpotential decreases there, and
mass transfer is enhanced. As a result, the symmetrical fluctuations always turn unstable,
and the 3D nucleus is self-organized (Fig. 4a). However, in a magnetic field, since the micro-
MHD flows interfere with the concentration fluctuation and disturb it, the 3D nucleation is
resultantly suppressed together with not always the symmetrical concentration fluctuation
but also the micro-MHD flow (1st micro-MHD effect)(Fig. 4b).
2.3 The third instability in secondary nodule formation
At the later stage of deposition, a grown 2D nucleus protrudes out of the double layer into
the diffusion layer, which means that the nucleus develops under the same situation as that
of 3D nucleation discussed above. At the same time, rate-determining step is changed from
electron-transfer in the electric double layer to mass transfer in the diffusion layer, and
expressed by the concentration overpotential; instability arises from the fluctuation of the
concentration overpotential,
a
H
around the 2D nucleus, and the difference of the
fluctuation between the top and the bottom of the nucleus
a
H
is defined by
,, ,
a
a
Hx
y
t
,, ,
a
a
Hx
y
t
,,0,
a
Hx
y
t
(25)
Though
a
H
is expressed by Eq. (13), i.e.,
,, ,
a
a
Hx
y
t
=
*
,, ,
0,
a
a
m
mm
RT
cxy t
zFC t
(26)
the difference of the concentration fluctuation is given not by
a
m
L but by
m
L
.
,, ,,
a
a
a
mm
cxy L xyt
(> 0) (27)
Due to the positive values of
m
L and
,,
a
a
m
cxy
,
,, ,
a
a
Hxy t
in Eq. (26) becomes
positive. Since cathodic polarization gives negative concentration overpotential, this
indicates the decrease of the overpotential at the top of the 2D nucleus. Namely, from the
same reason as the second instability, the unstable condition for 2D nucleation in the
diffusion layer is always fulfilled. In view of the fact that the 2D nucleation arises from the
electrode reaction process in the double layer, this unstable condition must be rewritten by
the parameters of the double layer. With the ohmic drop disregarded, assuming that the
total overpotential is kept constant, we can derive the following relationship between the
fluctuations of the electrochemical potentials at the double layer and the diffusion layer.
Heat and Mass Transfer – Modeling and Simulation
200
,, ,
a
a
m
xy t
=
,, ,
a
a
m
zF Hxy t
(28)
As a result, it is concluded that
,, ,
a
a
m
xy t
< 0 is the unstable condition for the
secondary nodule formation from 2D nuclei in the diffusion layer. This condition also
corresponds to the stable condition in the first instability of 2D nucleation. As shown in Fig.
12a, according to Eq. (19), for an anionic adsorbent, the positive difference
2
a
(> 0) in Eq.
(5) from the negative overpotential
2
, and the negative value of the differential double
layer potential coefficient
12
/
(< 0) due to strong specific adsorption give the
unstable condition
,, ,
a
a
m
xy t
< 0. For a cationic adsorbent, since usually cation does
not yield strong specific adsorption, as shown in Fig. 12b, negative difference
2
a
(< 0) in
Eq. (5) from the positive overpotential
2
, and the positive value of
12
/
(> 0)
due to weak specific adsorption lead to the same unstable condition
,, ,
a
a
m
xy t
< 0.
Namely, after long-term deposition, whether adsorbent is anionic or cationic, specific
adsorption induces unstable secondary nodule formation.
ab
Electrode
IHP
i
Solution
i
Solution
Electrode
IHP
2
1
Distance
Electrode
Solution
IHP
OHP
HL DL
Electric potential
0
Electrode
Distance
Solution
IHP
OHP
HL
DL
Electric potential
0
2
1
Fig. 12 Potential distribution in the electric double layer by specific adsorption. a, anionic
adsorbent; b, cationic adsorbent.
3. First and second micro-MHD effects in a parallel magnetic field
Magnetic field affects the unstable processes of the nucleation, suppressing or enhancing
them, so that the morphology of deposit is drastically changed. In a magnetic field,
electrochemical reaction induces the fluid motion by Lorentz force called MHD flow, which
enhances mass transfer (MHD effect). At the same time, the MHD flow generates minute
Nonequilibrium Fluctuations in Micro-MHD Effects on Electrodeposition
201
vortexes and convection cells called micro-MHD flows, which are the nonequilibrium
fluctuations of MHD flow, often interacting with other nonequilibrium fluctuations, i.e.,
asymmetrical and symmetrical fluctuations accompanying nucleation; for 3D nucleation, the
growth of symmetrical fluctuation is suppressed, and the sizes of 3D nuclei decrease (1st
micro-MHD effect)(Fig. 4b). For 2D nucleation, asymmetrical fluctuations develop with
secondary nodules (2nd micro-MHD effect)(Fig. 5b).
In Fig. 1, the magnetic flux density is applied in z-direction, and the current flows in y-
direction, so that the resultant MHD main flow occurs in x-direction. In the boundary layer,
micro-MHD flows arise from hydrodynamic and MHD interactions. The equations of the
nonequilibrium fluctuations including micro MHD flows on the solution side under a parallel
magnetic field have been established (Morimoto et al., in the course of submission-a). The
equations are changed to the amplitude equations by Fourier transformation with respect to x-
and y-directions. In view of the low electric conductivity and small representative length of
electrochemical system, the effect of electromagnetic induction can be disregarded. For
calculating the first and second micro-MHD effects, the amplitude equations are solved; the
amplitude of the z-component of the velocity fluctuation
w
is
02
2
,
kz
Wzt Atze
(29)
and the amplitude of the z-component of the vorticity fluctuation
z
is
0
,zt =
3/4
*
0
2
4
kz
c
y
B
k
iT A tze
k
(30)
Then, at the electrode surface, the amplitude of the concentration fluctuation
m
c
is expressed by
0
1/4 3/4 1/4
3* 5 *2* * 5 *2
2
3/4
42 3 *
0,
432 16 5
28
cmyxcxc my
mmc y xc x
t
k T k zFk iB k T k zFk
A
t
zFD kk k iB k
(31)
where
x
k and
y
k
are the x- and y-components of the wave number k, respectively, and
*
T
3/4
3/2 5/4 1/4 *3/4 9/4
00
1.6307
mm
zFD L B
(32)
3/4 3/4
*13/21/4*
0
1.6307
xmm
m
BzFD LB
D
(33)
The amplitude of the concentration gradient fluctuation at the electrode surface is written by
0
0,Dt
=
2
*
2
3/4
8
y
mmc
Tk
A
t
k
zFD
(34)
where
zD /
, the coefficient
2
At is an arbitrary function of time, and
is the cell
constant of MHD electrode.
0
is the magnetic permeability,
is the kinematic viscosity,
Heat and Mass Transfer – Modeling and Simulation
202
is the density, and
m
D is the diffusion coefficient.
0
B
is the magnetic flux density, L is the
electrode length, and
*
is the concentration difference between the bulk and surface.
Equations (31) and (34) are connected to calculate
2
A
t
with the amplitudes of the
fluctuations on the electrode side. In the following sections, the amplitudes of the
symmetrical and asymmetrical fluctuations on the electrode side are derived.
3.1 First micro-MHD effect
In electrodeposition, hydrated metallic ions are traveling from the bulk to the electric double
layer through the diffusion layer. At the double layer, dehydration first takes place, and
adsorption follows at the Helmholtz layer. Transferring electrons, the adsorbed ions become
adatoms, and some of them take part in nucleation. Other adatoms, according to the
difference of surface energy, transfer along the electrode surface, settling as lattice atoms.
Since the rate of electron transfer is sufficiently high, the mass transfer processes in the
solution phase and the crystal phase become rate-determining steps, so that the electron
transfer process is assumed in quasi-equilibrium state.
The mass balance of adatoms consists of the mass flux density of metallic ions from solution
phase and the mass flux densities of adatoms by surface diffusion and incorporation to
crystal lattices, i.e.,
s
f
lux
j
,
s
sur
f
j
and
s
inc
j
, respectively.
,,
s
sss
ad sur
ff
lux inc
cxyt j nj nj
t
(35)
where
,,
s
ad
cx
y
t is the symmetrical fluctuation of the adatom concentration, n
is the unit
normal vector of the electrode surface, and
/,/x
y
. Equation (35) is explicitly
described as (Morimoto et al., in the course of submission-b)
**4
1
,, ,, ,,,
sss
ad
mad mm
m
D
x
y
tCx
y
tDncx
y
zt
tRT
(36)
where
44 44 4
//x
y
.
m
is the molar volume,
*
is the surface energy,
ad
D is
the surface diffusion coefficient, and
*
ad
C is the adatom concentration.
Fourier transformation of Eq. (36) allows us to derive the amplitude equation.
0**40 0
1
0,
sss
ad
mad m
m
D
tCktDDt
tRT
(37)
Substituting for
0
0,
s
Dt from Eq. (34) in Eq. (37), we finally have the amplitude equation
of
s
0
1
s
s
d
Zt p
dt
Zt
(38)
Equation (38) is solved as
00
0exp
ss
Zt Z
p
t (39a)
Nonequilibrium Fluctuations in Micro-MHD Effects on Electrodeposition
203
where
p
is the amplitude coefficient, i.e.,
*
2* * 4 2
,,0,
ad m
madmMHDmmm m
D
p
Ck DkL C x
y
tk
RT RT
(39b)
where
mMHD
is the micro-MHD coefficient describing the effect of the micro-MHD flow on
3D nucleation, being expressed by
1/4 3/4
*53*
1/4 3/4 1/4
3* 5 *2* * 5 *2
16 8
432 16 5
cxcx
mMHD
cm
y
xc x c m
y
TkkiB k
k T k zFk iB k T k zFk
(39c)
As shown in Eq. (39c),
mMHD
is a complex number, acting as a spatial filter for the
fluctuations, which controls the first micro-MHD effect, decreasing nucleus size. Actually,
in the case of
mMHD
= 1, the amplitude coefficient p is consistent with that in zero
magnetic field (Aogaki et al., 1980). However, in general, due to the complex number of
mMHD
, the amplitude coefficient p also becomes complex number; Eq. (39a) is rewritten
as
00
0expRe expIm
s
s
tptipt
(40a)
where
Re
p
and Im
p
denote the real and imaginary parts of
p
. In Eq. (40a), the part of
exp Imi
p
t expresses oscillation with time. However, because of the smallness of the Im
p
,
in comparison with the representative time of 3D nucleation, the period of the oscillation is
quite long, so that such oscillation can be neglected, i.e.,
00
0expRe
s
s
tpt
(40b)
In Eq. (39b), as long as
m
L is positive Re
p
becomes positive for some wave number k,
which leads to the unstable growth of 3D nuclei discussed in Section 2.2. The real part
Re
mMHD
is a spatial high-pass filter concerning the wave number of fluctuation. According
to Eq. (40b), the component of fluctuation corresponding to the wave number region of
Re
p
> 0 can unstably develops with time. In this process, since
Re
mMHD
restricts such unstable
growth of 3D nucleus with smaller wave number (larger nucleus size), first micro-MHD
effect emerges.
0
0
s
is the initial amplitude of the symmetrical surface fluctuation. In view of the thermal
motion in atomic scale, assuming an isotropic white noise with normalization, we obtain the
equation of the initial amplitude,
2
0
0
s
=
2
2
max
s
cr
XY
k
(41)
Heat and Mass Transfer – Modeling and Simulation
204
where
2s
cr
is the mean square height of surface fluctuation in atomic scale at the initial
state. X and Y are the x- and y-lengths of the electrode, respectively.
max
k
is the upper limit
of the wave number. Inserting Eq. (40a) into Eq. (37), and using Eq. (39b), we obtain
*
020
0, , ,0, 0
s
s
m
mMHD m m
Dt kL Cxytk
RT
(42)
By using Fourier inversion,
0
Re 0,
s
Dt is converted to
0
,,, /
s
m
z
cxyzt z
, i.e.,
0
0
,,,
1
Re 0, exp
2
s
s
m
x
y
x
y
z
cxyzt
Dt ikxkydkdk
z
(43)
Then, the mass flux of the symmetrical fluctuation is given by
0
,,,
,,0,
s
s
m
flux m
z
cxyzt
jxyt D
z
(44)
The effective surface heights of the 3D nuclei are also calculated in the following,
0
1
,, ,,0,
s
t
s
flux
m
x
y
t
j
x
y
tdt
(45)
a
b
a1 a3 a2
b1 b3b2
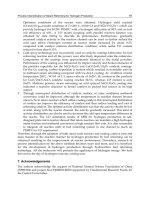
Fig. 13. First micro-MHD effect. a; calculation of the morphology of copper 3D nuclei. a,
calculation: a1,
0
B
= 0 T; a2,
0
B
= 5 T; a3,
0
B
= 14 T. b, SEM image: b1,
0
B
= 0 T; b2,
0
B
= 5
T; b3,
0
B
= 14 T (Morimoto et al., in the course of submission-b).
Nonequilibrium Fluctuations in Micro-MHD Effects on Electrodeposition
205
5 0
0
Z / μm
5
5 0
0
Y / μm
5
X / μm X / μm
a b
Fig. 14. Horizontal and cross-sectional distributions of micro-MHD flow. a, horizontal
distribution; b, cross-sectional distribution. B
0
= 5 T (Morimoto et al., in the course of
submission-b).
In Fig. 13, the theoretical calculation and experimental result of first micro-MHD effect are
exhibited; as magnetic flux density increases, the size of 3D nucleus decreases. In Fig. 14, the
micro-MHD flows corresponding to the 3D nucleation are exhibited.
3.2 Second micro-MHD effect
3.2.1 Instability equation
Due to large scale of length (
100 μm), the asymmetrical fluctuations controlling 2D
nucleation result not from the nucleation process on the electrode surface but from the
electrochemical reaction process in the electrical double layer and the micro-MHD flow in
the convective diffusion layer; since the term with higher power of wave number is
neglected, the equation corresponding to Eq. (37) is simply expressed by
00
1
0,
ss
m
m
tDD t
t
(46)
At the same time, from Eqs. (5), (19), (26) and (28), the following relationship is finally
derived as
1
0*0
2
0, 0,
aa
a
m
m
zF
tLCtZt
RT
(47)
Since 2D nucleation is controlled by micro-MHD flow, not the surface height fluctuation but
the concentration fluctuation determines the Gaussian power spectrum. The amplitude of
the concentration fluctuation is thus expressed by
2
0
0,
a
t =
*2 2 2 2
exp
XY
aak
(48a)
c
a
m
(48b)
Heat and Mass Transfer – Modeling and Simulation
206
where
a
is the autocorrelation distance of the fluctuations, which is defined by the average
thickness of the convective-diffusion layer
c
and the number of vortexes m vertically
standing in a line between the electrode and the diffusion layer boundary, i.e., the
a
is
equal to the average size of the vortex.
Substituting Eq. (47) into Eq. (46), we obtain the evolution equation of the asymmetrical
fluctuation.
0
0
0,
0,
a
a
t
A
Dt
t
(49a)
where
*
21
2
0,
mmmm
zFD C t
A
RT
(49b)
The unstable condition is therefore
0A
(49c)
Namely, with Eq. (49c), the same instability analysis as discussed in Section 2.3 is also
possible. Substituting for
0
0,
a
t and
0
0,
a
Dt from Eqs. (31) and (34) in Eq. (49a), we
obtain the equation of the coefficient
2
At as follows,
2
2
a
a
c
dA t
hAt
dt
(50a)
where
*6
16
cc
hTAkh
(50b)
The explicit form of
c
h
is given by
c
h
1/4 3/4
3*
1/4 3/4 1/4
3* 5 *2* * 5 *2
8
432 16 5
cxcx
cm
y
xc x c m
y
kiB k
kT kzFkiB kT kzFk
(50c)
3.2.2 Calculation of the average thickness of diffusion layer
c
To calculate the coefficient
2
At in Eq. (50a), as shown in Eq. (48b), it is necessary to
determine the value of
c
. After long-term deposition, it is thought that the asymmetrical
concentration fluctuation has already developed to the maximum point, so that the
secondary nodule formation fulfills the following condition concerning the mean square
value of the asymmetrical concentration fluctuation over the electrode surface.
Nonequilibrium Fluctuations in Micro-MHD Effects on Electrodeposition
207
2
,,0, 0
a
m
d
cxyt
dt
(51a)
Here, the Rayleigh theorem suggests the relationship
2
,,0,
a
m
cxyt =
2
0
1
0,
a
x
y
tdkdk
XY
(51b)
From Eq. (51b), more generally, it can be said that the mean square value of the fluctuation
is calculated by the integration of that of the amplitude. Although the concentration
fluctuation has already grown up to its ultimate state, the gradient of the fluctuation can still
develop with new components of the fluctuation; this inevitable development of the micro-
MHD convection leads to the decrease of the convective-diffusion layer thickness,
promoting mass transfer process (Fig. 5). In terms of the mean square values of the
concentration fluctuation and its gradient, the average thickness of the convective-diffusion
layer is defined by
2
2
2
0
,,0,
,,,
a
m
c
m
z
cxy t
m
cxyzt
z
(52)
From Eq. (48b), the term on the left hand side in Eq. (52) is equal to the square value of the
autocorrelation distance of the fluctuation. By differentiating Eq. (52) with respect to time,
the following nonlinear evolution equation is derived.
c
cc
d
f
dt
(53a)
where
2
2
0
22
0
,,,
,,0,
2,,0,
,,,
2
a
m
a
m
z
c
a
a
m
m
z
cxyzt
d
d
dt z
cxyt
dt
f
cxy t
cxyzt
z
(53b)
After solving Eq. (53a), the average current density is calculated by
*
/
a
zmm c
jzFD
(54)
In the case of copper deposition from sulfuric acid solution, the condition
12
/0
are generally fulfilled (Aogaki et al., 2010), so that from Eq. (49c), a
positive diffuse layer overpotential
2
0
is required for secondary nodule formation.
Heat and Mass Transfer – Modeling and Simulation
208
However, since copper deposition is a cathodic reaction, the diffuse layer overpotential is
usually supposed negative, of which contradiction is, as discussed in Section 2.3, solved by
the adsorption of cation such as proton in the double layer, where the positive charges of
protons adsorbed on the Helmholtz layer shift the overpotential to positive side. Such
discussion has been validated in Fig. 15 by the scanning electron microscope (SEM) images
for the copper depositions with and without the adsorption of protons, i.e., the secondary
nodules can be seen only in the case of proton adsorption.
Theoretical current-time curve was calculated by means of Eqs. (53a) and (53b). Figure 16
exhibits the comparison between theoretical calculation and experimental result of current-
time curves for the copper deposition. Both curves are in good agreement, quite slowly
increasing up to a steady state. From the calculation, it is estimated that the value of
2
is
small, i.e., the order of 1 mV. To ascertain the above discussion, based on the theory, we
calculated the surface morphology of secondary nodules and the velocity distribution of the
micro-MHD flows. Figure 17 represents the surface morphology, and Fig. 18 represents the
horizontal and vertical velocity distributions of the corresponding micro-MHD vortexes.
500μm
ab
Fig. 15. SEM photos of secondary nodules. a, without the adsorption of H
+
ions; b, with the
adsorption of H
+
ions (2nd micro-MHD effect) (Aogaki et al., 2010).
0
10
20
30
0 400 800 1200
t / s
| i
calc
| / A dm
-2
ab
0
10
20
30
0 400 800 1200
t / s
| i | / A dm
-2
Fig. 16. Current-time curves for secondary nodule formation in copper deposition up to
1200 s. a; calculation, b; experimental result. Applied overpotential, -0.4 V; bulk
concentration, 300 mol m
-3
. B = 5 T (Aogaki et al., 2010).
Nonequilibrium Fluctuations in Micro-MHD Effects on Electrodeposition
209
Fig. 17. Calculated surface morphology of copper secondary nodules. B = 5 T. Deposition
time is 1000 s, and concentration is 300 mol m
-3
. Nucleation takes place at the interval of 10 s
(Aogaki et al., 2010).
b a
Fig. 18. 2nd micro-MHD flows in the formation of copper secondary nodules at 5 T.
a, horizontal motion at z = 30 μm; b, cross-sectional motion at y = 30 μm, where the xy-plane
is taken as an electrode surface, and the z coordinate is used for deposition height.
4. Chirality appearance in a vertical magnetic field
In electrodeposition under a vertical magnetic field, as discussed in 1. Introduction,
it is thought that instead of vortexes with chiral symmetry, vortexes having chirality
emerge. The best way to make clear the process of the evolution of the chirality is to
pursue how chiral symmetry is broken down from a perfectly symmetrical state. Instead
of vertical MHD flow, as shown in Fig. 19, a more simple case is taken where an
electrochemical system is rotating under a vertical uniform magnetic field, and also it is
assumed that current density is uniform and the current lines are vertical everywhere. It
should be noted that the whole system including the electrodes and solution rotates all in
one body.
Heat and Mass Transfer – Modeling and Simulation
210
W.E
C.E
j
B
0
Fig. 19. Schematic of a rotating electrolysis system. W.E, working electrode; C.E., counter
electrode;
, angular velocity;
0
B , magnetic flux density (Aogaki et al., 2009d).
After starting electrodeposition, nonequilibrium fluctuations are introduced; asymmetrical
fluctuations for 2D nucleation and symmetrical fluctuations for 3D nucleation. Then, the
evolution of the fluctuations is calculated within MHD framework. In this case, whole
system is rotating in an angular velocity
(> 0) clockwise when seeing the solution from
electrode side. The rotating axis of this system is perpendicular, and the magnetic flux
density
0
B (>0) is upward applied vertically to the electrodes. The nonequilibrium
fluctuation equations to describe the micro-MHD flows and the concentration fluctuation
are first derived, which are then transformed to the amplitude equations by Fourier
transformation. The amplitude equations are solved under the boundary conditions
concerning rigid and free surfaces. For a rigid surface under a downward flow
r
w
(z-component of the velocity) < 0, at the electrode surface, the amplitude of the
concentration gradient fluctuation is expressed by
0
0,
r
Dt
=
1
12
5
mm
a
zFDS
(55a)
The amplitude of the concentration fluctuation at the electrode surface is
0
0,
r
t
=
5*
1
6
384 9
160
mmr
mm
k z FD ST R
a
zFDSk
(55b)
For a free surface under an upward flow
f
w (z-component of the velocity) > 0, at the electrode
surface, the amplitude of the concentration gradient fluctuation is
0
0,
f
Dt
=
0
12
5
mm
ka
zFDS
(56a)
The amplitude of the concentration fluctuation at the electrode surface is
0
0,
f
t =
5*
0
5
96 5
40
mmf
mm
kzFDSTR
a
zFDSk
(56b)
where
0
B
S
(57)