Ferroelectrics Characterization and Modeling Part 3 docx
Bạn đang xem bản rút gọn của tài liệu. Xem và tải ngay bản đầy đủ của tài liệu tại đây (5.16 MB, 35 trang )
Ferroelectrics - Characterization and Modeling
60
Wang, Y-T.; Tang, G-M.; Wan, W-Z.; (2006). Naphthalene-2,7-diol-imidazole, Acta
Crystallographica, Vol. E62, (2006), pp. o-3396-o3397.
Piecha, R. Jakubas, , A. Pietraszko; Baran, J.; (2007). Structural characterization and
spectroscopic properties of imidazolium chlorobismuthate(III): [C
3
H
5
N
2
]
6
[Bi
4
Cl
18
],
Journal of molecular structures , Vol. 844-845, (2007), pp. 132-139.
Bujak, M.; Zaleski, J.; (2003). Structure of chloroantomonates(III) with imidazolium cation
(C
3
H
5
N
2
)SbCl
4
and (C
3
H
5
N
2
)
2
SbCl
5
Journal of Molecular structures, Vol. 647 (2003).
pp.121-128.
Zhang H.; Fang,L.; Dronskowski,D.; Krauze,K,; Yuan,R.; (2005).
Bis(imidazolium)hexachlorostrontate(IV), Acta Crystallographica, Vol.E61, (2005),
m541-m542.
Valle, G.; Ettorore, R.; (1991). Bis(imidazolium)tetrachloropalladium, Zietschrift fur
Kristallographie, Vol.212, (1997), pp. 166-168.
Levasseur, G.; Beauchanyp, A. L.;(1991). Structure of imidazolium hexachlorotantalate (V),
Acta Crystallographica, Vol. C47, (1991), pp.547-550.
Adams, Ch.; Kurawa, M. A.; Lusi, M.; Orpen, A. G.; (2008). Solid State synthesis of
coordination compounds from basic metal salts, Crystals Engineering
Communications,Vol.10 (2008) pp.1790-1795
Piecha, A.; Kinzhybalo, K.; Slepokura, K.; Jakubas, R.; (2007). Structural characterization,
thermal and electrical properties of imidazolium bromoantimonate
(III)(C
3
H
5
N
2
)
3
Sb
2
Br
9
, Journal of Solid State Chemistry, Vol. 180, (2007), pp. 264-275.
Loeffen P. W.; Pettifer, R. F.; Fillaux, F.; Kearley, G.J.; (1995). Vibrational force field of solid
imidazole from inelastic neutron scattering. Journal of Chemical Physics. Vol. 103,
(1995) pp.8444-8455.
Piecha, A.; Jakubas, R.; Bator, G.; Baran, J. (2009). Infrared investigations of the order–
disorder ferroelectric phase transitions in imidazolium halogenobismuthates (III)
and halogenoantimonates (III): (C
3
N
2
H
5
)
5
Bi
2
Cl
11
, (C
3
N
2
H
5
)
5
Bi
2
Br
11
and
(C
3
N
2
H
5
)
5
Sb
2
Br
11,
Vibrational spectroscopy Vol. 51.No. 2, (2009) ,pp.226-237.
Jeffrey, G.A.; An Introduction to Hydrogen Bonding, New York, Oxford, 1997.
Przeslawski, J.; Kosturek, B.; Dacko, S.; Jakubas, R.; (2007). Thermal and optical properties of
the ferroelectric (C
3
N
2
H
5
)
5
Bi
2
Cl
11
crystal , Solid State Communications.Vol.142, (2007),
713-717.
Slichter, C.P.; Principles of magnetic resonance, Springer Verlag, Berlin, Heidelberg, New York
1980.
Van Vleck, J. H.; The dipolar broadening of magnetic resonance lines in crystals, Physical.
Review. Vol.74, (1948), pp.1168-1183.
Gutowsky, H. S.; Pake, G. E.; Nuclear Magnetism in Studies of Molecular Structure and
Rotation in Solids: Ammonium Salts, Journal of Chemical Physics. Vol. 18, (1950),
162-163.
Zdanowska-Fraczek, M.; Holderna-Natkaniec, K.; Fraczek, Z. J.; Jakubas, R.; Molecular
dynamics and electrical conductivity of (C
3
N
2
H
5
)
5
Bi
2
Cl
11
, Solid State Ionics , Vol. 180,
No. 1, (2009), pp. 9-12.
Munch, W.; Kreuer K. D.; Silvestri, W.; Maier, J.; Seifert, G.;The diffusion mechanism of an
excess proton in imidazole molecule chains: first results of an ab initio molecular
dynamics study, Solid State Ionic, Vol.145, No.1-4, (2001) , pp. 437-443.
4
Structure – Property Relationships of
Near-Eutectic BaTiO
3
– CoFe
2
O
4
Magnetoelectric Composites
Rashed Adnan Islam
1
, Mirza Bichurin
2
and Shashank Priya
3
1
Philips Lumileds Lighting Co, 370 W. Trimble Rd, San Jose CA,
2
Inst. of Electron. & Inf. Syst., Novgorod State Univ., Veliky Novgorod,
3
Materials Science and Engineering, Virginia Tech, Blacksburg, VA 24061,
1,3
USA
2
Russia
1. Introduction
Magnetoelectric (ME) materials become magnetized when placed in an electric field, and
conversely electrically polarized when placed in a magnetic field. Dielectric polarization of a
material under magnetic field, or an induced magnetization under an electric field, requires
the simultaneous presence of long-range ordering of magnetic moments and electric dipoles
(Suchtelen, 1972; Smolensky, 1958; Astrov, 1968; Fiebig 2005). Said materials offer potential
for new generations of sensor, filter, and field-tunable microwave dielectric devices
(Bichurin, 2002). Unfortunately to date, the ME exchange in single phase materials has been
found to be quite small (Dzyaloshinskii, 1959; Astrov, 1960). However, quite large effects are
found in composites of piezoelectric and magnetostrictive phases, both of the particle-
particle and laminate (Ryu, 2002a, 2002b) types. In these composites, enhanced ME exchange
is the result of an elastic-coupling mediated across the piezoelectric-magnetostrictive
interfacial area. The original work on ME composites concerned particle-particle composites
and was performed at the Philips Laboratories.
These ME composites were prepared by
unidirectional solidification of an eutectic composition of the quinary system Fe-Co-Ti-Ba-O
(O’dell, 1965; Boomgaard, 1976). The eutectic composition was reported to consist of 38
mol% CoFe
2
O
4
. Unidirectional solidification helps in the decomposition of the eutectic
liquid (L) into alternate layers of the constituent phases: piezoelectric perovskite (P) and
piezomagnetic spinel (S) phases, i.e., L → P + S. Their results showed ME voltage
coefficients as high as dE/dH=50mV/cm•Oe (Boomgaard, 1974; Van Run 1974).
Subsequent work on eutectic compositions of BaTiO
3
-CoFe
2
O
4
(BTO–CFO) prepared by
unidirectional solidification have reported a ME coefficient of 130 mV/cm•Oe (Boomgaard,
1978). Unfortunately, unidirectional solidification has several disadvantages such as (i)
limitation on the choice of compositions and material systems, (ii) difficulty in critical
control over the composition when one of the components is a gas (i.e., oxygen), and (iii)
processing temperature and time. However these limitations could be alleviated by
synthesizing ME composites using a conventional ceramic processing route.
Ferroelectrics - Characterization and Modeling
62
Recently, giant ME effect has been reported in laminate composites of piezoelectric and
magnetostrictive materials (Ryu, 2003a; Ryu, 2003b; Dong, 2003a; Dong 2003b).
The
magnetoelectric laminate composite were fabricated in sandwich structure, embedding
piezoelectric PMN-PT single crystal between magnetostrictive Terfenol-D alloys. This
material exhibited the ME coefficient of 10.30 V/cm.Oe, which is ~80 times higher than that
previously reported in either naturally occurring magnetoelectrics or Artificially-Designed
Composites (ADC). Even though the ME coefficient is considerably higher, these materials
have certain disadvantages as compared with the artificially-designed composites, such as
eutectic composition of BaTiO
3
-CoFe
2
O
4
. Laminated magnetoelectrics are very attractive
from the fabrication point of view however suffer from several other drawbacks such as
high cost for single crystal, difficult to miniaturize, decay of epoxy bonding and complicated
sensing circuits. Again all these laminated composites use lead based product which is a
highly toxic element and it is better to eliminate this toxic element and introduce lead-free
compositions in magnetoelectric composites.
For bulk magnetoelectric composite higher ME coefficient implies higher elastic coupling
between the magnetic and piezoelectric phases (Prellier, 2005). The elastic coupling can be
maximized by having coherent response from the magnetostrictive phase under dc bias, so
that the stress on the piezoelectric lattice across the grains is in phase with each other. For
this purpose, a coherent interface between piezoelectric and magnetostrictive phase is very
important. A coherent interface can transfer the strain very efficiently from magnetostrictive
to the piezoelectric phase. An artificial interface can also be created by fabricating a co-fired
bilayer composite. Previously, we have demonstrated BaTiO
3
– (Ni
0.8
Zn
0.2
)Fe
2
O
4
bilayer
composite having a coherent interface and exhibiting high magnetoelectric sensitivity
(Islam, 2006).
In this chapter, high-resolution scanning electron microscopy (SEM) investigation of the
product microstructure of BTO–CFO polycrystalline solution that underwent eutectic
decomposition has been carried out to compare the interface microstructure with that of co-
fired bilayer composites. The interfacial microstructure of said composite was examined,
revealing an elemental distribution and grain mismatching between BTO rich grains and a
BTO-CFO matrix. Further, we report the magnetoelectric properties of near eutectic
compositions. The focus in this study is on quantifying the interface effect rather than
magnitude of the magnetoelectric coefficient.
2. Experimental
2.1 Powder preparation and sintering
Reagent-grade powders of BaCO
3
, TiO
2
, CoCO
3
and Fe
2
O
3
, were obtained from Alfa Aesar,
Co. MA. USA. Stoichiometric ratios of the powders were mixed according to formulation
BaTiO
3
(BTO) and CoFe
2
O
4
(CFO) and ball milled separately for 24 hours with alcohol and
YSZ grinding media (5mm diameter, Tosoh Co. Tokyo, Japan). After drying at 80
o
C the
powders were calcined. BTO powders were calcined at 900
o
C for 3 hours and CFO powders
were calcined at 1000
o
C for 5 hours in separate alumina crucibles. After calcination the
powders were crushed and sieved using a sieve of US mesh # 270. After that X-ray
diffraction pattern of all different powders (BTO and CFO) were taken to check the
formation of single phase perovskite (for BTO) or spinel (for CFO) using Siemens
Krystalloflex 810 D500 x-ray diffractometer. Next, 30 and 35 mole% CFO powders were
Structure – Property Relationships of
Near-Eutectic BaTiO
3
– CoFe
2
O
4
Magnetoelectric Composites
63
mixed stoichiometrically with BTO powders. All the powders were mixed using alcohol and
grinding media in a polyethylene jar and ball milled for 36 hours. The slurries were dried at
80
o
C, crushed and sieved with a stainless steel sieve of US mesh #170. The powders were
then pressed to pellets of size 12.7x 1.5 mm
2
in a hardened steel die using a hydraulic press
under a pressure of 15 MPa. For the bilayer composite, first BTO powders were pressed
under 5 MPa pressure and the CFO powders were added on top of BTO powders. These
powders were pressed together under 15 MPa pressure. Then the pellets were sealed in a
vacuum bag and pressed isostatically in a laboratory cold isostatic press (CIP) under a
pressure of 207 MPa. Pressureless sintering of composites was performed in air using a
Lindberg BlueM furnace at 1250
o
C for 5 hours. Bilayer composite was sintered at 1200
o
C
under the same condition. After firing the overall bilayer composite thickness was
approximately 1.5 mm with ~1 mm thickness of the CFO and ~0.5 mm thickness of the BTO
layer. The diameters of these fired samples were in the range of 10.4 – 10.6 mm.
2.2 Characterization
Microstructural analysis of the sintered samples was conducted by Zeiss Leo Smart SEM
using the polished and thermal etched samples. In order to perform magnetoelectric and
dielectric measurements, an Ag/Pd electrode was applied on the samples and fired at 850
o
C
for 1 hour. The magnetic properties of the powder and sintered samples were measured by
an alternating gradient force magnetometer (AGFM) at room temperature. The
magnetoelectric coefficient (dE/dH) was measured by an A.C. magnetic field at 1 kHz and 1
Oe amplitude (H). The AC magnetic field was generated by a Helmholtz coil powered by
Agilent 3320 function generator. The output voltage generated from the composite was
measured by using a SRS DSP lock- in amplifier (model SR 830). The magnetoelectric
coefficient (mV / cm.Oe) was calculated by dividing the measured output voltage by the
applied AC magnetic field and the thickness of sample in cm. The sample was kept inside a
Helmholtz coil, placed between two big solenoid coils and powered by KEPCO DC power
supply. For frequency dependent magnetoelectric coefficient measurement, the Helmholtz
coil was powered by the HP 4194 network analyzer (0.5 Oe AC field) and the voltage gain
was measured on the secondary terminal. For this measurement, a DC bias of 200 Oe was
used using a pair of Sm-Co magnet placed on top and bottom of the sample holder. This set-
up produced constant 200 Oe DC bias as measured by the magnetometer. During the
frequency dependent measurement, our system was limited to applied DC bias of 200 Oe.
3. Results and discussion
3.1 Structural characterization
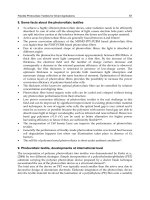
Figure 1 (a) shows the X-ray diffraction patterns of calcined BTO and CFO powders. No
other phase in addition to perovskite and spinel was detected. The approximate lattice
parameter of BTO calculated from the XRD pattern was a = 3.994 Å and c = 4.05 Å where the
tetragonality c/a is 1.014. The lattice parameter of CFO powder was calculated to be 8.337Å.
Figure 1 (b) shows the composite diffraction pattern of BTO – 30 CFO and BTO – 35 CFO.
Only perovskite and spinel peaks were observed in the diffraction pattern. Perovskite peaks
are marked as P and spinel peaks are marked as S and the corresponding (hkl) indices are
also noted in this figure. It can be seen in this figure that as the percentage of CFO increases,
the intensity of perovskite peaks (e.g. P – (101) peak) decreases and the intensity of spinel
peak (S – (311)) increases.
Ferroelectrics - Characterization and Modeling
64
20 30 40 50 60
0
200
400
600
800
211
220
200
111
101
001
2θ
Calcined BaTiO
3
0
100
200
300
400
500
511
422
400
222
311
220
Intensity (arb. units)
Calcined CoFe
2
O
4
20 30 40 50 60
0
50
100
150
200
250
300
P - 001
BT - 30 CF - 1250
o
C
2θ
0
50
100
150
200
250
S - 511
S - 422
S - 400
S - 311
S - 220
P - 112
P - 102
P - 002
P - 111
P - 101
BT - 35 CF - 1250
o
C
Intensity (arb. units)
Fig. 1. (a) XRD patterns of calcined BTO and CFO powder and (b) XRD patterns of BT – 30
CF and BT – 35 CF magnetoelectric composite, sintered at 1250
o
C.
Figure 2 shows the SEM microstructure at low magnification (500X) for (a) BTO–30CFO, and
(b) BTO–35CFO. The images reveal island-like structures comprised of multiple grains in a
eutectic matrix, as marked in the images. EDS demonstrated that these multi-grain islands
were BTO-rich, relative to the matrix that was constituted of a BTO-CFO solution. These
microstructural features resemble those of hypo- and/or hyper-eutectic alloys in metallic
systems. Some needle-shaped features, as indicated by arrows in Fig. 2 (b), were observed
for BTO–35CFO, which were determined to be BTO-rich by EDS. In addition, clear interfaces
were observed between the BTO-rich regions and the CFO-rich matrix.
Structure – Property Relationships of
Near-Eutectic BaTiO
3
– CoFe
2
O
4
Magnetoelectric Composites
65
Fig. 2. SEM micrograph of BTO – CFO composites sintered at 1250
o
C, (Magnification: 500 X).
(a). BTO – 30 CFO and (b) BT – 35CFO.
Figure 3(a) is a higher-resolution image showing the grain structure in the vicinity of an
interfacial region between the BTO-rich islands and the CFO-rich matrix. A clear boundary
between the strained BTO–CFO (i.e., matrix) and BTO-rich (i.e., multi-grain islands) phases
is distinguishable, as indicated by dashed line. The deformation of the matrix can be seen by
the formation of twin-bands, which reduces the excess strain imposed by the inclusions.
Figure 2 also shows magnified (10
5
X) images of the microstructure taken from (b) a BTO-
rich island, and (c) the CFO-rich matrix. It can be seen that the grain sizes of both regions are
BTO - 35CFO – 1250
o
C
(b)
BTO rich islands
BTO rich
needles
BTO - 30CFO – 1250
o
C
(a)
BTO rich islands
Ferroelectrics - Characterization and Modeling
66
quite small: the average grain size in the BTO-rich islands was ~150nm and that of the CFO-
rich matrix region was ~215nm. Due to the formation of BaTiO
3
– CoFe
2
O
4
, grain size
increased as more CoFe
2
O
4
and BaTiO
3
forms the matrix. Again in the matrix due to the
lattice mismatch between CoFe
2
O
4
(~8.337 Å) and BaTiO
3
(a = 3.994 Å and c = 4.05 Å) grain,
it is possible to develop stress concentration inside the piezoelectric grain, and the result is
presence of twin boundaries, cleavage, strain fields, absence of nanosized domain near the
interface and large piezoelectric domain width observed in the matrix. On the other hand
the BaTiO
3
rich phase has a uniform grain size, lower stress concentration and presence of
piezoelectric domains.
Fig. 3. Magnified SEM image of BTO – CFO magnetoelectric composites at the interface
between the BT-rich region and the matrix. (a) interfacial region, (b) grain structure in the BT
rich phase (100 kX) and (c) grain structure in the matrix (100 kX).
(b)
BTO – 30 CFO
BaTiO
3
rich phase
(c)
BTO – 30 CFO
CoFe
2
O
4
rich
phase
Structure – Property Relationships of
Near-Eutectic BaTiO
3
– CoFe
2
O
4
Magnetoelectric Composites
67
Fig. 4. Interface microstructure of 0.7 BaTiO
3
– 0.3 CoFe
2
O
4
. (a) SEM micrograph, (b) Co
distribution and (c) Fe distribution.
(b)
Co Map
(a)
BT – 30 CF
(c)
Fe Map
Ferroelectrics - Characterization and Modeling
68
Recently, Echigoya et al. have studied the interfacial structure of unidirectional solidified
BTO–CFO eutectics, grown by a floating zone method (Echigoya, 2000). Two types of
morphologies were found for different growth conditions, and based on HRTEM images the
following orientation relationships between phases were identified (a) for hcp BaTiO
3
:
(111)CFO//(00.1)BTO and (110)CFO//(11.0)BTO; and (b) for tetra/cubic BaTiO
3
:
(001)CFO//(001)BTO and (100)CFO//(100) BTO. The results of Fig. 2 show that the
polycrystalline ceramics also exhibit high degree of coherency across the interface,
evidencing continuous grain growth. X-ray mapping of Co and Fe were done at the interface
using Zeiss Leo Smart SEM and it is clearly noticed from the Figure 4 that Co and Fe is rich
on the right side of the interface. In the BaTiO
3
rich phase, there is a uniform distribution of
Co and Fe inside the piezoelectric matrix. EDX elemental analysis shows that, in the BaTiO
3
rich phase the atomic percentage of Co and Fe is around 10% and 7% whereas in the matrix,
the atomic percentage of Co and Fe raised to 17.76% and 34.73%. These results are consistent
with that expected if the BTO-rich regions constitute a hypo-eutectic phase, prior to eutectic
decomposition.
Figure 5(a) and (b) shows the bright field TEM images of the sintered BTO – 30 CFO
samples. The sintered samples were found to consist of high defect structures such as twin
boundaries, cleavage, strain fields etc. in the BTO - CFO matrix which develop to
accommodate the mismatch in the BTO and CFO lattices, as CFO lattice parameter is more
than double the lattice parameter of BTO lattice. These types of structure usually show
larger width domain patterns, characteristic of 90
o
domains and the intergranular
heterogeneity in domain width is observed. The observed defects are in line with the SEM
images. A finer scale domain structure, which usually has striation like morphology and
periodically spaced, is almost absent in this structure which means that the structure is in a
stressed condition. These finer domains appear when the stress is relieved from the
structure.
Fig. 5. TEM images of BT – 30 CF composite
Structure – Property Relationships of
Near-Eutectic BaTiO
3
– CoFe
2
O
4
Magnetoelectric Composites
69
Figure 6 shows the interface microstructure of BTO – 33.5 CFO co-fired bilayer composites.
A very coherent interface is formed by sintering these two phases together. On the CFO
side, an indication of the liquid phase sintering at the interface which may be due to the
lower sintering temperature of CFO has been observed. This may be advantageous for
accommodating the stress at the interface created in the CFO regions under ac magnetic
field. Far from interface, the microstructure observed is single phase on either side.
Fig. 6. SEM micrograph of the BTO-CFO bilayer composite.
3.2 Dielectric and ferroelectric characterization
Figure 7 shows the ferroelectric (polarization vs. electric field) and strain (% strain vs.
electrical field) of BTO – 33.5 CFO cofired bilayer composite. The polarization of 35
µC/cm
2
and strain of about 0.14% was recorded at 4.5 kV/mm. Compared to the bilayer
composite, the ferroelectric response for the sintered particulate composite was very weak
due to the lower resistivity, which clearly indicates the problem in obtaining the larger
ME coupling. Interface diffusion and ferrite connectivity reduces the resistivity and hence
the decreases the ferroelectric response. Figure 8 (a) to (f) shows the temperature
dependence of the dielectric constant and dielectric loss for BT – 30 CFO, BT – 35 CFO and
BTO – 33.5 CFO bilayer composites at different frequencies. For bulk (BTO – 30 CFO and
BTO – 35 CFO) composites, the maximum in the dielectric constant was found at 145
o
C.
At 100 Hz frequency, however no peaks were observed in the dielectric loss factor at that
temperature as shown in Figure 8 (b) and (d). The sharp increase in the dielectric loss
factor was observed for both the compositions at the high temperatures which are related
to the space charge effect. A completely different behavior was found when the dielectric
BTO
CFO
Ferroelectrics - Characterization and Modeling
70
constant and dielectric loss of BTO -33.5 CFO bilayer composite have been plotted in
terms of temperature (Figure 8 (e) and (f)). Very sharp peak in dielectric constant was
found at around 125
o
C for all of the frequencies (except 100 kHz). This signifies the pure
BaTiO
3
behavior. Again peaks were observed for dielectric loss at 125
o
C for higher
frequencies (10 and 100 KHz). In general BTO - 33.5 CFO bilayer composites found to be a
lossy material where the dielectric loss was found to be around 0.4 at 1 kHz and room
temperature.
-4 -2 0 2 4
-20
-10
0
10
20
30
40
Polarization
Strain
Field (kV / mm)
Polarization (μC/cm
2
)
0.02
0.04
0.06
0.08
0.10
0.12
0.14
Strain (%)
Fig. 7. Ferroelectric properties, polarization and strain as a function of electric field.
3.3 Ferromagnetic and magnetoelectric characterization
Figure 9 shows the magnetic properties for sintered BT – 30 CFO, BT – 35CFO and BTO –
33.5 CFO cofired bilayer composite. The co-fired bilayer composite shows higher saturation
(0.881 emu) magnetization and slightly higher coercive field (973.33 Oe) than BTO – CFO
bulk composite. BTO – 35 CFO shows saturation magnetization of 0.881 emu and coercivity
of 973.33 Oe as indicated in Table 1. This is due to the contribution of pure CFO phase.
Bilayer composite also shows better remnant magnetization than the bulk. Figure 10 (a)
shows the variation of magnetoelectric coefficient as a function of dc bias. The bulk
composites show the maxima at 1500 Oe with a ME coefficient of 2.2 mV/cm. Oe for BTO –
35 CFO. But for the bilayer composite it reaches a maximum value of 3.9 mV/cm.Oe and
then saturates. The measurement has been taken in condition where the applied magnetic
field is perpendicular to the sample surface. Figure 10 (b) shows the frequency dependent
magnetoelectric coefficient. At around 430 kHz all the samples show giant magnetoelectric
coefficient. BTO – 33.5 CFO bilayer composite exhibits ME coefficient around 3.6 V/cm.Oe
and the BTO – 35 CFO bulk composite reaches around 0.95 V/cm. Oe. This is a very high
magnetoelectric coefficient for BTO – CFO composite at resonance frequency, which is
higher than the recent reported value of 2540 mV/cm.Oe at 160 KHz and 270 Oe DC bias for
BTO – 20 CFO composite (Ren, 2005).
Structure – Property Relationships of
Near-Eutectic BaTiO
3
– CoFe
2
O
4
Magnetoelectric Composites
71
40 60 80 100 120 140 160 180 200
0.5
1.0
1.5
2.0
2.5
3.0
3.5
4.0
4.5
5.0
(a)
BT - 30 CF
ε
33
T
/ε
o
(x 10
3
)
Temperature (
o
C)
100 Hz
1 KHz
10 KHz
100KHz
40 60 80 100 120 140 160 180 200
0
2
4
6
8
10
(b)
BT-30CF
tan δ
Temperature (
o
C)
100 Hz
1 KHz
10 KHz
100 KHz
Ferroelectrics - Characterization and Modeling
72
40 60 80 100 120 140 160 180 200
0.5
1.0
1.5
2.0
2.5
3.0
3.5
4.0
4.5
5.0
5.5
6.0
6.5
ε
r
/ε
o
(x 10
3
)
(c)
BT - 35CF
Temperature (
o
C)
100 Hz
1 KHz
10 KHz
100 KHz
40 60 80 100 120 140 160 180 200
0
2
4
6
8
10
(d)
BT - 35 CF
tan δ
Temperature (
o
C)
100 Hz
1 KHz
10 KHz
100 KHz
Structure – Property Relationships of
Near-Eutectic BaTiO
3
– CoFe
2
O
4
Magnetoelectric Composites
73
40 60 80 100 120 140 160 180 200
0
1
2
3
4
5
6
7
8
9
10
11
12
BT - 33.5 CF Bilayer
ε
r
/ε
o
(x10
3
)
Temperature (
o
C)
0.1 KHz
1 KHz
10 KHz
100 KHz
40 60 80 100 120 140 160 180 200
0.0
0.2
0.4
0.6
0.8
1.0
1.2
1.4
1.6
1.8
2.0
2.2
2.4
BT - 33.5 CF Bilayer
tan δ
Temperature (
o
C)
0.1 KHz
1 KHz
10 KHz
100 KHz
Fig. 8. Dielectric properties of BTO – CFO composites, (a) temperature dependent dielectric
constant for BTO – 30 CFO, (b) temperature dependent dielectric loss for BTO – 30 CFO, (c)
temperature dependent dielectric constant for BTO – 35 CFO, (d) temperature dependent
dielectric loss for BTO – 35 CFO, (e) temperature dependent dielectric constant for BTO –
33.5 CFO and (f) temperature dependent loss constant for BTO – 33.5 CFO.
(e)
(f)
Ferroelectrics - Characterization and Modeling
74
Analysis of low frequency ME effect in the layered CFO-BTO structures (Fig.10 (a)) can be
conducted based on the equation for the longitudinal ME coefficient (Bichurin, 2003):
03131
3
,33
2
3
31 33 11 12 11 12
11 12 11 12
22
03312111112 31
(1 )
2
{2 (1 ) [( )( 1) ( )]}
[( )( 1) ( )]
{[ ( 1) ][ ( ) ( )( 1)] 2 }
p
m
E
pppp
mm
pp
mm
pp
mmm m
kv v d q
E
H
dv ssvvss
ssv kvs s
v v kv s s s s v q kv
μ
α
ε
μμ
×
−
==
−+ + −− +
+−− +
×
−− + − + − +
The equation presented above allows for the determination of the longitudinal ME
coefficient as function of volume fractions, physical parameters of phases and elastic-elastic
interfacial coupling parameter k. From comparison of theory and data the importance of an
interfacial coupling parameter between phases can be inferred. This interphase interfacial
connection parameter was shown to be weak for CFO–BTO. In our case k is about 0.1.
Estimation of ME effect in the EMR range (Fig.10(b)) has been performed using the above
equation (Bichurin, 2003). Because of inconveniences in the analytical expressions for
effective parameters of bulk CFO-BTO composites, computer calculations of the dependence
of effective parameters on the relative piezoelectric phase volume in ME composite have
been performed. Calculations of longitudinal ME coefficient have also been performed for
electric and magnetic fields applied for bulk composites using the material parameters in
(Harshe, 1993; Bichurin, 2010). The obtained values of the ME voltage coefficient coincide
with previously published data.
As follows from the comparison of obtained results, the ME
voltage coefficient was approximately 20% greater than that calculated from the
experimental data using the model. This is explained by the fact that the internal (local)
magnetic field in the ferrite component is considerably different than that of the externally
applied magnetic field.
BTO – 30 CFO BTO – 35 CFO BTO -33.5 CFO
Coercivity (Oe)
646.77 677.49 973.3
Saturation magnetization
(emu/ 100 gm)
0.557 0.702 0.881
Remnant magnetization
(emu/ 100 gm)
0.246 0.279 0.345
Table 1. Magnetic Properties of BTO – CFO Composites
This question of ‘why the elastic interaction in system with uniform distribution of two
phases and coherent interfaces between the phases is weak’ needs addressing. Our results
indicate that the reasons for weak response may not be related to elastic-coupling between
phases, but rather to the magnetic flux distribution within the matrix. Compared to the
results of Philips Research Lab, the 1 kHz values reported here are quite low, which can be
attributed to the process difference, polycrystalline matrix, nanograin structure and twin
formation. In our research we used conventional sintering method compared to the
unidirectional solidification of Philips Laboratory. In unidirectional solidification process, a
significant amount of time is allowed to melt the components under desired atmosphere
and then solidify with heat transfer confined along one direction. This results in the
consolidation of the ferrite into dendrite structure, which hinders the distribution of the
ferrite phases. Also the longer time helps the grain growth and unidirectional solidification
Structure – Property Relationships of
Near-Eutectic BaTiO
3
– CoFe
2
O
4
Magnetoelectric Composites
75
results in preferential texture. All these contributes to the larger ME coefficient. In our
process smaller grain size (150 – 215 nm) results in lower ME coefficient and also the well
dispersed ferrite particle reduces the resistivity of the overall bulk composite system. Grain
size has significant effect on the magnitude of ME coefficient. Our previous results show
that as the piezoelectric grain size drops below 200 nm, the ME coefficient drops rapidly
(Islam, 2008). Finally in conventional sintering the grains are in random orientations and
defects (such as twin boundaries, cleavage) in the structures are notable, all of which hinder
the piezoelectric properties. The ME coefficient was notably higher for the bilayer, than for
the eutectic composites. This comparison shows that coherent interfaces between composites
of similar composition is not by any means the factor controlling the magnitude of the ME
coefficient. Rather, continuity of flux lines is equally important for the expression of the ME
product tensor property between phases.
-5 -4 -3 -2 -1 0 1 2 3 4 5
-1.2
-1.0
-0.8
-0.6
-0.4
-0.2
0.0
0.2
0.4
0.6
0.8
1.0
1.2
Sample Weight: 100 gm
Magnetic Moment (emu)
Field (kOe)
BT - 30 CF
BT - 35 CF
BT - 33.5 CF Bilayer
Fig. 9. Ferromagnetic Hysteresis loop of sintered BTO – 30 CFO, BTO – 35 CFO and BTO –
33.5 CFO bilayer magnetoelectric composites.
4. Conclusion
A microstructural investigation of BaTiO
3
–CoFe
2
O
4
polycrystalline solutions for
compositions close to the eutectic point has been investigated along with dielectric,
ferromagnetic and magnetoelectric behavior. Multi-grain BTO-rich islands were found in a
CFO-rich matrix. Analysis of the interfacial regions revealed that the two phases have a high
degree of coherency, enabling continuous grain growth. Also the bilayer type composite
structure shows better performance as it shows very high magnetoelectric coefficient (3.6
V/cm. Oe) at high frequency (434 KHz).
Ferroelectrics - Characterization and Modeling
76
0 500 1000 1500 2000 2500
0.0
0.5
1.0
1.5
2.0
2.5
3.0
3.5
4.0
4.5
5.0
5.5
6.0
Room Temp.
Freq: 1 KHz
dE / dH (mV / cm. Oe)
DC Bias Field (Oe)
BT - 30 CF
BT - 35 CF
BT - 33.5 Bilayer
1000 10000 100000 1000000
0
500
1000
1500
2000
2500
3000
3500
4000
Room temperature
DC Bias : 200 Oe
dE/dH (mV / cm. Oe)
Frequency (KHz)
BT - 30 CF
BT - 35 CF
BT - 33.5 CF Bilayer
Fig. 10. Magnetoelectric Coefficient of different BTO – CFO composites as a function of (a)
DC bias and (b) frequency.
5. Acknowledgement
The authors gratefully acknowledge the support from National Science Foundation INAMM
program.
6. References
Astrov, DN. Al’shin, BI. Zhorin, RV. and Drobyshev, LA. (1968). Sov. Phys. – JETP 28. pp.
1123.
Structure – Property Relationships of
Near-Eutectic BaTiO
3
– CoFe
2
O
4
Magnetoelectric Composites
77
Astrov DN. (1960). Sov. Phys.—JETP, 11, pp. 708.
Bichurin, MI, Petrov, VM, Petrov, RV. et. al. (2002). Magnetoelectric microwave devices.
Ferroelectrics, 280, 211.
Bichurin MI, Petrov VM, Srinivasan G. (2003) Theory of low-frequency magnetoelectric
coupling in magnetostrictive-piezoelectric bilayers. Phys. Rev., B68, pp. 054402.
Bichurin MI, Filippov DA, Petrov VM et al. (2003) Resonance magnetoelectric effects in
layered magnetostrictive-piezoelectric composites Phys.Rev. B68, pp. 132408.
Bichurin MI, Petrov VM, Averkin SV, Filippov AV. (2010) Electromechanical resonance in
magnetoelectric layered structures. Physics of the Solid State, 52, pp. 2116-2122.
Boomgaard JVD, Van Run AMJG and Suchtelen JV. (1976). Magnetoelectricity in
Piezoelectric – Magnetostrictive Composite. Ferroelectrics. 10. pp. 295-298.
Boomgaard JVD and Born RAJ. (1978). A Sintered Magnetoelectric Composite Material
BaTiO
3
- Ni (Co, Mn) Fe
2
O
4
. J.Mater.Sci. 13. pp. 1538-1548.
Boomgaard JVD, Terrell DR, Born RAJ et. al. (1974) An insitu grown Eutectic
Magnetoelectric Composite Material: Part I: Composition and Unidirectional
Solidification. J.Mater.Sci. 9. pp. 1705-1709.
Dong S, Li J, and Viehland, D. (2003). Ultrahigh Magnetic Field Sensitivity in Laminates of
Terfenol-D and Pb(Mg
1/3
Nb
2/3
)O
3
-PbTiO
3
. Appl. Phys. Lett.; 83 [11]. pp. 2265-2267.
Dong S, Li J, and Viehland D (2003). Giant Magnetoelectric Effect in Laminate Composite.
IEEE Trans. Ultrason. Ferroelec. Freq. Ctrl., 50 [10], pp. 1236-1239.
Dzyaloshinskii, IE. (1959). On the magneto-electrical effects in antiferromagnets. Sov. Phys.
JETP. 10. pp. 628–629.
Echigoya J, Hayashi S and Obi Y. (2000) Directional solidification and interface structure of
BaTiO
3
-CoFe
2
O
4
eutectic, J. Mater. Sci., 35, pp 5587.
Feibig, M. (2005). Revival of Magnetoelectric Effect. J.Phys. D: Appl. Phys.; 38, pp. R123-R152.
Harshe G, Dougherty JP, Newnham RE. (1993). Theoretical modeling of multilayer
magnetoelectric composites, Int. J. Appl. Electromagn. Mater., 4, pp. 161.
Islam RA and Priya S. (2006). Magnetoelectric properties of the lead free cofired BaTiO
3
-
Ni
0.8
Zn
0.2
Fe
2
O
4
bilayer composite. Appl. Phys. Lett, 89, 152911.
Islam RA and Priya S. (2008), Effect of piezoelectric grain size on magnetoelectric coefficient
of Pb(Zr
0.52
Ti
0.48
)O
3
-Ni
0.8
Zn
0.2
Fe
2
O
4
particulate composites J. of Mater. Sci., 43 (10),
pp. 3560.
O’dell TH. (1965). Magnetoelectrics – A New Class of Materials. Electronics and Power. 11. pp.
266-268.
Prellier W, Singh MP and Murugavel P. (2005). The single-phase multiferroic oxides: from
bulk to thin film J. Phys: Condensed Matter., 17, R803.
Ren SQ, Weng LQ, Song SH et. al. (2005) BaTiO
3
/CoFe
2
O
4
particulate composites with large
high frequency magnetoelectric response J. Mater. Sci. 40, pp. 4375.
Ryu J, Priya S and Uchino K. (2002). Magnetoelectric Effect in Composites of
Magnetostrictive and Piezoelectric Materials. J. Electroceram. 8, pp. 107- 119.
Ryu J, Priya S, Uchino K, Viehland D et. al. (2002). High Magnetoelectric Properties in
0.68Pb(Mg
1/3
Nb
2/3
)O
3
-0.32PbTiO
3
Single Crystal and Terfenol-D Laminate
Composite.
J. Korean Ceram. Soc. 39. pp. 813-817.
Ryu, J,
Priya, S,
Carazo, AV et. al. (2001). Effect of the Magnetostrictive Layer on
Magnetoelectric Properties in Lead Zirconate Titanate/Terfenol-D Laminate
Composites, J. of Amer. Ceram. Soc. 84 (12). pp. 2905 – 2908.
Ferroelectrics - Characterization and Modeling
78
Ryu J, Carazo AV, Uchino K, et. al. Piezoelectric and Magnetoelectric Properties of Lead
Zirconate Titanate/Ni-Ferrite Particulate Composites. J. of Mater. Sci. 7 (1). pp. 17 –
24.
Smolensky, G. and Ioffe, VA. (1958). Colloque International du Magnetisme; Communication
No. 71.
Suchtelen, JV. (1972). Product Properties: A New Application of Composite Materials. Philips
Research Report, 27, pp. 28 – 37.
Van Run AMJG, Terrell DR, and Scholing JH. (1974) An insitu grown Eutectic
Magnetoelectric Composite Material.
Magnetoelectric Composite Material. Part II: Physical Properties. J.Mater.Sci. 9. pp 1710 -
1714.
1. Introduction
Ferroelectric materials offer a wide range of dedicated physical properties such as high
dielectric constant, spontaneous polarisation, pyroelectric and piezoelectric effects which
can be applied in thin-film non-volatile memories o r ‘bulk’ actuators, multi-layer capacitors,
thermal sensors and transducers (1–3). In that respect, desired materials properties for specific
applications may be tailored by controlling the defect structure by means of aliovalent doping,
rendering so-termed ’hard’or’soft’ piezoelectric materials (4–6).
Another important impact on ferroelectric properties results from the confined size in
nano-scale architectures (7). At the nanometer scale physical and chemical properties are
expected to differ markedly from those of the ’bulk’ material. Owing to a size-driven phase
transition, a critical particle size exists below which ferroelectricity does no longer occur (8).
In this chapter, we will first outline the nature of the size-driven para-to-ferroelectric
phase transition, as well as the concepts of defect chemistry. On that basis, the interplay
between confined size at the nano-regime and the development of defect structure will be
characterized. The here studied ferroelectric lead titanate nano-powders may be considered
as a model system for more complex ferroelectric nano architectures (1; 2). Furthermore,
the results discussed here m ay be transferred to large extent to o ther important perovskite
oxides with divalent A- and tetravalent B-site, such as BaT iO
3
or Pb[Zr,Ti]O
3
(PZT). The
defect chemistry of ferroelectric perovskite oxides with monovalent A- and pentavalent B-site,
such as the [K,Na]NbO
3
(KNN) solid solution system, however has shown some important
deviations from the defect structure characterized for PZT compounds (9; 10).
2. Synthesis of perovskite oxide nano-powders
Many different strategies have been employed in recent years to synthesize ferroelectric
nano-powders. These include hydrothermal (11), alkoxide (12), co-precipitation (13) and
sol-gel (14) techniques. The main drawback associated with the above-mentioned routes
is the a gglomeration of particles, which prevents the synthesis of ultra-fine nano-powders.
This problem may be overcome by two alternative methods – the combined polymerization and
pyrolysis (CPP) technique (15; 16) and the high-energy ball milling (HEBM) cold mechanical
alloying (17; 18). In particular, both methods provide the opportunity to homogeneously
incorporate aliovalent transition-metal or rare-earth dopants with concentrations ranging
between 10
−2
− 10
0
mol%.
Impact of Defect Structure on ’Bulk’ and
Nano-Scale Ferroelectrics
Emre Erdem and Rüdiger-A. Eichel
Institut für Physikalische Chemie I, Universität Freiburg, Albertstr. 21, D-79104 Freiburg
Germany
5
2 Ferroelectrics
2.1 Combined polymerization and pyrol ysis
The CPP-route starts from a monomeric metallo-organic precursor through combined
solid-state polymerisation and pyrolysis (15; 16). Adjustment of various mean particle sizes is
obtained by choosing appropriate calcination temperatures. A remarkable optimization of the
CPP route is obtained by applying special tempering conditions, e.g. oxidative atmosphere
or quenching into a non-equilibrium state. With this technique, ultrafine PbTiO
3
powders
down to 5 nm mean grain size result (15). CPP based nano-particles are characterized by
a comparatively high reaction homogeneity, particularly in the polymerization step. The
particle sizes may further by decreased by subsequently applying to high energy ball milling.
Recent results of the CPP technique include the synthesis of nano-scale BaTiO
3
(19) and
PbTiO
3
powders (15; 16) with mean particle sizes ranging from 150 nm down to 5 nm.
The corresponding results from differential thermogravimetric analysis (DTA) (weight loss,
blue line) and differential scanning calorimetry (DSC) (thermal change) of the CPP precursor
are g iven in figure 1(a). The TGA results show exothermic changes in specific temperatures
(assigned in figure 1(a)) of the precursor due to the CPP formation reactions, as well as
evaporation of various volatiles and phase changes of the crystal. The CPP of PbTiO
3
is
initialized around 510 K and peaking at 530 K coupled by the polymerization of
−C = C−
double bonds in the methyacrylate part of the ligand from the p r ecursor (15). The pyrolysis
of the hydrocarbons occurs at 554 K and is followed by formation of PbTiO
3
( T
max
=
554 K) while release of carbon and other volatiles processed. The deconvolation of the two
main overlapping peaks between 740
− 770 K corresponds to the complete combustion and
evaporation of amorphous organic residues (753 K). The ferro-to-paraelectric phase transition
occurs at the Curie temperature for PbTi O
3
(763 K). Further heating of the sample gives rise
to mass losses due to PbO evaporization.
300 400 500 600 700 800 900
-100
0
100
200
300
400
500
600
T (K)
DTA (
mV)
596 K
554 K
530 K
753 K
50
60
70
80
90
100
Mass (%)
763 K
300 400 500 600 700 800 900
-100
0
100
200
300
400
500
600
T (K)
DTA (
mV)
596 K
554 K
530 K
753 K
50
60
70
80
90
100
Mass (%)
763 K
0 5 10 15 20 25 30 35 40 45 50
5
10
15
20
25
30
400 500 600 700 800 900
0
50
100
150
200
250
300
350
400
Mean particle size (nm)
Calcination temperature (°C )
Mean particle size (nm)
Milling time (h )
(a)
(b)
Fig. 1. (a) - differential thermogravimetric analysis (weight loss) and differential scanning
calorimetry (thermal change) of the precursor. (b) - mean particle size as function of
calcination temperature. The inset shows the variation in mean particle size as function of
different ball-milling times.
As function of calcination temperature, the m ean p article size o f the nano-powders can be
controlled, as shown in figure 1(b). The corresponding mechanism is the following: (i)alow
calcination temperatures gives the smallest particle size and increasing the temperature gives
much larger patrticle size, (ii) applying additionally high-energy ball milling to the smallest
particles obtained after calcination, even smaller particle sizes result (see inset i n figure 1(b)).
Moreover, this method allows to introduce dopants by resolving the corresponding metal
80
Ferroelectrics - Characterization and Modeling
Impact of Defect Structure on ’Bulk’ and Nano-Scale Ferroelectrics 3
ions into the solution. In addition it is observed that after calcination the solid-state solution
exhibits a rate of homogeneous.
A special advantageous feature of the CPP-preparation route is its ability to introduce small
amounts of dopant ions, such as Cr
3+
,Mn
2+
,Fe
3+
,Cu
2+
or Gd
3+
for instance, by just adding
the corresponding metal acetates to the monomeric precursor.
Although the CPP-route offers a flexible preparation technique to obtain different mean
particle sizes as function of appropriate calcination temperature and atmosphere, the
particle-size distribution typically is rather broad. In addition to that, nano-particles below
20 nm proved being largely amorphous. These problems can be circumvented by performing
ball milling s ubsequent to the CPP-route. The most important advantages of CPP-route are
its excellent control over particle size, shape and morphology (phase purity) by adjusting the
calcination temperature.
2.2 High-energy ball milling
An alternative strategy to synthesize nano-grained ferroelectric compounds is the use of cold
mechanical alloying by means of high-energy ball milling. Varying mean grain sized can be
obtained by different milling times. The here presented HEBM nano-powders were obtained
for milling times in an interval between milling times 1 and 50 h at a speed of 300 rpm and a
ball-to-powder weight ratio of 10:1.
The advantage over the above mentioned CPP-route, which requires a calcination step at
an elevated temperature to convert the precursor into the ferroelectric phase, is that this
technique virtually is performed at ambient temperature. Furthermore, there is no need of
high-purity inorganic or organometallic chemicals for the starting materials, thus offering
an inexpensive processing route and additionally overcoming problems associated with high
sensitivity to moisture which typically requires special precaution and handling.
An advantage in common concerning the use of ferroelectric nano-powders as compared
to the standard high-temperature mixed-oxide solid-state reaction techniques is that dense
ceramics may be obtained at considerably lower sintering temperatures owing to the inherent
high rate of homogeneity of the synthesized nano-powders. This argument particularly is
relevant for the synthesis of lead-containing ferroelectric compounds, such that the loss of
PbO at high temperatures can be markedly reduced.
3. Size-driven para-to-ferroelectric phase transition
The most prominent impact of lead titanate nano-powders is that a size-driven phase transition
from the ferroelectric to the paraelectric state can be observed below a critical mean particle
size at ambient temperature. In the following section, we briefly outline the theoretical
foundations describing the size-driven phase transition by means of the Landau-Ginzburg
theory, as well as summarize experimental results monitoring the phase transition on various
length scales.
3.1 Landau-Ginzburg theoretical description of the size-driven phase transition
The phenomenological Landau-Ginzburg theory (LGT) furnishes a s ystematic basis to discuss
the phase transition properties of bulk ferroelectrics (20–22). In recent years several attempts
were made to extend the LGT to nanolayers (23–25) and nanoparticles (26–31). Starting from
the total free energy of a infinite-size and homogeneous ferroelectric, the latter two gradient
and surface terms were added for a finite-size ferroelectric particle
F
=
V
dV
1
2
A
(T − T
C
)P
2
+
1
4
B
P
4
+
1
6
C
P
6
+
1
2
D
(∇P)
2
+
D
2δ
S
dS P
2
(1)
81
Impact of Defect Structure on ’Bulk’ and Nano-Scale Ferroelectrics
4 Ferroelectrics
Obviously, the gradient and surface terms are only of relevance in an outer shell. They
comprise the surface field contribution in the formation of the polarisation gradient. The effect
of the surface on the polarisation is taken into account through the concept of the extrapolation
length d (24; 26; 27). In solving the pertinent Euler-Lagrange equation for minimising the
free energy, the polarisation is obtained considering the boundary condition according to the
extrapolation length conception.
The size dependence of the polarization and the C urie temperature of f erroelectric particles
with a first-order transition were studied in the previous study (8) where different polarization
quantities refer to (i) polarisation at the particle centre (ii) average polarization of the particle
(iii) polarization at the particles outer boundary, and (iv) polarisation difference between
particle centre and border.
Because of the electrostrictive coupling b etween lattice strain and polarization in
perovskite-type ABO
3
systems, the deformation of the tetragonal unit cell depends on the
polarization, and particularly the tetragonality
(
c
a
− 1) is proportional to the square of P
s
(32).
As a result, the variation of P
s
involves a change of the c/a-ratio near the nano-particle surface.
For PbTiO
3
nano-particles, the LGT predicts a critical size of d
LGT
crit
= 4.2 nm (26), whereas
the hitherto experimentally estimated critical size amounts to d
exp
crit
= 12.6 nm (33). T his
discrepancy for controversial values of d
crit
can be attributed to the polarization gradient,
a nano-crystalline surface layer and the depolarization effect. The effect of a depolarization
field (E
d
) and a space-charge layer on the Curie temperature T
C
shift was comprised within
a finite-size multi-domain model of a cubic ferroelectric particle (34). On the other hand, a
phenomenological theory of the size-dependent dielectric susceptibility (28) was based on
spherical ferroelectric particles, thereby unfortunately disregarding the surface energy which
plays a decisive role in the physics of nano-materials. Finally a model was proposed (30)
which gives due consideration to the depolarisation field E
d
and also includes the surface and
domain-wall energies.
However, a homogeneous comprehensive theory was not yet elaborated so far, and
existing models yield rather scattering d
crit
values. Nevertheless, very recent Landau
phenomenological theory calculations for confined ferroelectric nanoparticles are very good
agreement with experimental results (35).
3.2 X-ray diffraction
The size-driven phase transition can be directly monitored by considering the corresponding
XRD patterns of the nano-powders as function of mean grain size. In figure 2 the XRD patterns
of nano-powders obtained by CPP and HEBM are compared to each other.
All observed reflexes can be explained by the perovskite structure. For the ’bulk’ PbTiO
3
component, the corresponding reflexes are indexed. In figure 2(a) the XRD patterns for
the nano-powders obtained f rom CPP are shown. All nano-powders exhibit Bragg reflexes
characteristic f or the PbTiO
3
crystal structure. With decreasing mean particle size, the (001)
and (100) reflexes that belong to the crystalline lattice constants, a and c, approach each
other. This indicates the corresponding size-driven ferro-to-paraelectric phase transition from
tetragonal to cubic crystal symmetry. Furthermore, for the nano-scale particles, the reflexes
are considerably broadened, which hinders further structural refinement.
Figure 2(b) compares the XRD patterns for nano-powders obtained by HEBM for varying
milling times. The determined c/a-ratio of the PbTiO
3
powders decreases from 85 to 20 nm,
when varying the milling time from 30 to 50 h.
82
Ferroelectrics - Characterization and Modeling
Impact of Defect Structure on ’Bulk’ and Nano-Scale Ferroelectrics 5
20 30 40 50 60
(a)
(211 )
(112)
(210)
(201)
(102)
(200)
(002)
(111 )
(110 )
(101)
(100)
(001 )
12 nm
16 nm
20 nm
30 nm
bulk
(500 nm)
XR D Intensity (a.u.)
2 Q (degrees)
20 30 40 50 60
(b)
(110)
(201)
(112 )
(211)
(210 )
(200)
(002 )
(111 )
(101)
(100)
(001)
50h
40h
30h
2q (de g re e s)
Fig. 2. XRD patterns lead titanate nano-powders as function of mean grain size. (a) - PbTiO
3
nano-powders as synthesized by the CPP-route for varying calcination temperatures. (b) -
PbTiO
3
nano-powders as synthesized by HEBM for varying milling times.
3.3 Raman spectroscopy
A microscopic description of the ferroelectric behavior requires the consideration of l attice
dynamics by means of the soft-mode theory. Accordingly, in the ferroelectric phase the PbTiO
3
cations are displaced from the centre of the anion lattice, resulting in an inner electric field with
a permanent electric moment and a spontaneous polarization. Contrary, in the p araelectric
phase PbTiO
3
has cubic symmetry and can be polarized along any of the t hree e quivalent
4
th
-order axes. U pon the transition to the tetragonal symmetry, one direction is chosen as the
crystallographic c-axis and is associated with a characteristic lattice vibrational mode, either
acoustic or optical. In the paraelectric phase all ions move collectively with the same phase,
whereas in the ferroelectric phase anions and cations move independently of each other with
opposite phases. Both modes can be of longitudinal or transversal type and their frequency
depends on temperature. When a ferroelectric phase transition takes place, the transversal
optical mode exhibits an instability and its frequency decreases towards zero, i.e. it ’softens’.
At T
C
the mode is ’frozen’ and the mode frequency reaches zero. This enables a rise of a
non-zero order parameter and lowers the crystal symmetry. Such a vibrational mode is called
’soft mode’. In case of nano-particles it is aimed that softening occurs not by temperature but
by reduction of lattice parameters, hence particle size.
Correspondingly, Raman spectroscopy can be employed to study the occurrence of soft mode
as function of mean grain-size. The corresponding Raman-spectra are depicted in figure
3. In figure 3(a) the Raman spectra as function of mean particle size are shown, where the
corresponding phonon modes are assigned according to ’bulk’ PbTiO
3
(36).
Assuming a strong correlation between the crystalline unit-cell dimensions (a, c)andthe
longitudinal optical (LO) and transversal optical (TO) phonon modes, with decreasing mean
particle size, the LO modes shift to higher wave numbers whereas the TO modes are shifted
to lower wave numbers. More importantly, the soft-mode becomes weaker for small particle
sizes and finally disappears below a critical particle diameter, d
crit
, indicating the transition
from a ferroelectric to a paraelectric nano-powder. This observation may be explained by
considering that for nano-sized compounds the quotient between number of atoms at the
83
Impact of Defect Structure on ’Bulk’ and Nano-Scale Ferroelectrics