Ferroelectrics Characterization and Modeling Part 9 pot
Bạn đang xem bản rút gọn của tài liệu. Xem và tải ngay bản đầy đủ của tài liệu tại đây (983.86 KB, 35 trang )
Ferroelectrics - Characterization and Modeling
270
valance state and distributed randomly over the crystallographic equivalent lattice sites. The
resistivity of the composite is the sum of the resistivities of their constituents
14
and the
decrease in resistivity with increase in temperature is attributed to the increase in drift
mobility of charge carriers. During the process of preparation, the formation of Fe
2+
and Fe
3+
ions depends on the sintering condition. But large drop in resistivity is observed on the
addition of a ferrite phase to the composites, it is due to the partial reduction of Fe
2+
and
Fe
3+
ions at elevated firing temperatures. While preparing the mixtures of two phases to get
high ME response in the composites the control of the resistivity of the ferrite phase is
necessary compared to ferroelectric phase. Similar results have been identified in the
temperature dependent resistivity plot for the (x) Ni
0.2
Co
0.8
Fe
2
O
4
+ (1-x) Pb
Zr
0.8
Ti
0.2
O
3
composites with x = 0.0, 0.15, 0.30, 0.45 and 1.0
15
.
The variation of DC electrical resistivity with temperature for (x) Ni
0.5
Zn
0.5
Fe
2
O
4
+ (1-x)
Ba
0.8
Pb
0.2
Zr
0.8
Ti
0.2
O
3
composites with x = 0.0, 0.15, 0.30, 0.45 and 1.0 is also presented earlier
16
. The resistivity of the composites decreases with increase in ferrite content and the
increase in resistivity with temperature is due to the increase in drift mobility of the charge
carriers. However, the conduction in ferrite may be due to the hopping of electron from Fe
2+
and Fe
3+
ions. The number of such ion pairs depends upon the sintering conditions and
which accounts for the reduction of Fe
3+
to Fe
2+
at elevated temperatures. That is the
resistivity of ferrite is controlled by the Fe
2+
concentration on the B-site. In Ni-ferrite, Ni ions
enter the lattice in combination with Fe
3+
ions resulting in a lower concentration of Fe
2+
ions
with higher resistivity and which is one of the prime requirements for getting higher values
of ME output. According to theoretical predictions the plots of ferroelectric phase and
composites show two regions of conductivity and the change in slope is due to the transition
of the sample from the ferroelectric state to para electric state. However, the regions
observed above and below the Curie temperature may be due to the impurities and small
polaron hopping mechanism.
The mobility is temperature dependent quantity and can be characterized by the activation
energy. But at the grain boundaries, the highly disturbed crystal lattice may cause a drastic
decrease in the activation energy. The activation energy in the present case is obtained by
fitting the DC resistivity data with the Arrhenius relation ρ = ρ
o
exp (ΔE/KT), where ΔE is
the activation energy and K is Boltzmann constant. It is well known that the electron and
hole hopping between Fe
2+
/Fe
3+
and Zn
2+
/Zn
3+
, Ni
2+
/Ni
3+
, Ba
2+
/Ba
3+
, Ti
3+
/Ti
4+
ions is
responsible for electrical conduction in the composites. The estimated activation energies for
the composites in the higher and lower temperature regions suggest temperature dependent
charge mobility and activation energy of paraelectric region greater than 0.2 eV (above Tc),
reveals polaron hoping in composites. Similar behavior is observed for (x) Ni
0.5
Zn
0.5
Fe
2
O
4
+
(1-x) PbZr
0.8
Ti
0.2
O
3
composites (with x = 0.0, 0.15, 0.30, 0.45 and 1.0). In case of composites,
the temperature dependent variation of resistivity is very important for the measurements
of ME conversion factor, because the conduction in composites being thermally activated
mechanism, alters the polarization of the ferroelectric phase as temperature increases. Thus
the ME measurements are carried out only at the room temperature
17
.
6. Dielectric properties and AC conductivity
6.1 AC conductivity measurements
The temperature dependent AC conductivity (σ
AC
) are related to the dielectric relaxation
caused by the localized electric charge carriers. And the frequency dependent AC
conductivity is estimated from dielectric constant and loss tangent (tanδ) using the relation
The Ferroelectric Dependent Magnetoelectricity in Composites
271
σ
AC
= ε′ ε
o
2πf tan δ (2)
Where, ε′ is real dielectric constant, ε
o
is the permittivity of free space, tanδ is the loss
tangent at real ε′ (at dielectric constant) and f is the frequency of applied field. However, the
conduction mechanism in composites are obtained from the plots of frequency response of
the dielectric behavior and AC conductivity.
6.2 Variation of dielectric constant (ε΄) and loss tangent (tanδ)
The variation of dielectric constant with frequency at room temperature for the four composite
systems shows good response and are reported elsewere
12
. The dielectric constant decreases
with increase in test frequency indicating dispersion in certain frequency region and then
reaches a constant value. The high values of dielectric constant at lower frequency region and
low values at higher frequency region indicate large dispersion due to Maxwell-Wagner
18, 19
type of interfacial polarization in accordance with Koop’s theory. At lower frequencies the
dielectric constants of ferrites, ferroelectrics and their composites vary randomly. It is due to
the mismatching of grains of ferrites and ferroelectrics in the composites and hence it is
difficult to estimate the effective values of dielectric constant of composites.
The decrease in dielectric constant with increase in frequency indicating dielectric
dispersion due to dielectric polarization. Dielectric polarization is due to the changes in the
valence states of cations and space charge polarization mechanism. At higher frequencies,
the dielectric constant is independent of frequency due to the inability of the electric dipoles
to follow up the fast variation of the applied alternating electric field and increase in friction
between the dipoles. However, at lower frequencies the higher values of the dielectric
constant are due to heterogeneous conduction; some times it is because of polaron hopping
mechanism resulted in electronic polarization contributing to low frequency dispersion. In
composites due to the friction, the dipoles dissipate energy in the form of heat which affects
internal viscosity of the system and results in decrease of the dielectric constant; this
frequency independent parameter is known as static dielectric constant. The dielectric
behavior in composites can also be explained on the basis of polarization mechanism in
ferrites because conduction beyond phase percolation limit is due to ferrite. In ferrites, the
rotational displacement of Fe
3+
↔ Fe
2+
dipoles results in orientation polarization that may
be visualized as an exchange of electrons between the ions and alignment of dipoles
themselves with the alternating field. In the present ferrites, the presence of Ni
2+
/Ni
3+
,
Co
2+
/Co
3+
and Zn
2+
/Zn
3+
ions give rise to p-type carriers and also their displacement in the
external electric field direction contributes to the net polarization in addition to that of n-
type carriers. Since the mobility of p-type carriers is smaller than that of n-type carriers, their
contribution to the polarization decreases more rapidly even at lower frequency. As a result,
the net polarization increases initially and then decreases with increase in frequency. The
transport properties such as electrical conductivity and dielectric dispersion of ferrites are
mainly due to the exchange mechanism of charges among the ions situated at
crystallographic equivalent sites
20
. Iwauchi
21
and Rezlescu et al have established inverse
relation between conduction mechanism and dielectric behavior based on the local
displacement of electrons in the direction of applied field.
The variation of dielectric loss factor (tanδ) with frequency was also explained. At lower
frequencies loss factor is large and it goes on decreasing with increase in frequency. The loss
factor is the energy dissipation in the dielectric system, which is proportional to the
imaginary part of the dielectric constant (ε′′). At higher frequencies, the losses are reduced
due to serial arrangements of dipoles of grains which contribute to the polarization. The
losses can also be explained in terms of relaxation time and the period of applied field.
Ferroelectrics - Characterization and Modeling
272
When loss is minimum, then relaxation time is greater than period of applied field and it is
maximum when relaxation time is smaller than the period of applied field.
6.3 Ferroelectric phase
The variations of dielectric constant with temperature for two ferroelectric systems (BPZT
and PZT) are shown in figs (5 & 6). The dielectric constant increases with increase in
temperature and becomes maximum at Curie temperature (T
c
) and there after it decreases.
For BPZT and PZT ferroelectrics, the observed T
c
are nearly 160
o
C and 410
o
C, slightly
greater than the reported values and can be attributed to constrained grains. Hiroshima et al
22
have reported a close relation between the Curie temperature and internal stresses
developed in the constrained grains at the phase transition temperature. The internal stress
can shift T
c
to higher temperature sides in case of larger grains (diameter greater than 1 μm).
0 50 100 150 200 250 300
0
1000
2000
3000
4000
5000
1KHz
10KHz
100KHz
1MHz
Dielectric constant (ε')
Temperature (
O
C)
Fig. 5. Variation of dielectric constant with temperature for Ba
0.8
Pb
0.2
Zr
0.8
Ti
0.2
O
3
ferroelectric
phase
0 100 200 300 400 500 600
0
1000
2000
3000
4000
5000
6000
7000
8000
9000
1KHz
10KHz
100KHz
1MHz
Dielectric constant (ε')
Temperature (
O
C)
Fig. 6. Variation of dielectric constant with temperature for Pb
Zr
0.8
Ti
0.2
O
3
ferroelectric phase
The larger grained structure and changes in internal stresses are expected in the pellets due
to higher sintering temperature. The large grained ferroelectrics have considerable internal
The Ferroelectric Dependent Magnetoelectricity in Composites
273
stress concentration which is enough to form micro cracks at the grain boundaries and hence
induced internal stresses are relieved. But in small grain sized ceramics, increased grain
boundaries form less micro cracks which reduce the internal stress concentration. Usually
the ferroelectric materials have high dielectric constant compared to ferrite; hence dielectric
property is enhanced with the increase in ferroelectric content, which is very important in
the study of ME output
12
. The nature of variation of dielectric loss tangent with temperature
for all the series of composites and their constituent phases shown in figures (7 & 8), almost
the same as that of the variation of dielectric constant with temperature. The observed
dispersion behavior of the loss tangent is attributed to higher domain mobility near the
Curie temperature.
0 100 200 300 400 500 600
0
2
4
6
8
10
1KHz
10KHz
100KHz
1MHz
tanδ
Temperature (
O
C)
Fig. 7. Variation of dielectric loss tangent with temperature for Ba
0.8
Pb
0.2
Zr
0.8
Ti
0.2
O
3
ferroelectric phase
0 100 200 300 400 500 600
0
2
4
6
8
10
1KHz
10KHz
100KHz
1MHz
tanδ
Temperature (
O
C)
Fig. 8. Variation of dielectric loss tangent with temperature for Pb
Zr
0.8
Ti
0.2
O
3
ferroelectric phase
6.4 Variation of AC conductivity with frequency at room temperature
The variation of AC conductivity (σ
AC
) as a function of frequency was presented in figures
(9 - 12). From AC conductivity one can retrieve at the behaviour of thermally activated
conduction mechanism and the type of polarons responsible for the conduction mechanism.
Ferroelectrics - Characterization and Modeling
274
4 6 8 10 12 14
-8.5
-8.0
-7.5
-7.0
-6.5
-6.0
-5.5
-5.0
-4.5
-4.0
Log (σ
ac
-σ
dc
)
Log ω
2
x=0.00
x=0.15
x=0.30
x=0.45
x=1.00
Fig. 9. Variation of AC conductivity with frequency for (x) Ni
0.2
Co
0.8
Fe
2
O
4
+ (1-x) Ba
0.8
Pb
0.2
Zr
0.8
Ti
0.2
O
3
composites
Infact the polaron type of conduction was reported by Austin and Mott
23
and Appel et al.
According to Alder and Feinleib
24
the direct frequency dependence conduction due to small
polarons is given by the relation
()
22
22
1
AC DC
ωτ
σσ
ωτ
−=
−
(3)
Where ω is the angular frequency and τ is the staying time (10
-10
s), for all the ceramics ω
2
τ
2
< 1. The plots of log (σ
AC
-σ
DC
) against Log ω
2
are linear in nature indicating small polaron
type of conduction. However, a slight decrease in the conductivity at a certain frequency is
attributed to mixed polaron (small/large) type of conduction and similar results are
reported by various workers. In the present case, the AC conductivity of the composites
caused by small polarons is responsible for the good ME response.
4 6 8 10 12 14
-10.0
-9.5
-9.0
-8.5
-8.0
-7.5
-7.0
-6.5
-6.0
-5.5
-5.0
-4.5
Log (σ
ac
-σ
dc
)
Log ω
2
x=0.00
x=0.15
x=0.30
x=0.45
x=1.00
Fig. 10. Variation of AC conductivity with frequency for (x) Ni
0.2
Co
0.8
Fe
2
O
4
+ (1-x) Pb
Zr
0.8
Ti
0.2
O
3
composites
The Ferroelectric Dependent Magnetoelectricity in Composites
275
468101214
-10.0
-9.5
-9.0
-8.5
-8.0
-7.5
-7.0
-6.5
-6.0
-5.5
-5.0
-4.5
-4.0
Log (σ
ac
-σ
dc
)
Log ω
2
x=0.00
x=0.15
x=0.30
x=0.45
x=1.00
Fig. 11. Variation of AC conductivity with frequency for (x) Ni
0.5
Zn
0.5
Fe
2
O
4
+ (1-x) Ba
0.8
Pb
0.2
Zr
0.8
Ti
0.2
O
3
composites
4 6 8 10 12 14
-10.0
-9.5
-9.0
-8.5
-8.0
-7.5
-7.0
-6.5
-6.0
-5.5
-5.0
-4.5
Log (σ
ac
-σ
dc
)
Log ω
2
x=0.00
x=0.15
x=0.30
x=0.45
x=1.00
Fig. 12. Variation of AC conductivity with frequency for (x) Ni
0.5
Zn
0.5
Fe
2
O
4
+ (1-x) Pb
Zr
0.8
Ti
0.2
O
3
composites
7. Magnetoelectric effect- A product property
Magnetoelectricity, the product property, requires biphasic surrounding to exhibit the
complex behaviour. The primary magnetoelectric (ME) materials can be magnetized by
placing them in electric field and can be electrically polarized by placing them in magnetic
field
25
. The magnetoelectric effect in the composites having ferrite and ferroelectric phases
depends on the applied magnetic field, electrical resistivity, mole percentage of the constituent
phases and mechanical coupling between the two phases. The resistivity of the composites is a
temperature dependent property which decreases in high temperature region, making the
polarization of the samples more difficult. In the present studies the ME voltage coefficient is
measured at room temperature. The ME coupling can be obtained by electromechanical
conversion in the ferrite and ferroelectric phases by the transfer of stress through the interface
between these two phases. Infact magneto mechanical resonance in the ferrite phase and
electromechanical resonance in ferroelectric phase are responsible for the origins of ME peaks.
Ferroelectrics - Characterization and Modeling
276
For the composite systems (x) Ni
0.2
Co
0.8
Fe
2
O
4
+ (1-x) Ba
0.8
Pb
0.2
Zr
0.8
Ti
0.2
O
3
(with x = 0.15, 0.30
and 0.45) the variation of static magnetoelectric conversion factor with applied DC magnetic
field is shown in fig. 13. From the figure it is clear that magnetoelectric voltage coefficient
(dE/dH)
H
increases slowly with applied magnetic field and after attaining a maximum value
again it decreases. The constant value of (dE/dH)
H
indicates that the magnetostriction reaches
its saturation value at the time of magnetic poling and produces constant electric field in the
ferroelectric phase. The static ME conversion factor depends on mole % of ferrite and
ferroelectric phases in the composites, however with further increase in mole fraction of ferrite
phase, the maganetoelectric voltage coefficient (dE/dH)
H
decreases. The lower values of static
ME output are due to low resistivity of ferrite phase compared to that of ferroelectric phase. At
the time of poling, charges are developed in the ferroelectric grains through the surrounding
of low resistivity ferrite grain and leakage of such charges is responsible for low static ME
output. However, the static magnetoelectric voltage coefficient (dE/dH)
H
decreases with
increase in grain size of the ferrite and ferroelectric phases in the composites. The large grains
are (polydomain) less effective in inducing piezomagnetic and piezoelectric coefficients than
that of the smaller ones
26
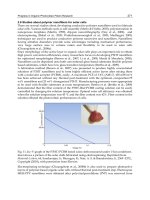
. Motagi and Hiskins reported the variation of piezoelectric property
of ferroelectric phase with grain size. Infact the ME conversion factor also depends on porosity
and grain size. In the present experimental investigation it is found that small grains with low
porosity are important for getting high ME out put in the composites. A maximum static ME
coefficient of 536 μV/cm Oe is observed in the composite containing 15 % Ni
0.2
Co
0.8
Fe
2
O
4
+ 85
% BPZT (table. 1). The observed results for the composite system (x) Ni
0.2
Co
0.8
Fe
2
O
4
+ (1-x) Pb
Zr
0.8
Ti
0.2
O
3
(with x = 0.15, 0.30 and 0.45) are shown figure. 14. The high ME out put of 828
μV/cm Oe is observed for the composite containing 15 % Ni
0.2
Co
0.8
Fe
2
O
4
+ 85 % Pb
Zr
0.8
Ti
0.2
O
3
(table 1). High magnetostriction coefficient and piezoelectric coefficient of the ferrite and
ferroelectric phases are responsible for high ME out put in these composites.
0 1000 2000 3000 4000 5000 6000
400
420
440
460
480
500
520
540
560
x=0.15
x=0.30
x=0.45
(dE/dH)
H
μV/cm.Oe
H (Oe)
Fig. 13. Magnetic field dependent variation of ME voltage coefficient at room temperature
for (x) Ni
0.2
Co
0.8
Fe
2
O
4
+ (1-x) Ba
0.8
Pb
0.2
Zr
0.8
Ti
0.2
O
3
ME composites.
From the investigation it is observed that increase in ferrite content in the composites leads
to the enhancement of elastic interaction. But there is a limit to the addition of ferrite in the
composite because further increase in ferrite content in the composites leads to the decrease
in the resistivity of composites. Therefore the additions of ferrites in the composites are
restricted to only 0.15, 0.30 and 0.45, because at these values there is a resistivity matching
The Ferroelectric Dependent Magnetoelectricity in Composites
277
between ferrite and ferroelectric phases. Many workers studied Ni, Co and Zn ferrite with
BaTiO
3
ferroelectric by ceramic method and reported very weak ME response inspite of high
resistivity of the ferrites. But in the present composites better ME voltage coefficients are
obtained, which may be due to the presence of cobalt ions (Co
+2
) in ferrites, as it causes large
lattice distortion in the ferrite lattice and induces more mechanical coupling between the
ferrite and ferroelectric phases, leading to the polarization in the piezoelectric phases.
Similarly substitution of Zn in nickel also enhances the magnetostriction coefficient and
hence shows good ME response.
0 1000 2000 3000 4000 5000 6000
720
740
760
780
800
820
840
860
x=0.15
x=0.30
x=0.45
(dE/dH)
H
μV/cm Oe
H (Oe)
Fig. 14. Magnetic field dependent variation of ME voltage coefficient at room temperature
for (x) Ni
0.2
Co
0.8
Fe
2
O
4
+ (1-x) Pb
Zr
0.8
Ti
0.2
O
3
ME composites.
The magnetic field dependent variation of the ME voltage coefficient with magnetic field for
the composite system (x) Ni
0.5
Zn
0.5
Fe
2
O
4
+ (1-x) Ba
0.8
Pb
0.2
Zr
0.8
Ti
0.2
O
3
is shown in fig 15. The
ME coefficient increases linearly with applied magnetic filed (< 1.0 K Oe) and after acquiring
a maximum value decreases linearly. The initial rise in ME output is attributed to the
enhancement in the elastic interaction, which is confirmed by the hysteresis measurements.
0 1000 2000 3000 4000 5000 6000
600
620
640
660
680
700
x=0.15
x=0.30
x=0.45
(dE/dH)
H
μV/cm.Oe
H (Oe)
Fig. 15. Magnetic field dependent variation of ME voltage coefficient at room temperature
for (x) Ni
0.5
Zn
0.5
Fe
2
O
4
+ (1-x) Ba
0.8
Pb
0.2
Zr
0.8
Ti
0.2
O
3
ME composites.
Ferroelectrics - Characterization and Modeling
278
The intensity of the magnetostriction reaches saturation value above 1.0 K Oe and hence, the
magnetization and associated strain produce a constant electric field in the ferroelectric
phase beyond the saturation limit. The maximum ME voltage coefficient of 698 μV/cm Oe is
observed for the composites containing 30 % Ni
0.5
Zn
0.5
Fe
2
O
4
+ 70 % Ba
0.8
Pb
0.2
Zr
0.8
Ti
0.2
O
3
(table. 1). It is well known that the ME response of the composites depends on the
piezoelectricity of the ferroelectric phase and the magnetostriction of the ferrite phase. The
composites prepared with a lower content of the ferrite or ferroelectric phase results in the
reduction of piezoelectricity or magnetostriction respectively, leading to a decrease in the
static ME voltage coefficient as predicted theoretically. The increase in ME output at x = 0.30
(table. 1) may be attributed to the uniform distribution of small grains in both the phases.
However, the uneven particle size of the phases reduces the mechanical coupling between
them and causes significant current loss in the sample
27
. The similar results have been
observed for the composite system (x) Ni
0.5
Zn
0.5
Fe
2
O
4
+ (1-x) Pb
Zr
0.8
Ti
0.2
O
3
(with x = 0.15,
0.30 and 0.45) shown in fig. 16.
Composition (x)
ME Voltage Coefficient (dE/dH)
H
(μV/cm Oe)
(x) Ni
0.2
Co
0.8
Fe
2
O
4
+ (1-x) Ba
0.8
Pb
0.2
Zr
0.8
Ti
0.2
O
3
0.15 536
0.30 530
0.45 520
(x) Ni
0.2
Co
0.8
Fe
2
O
4
+ (1-x) Pb
Zr
0.8
Ti
0.2
O
3
0.15 828
0.30 815
0.45 801
(x) Ni
0.5
Zn
0.5
Fe
2
O
4
+ (1-x) Ba
0.8
Pb
0.2
Zr
0.8
Ti
0.2
O
3
0.15 663
0.30 698
0.45 635
(x) Ni
0.5
Zn
0.5
Fe
2
O
4
+ (1-x) Pb
Zr
0.8
Ti
0.2
O
3
0.15 839
0.30 808
0.45 783
Table. 1. Variation of ME Voltage Coefficient with composition
The Ferroelectric Dependent Magnetoelectricity in Composites
279
0 1000 2000 3000 4000 5000 6000
720
740
760
780
800
820
840
860
x=0.15
x=0.30
x=0.45
(dE/dH)
H
μV/cm.Oe
H (Oe)
Fig. 16. Magnetic field dependent variation of ME voltage coefficient at room temperature
for (x) Ni
0.5
Zn
0.5
Fe
2
O
4
+ (1-x) Pb
Zr
0.8
Ti
0.2
O
3
ME composites
8. Conclusion
In the study of ME effect, initially ME voltage coefficient (dE/dH)
H
increases with the
increase in applied DC magnetic field and thereafter decreases linearly. It is attributed to the
increase in elastic interaction caused by magnetostriction and piezoelectric effect aswell as
low leakage of currents and high degree of polarization.
1. ME output depends on the resistivity and mole percentage of ferrite/ferroelectric
phases and maximum ME output is observed for high resistivity composites. The
decrease in dielectric constant with frequency shows the dielectric dispersion at lower
frequency region.
2. ME output increases with decrease in the grain size of the individual phases. However,
large particles are less effective in inducing piezoelectric and piezomagnetic effect
compared to smaller grains. The composites having high porosity exhibit better ME
response, because the pores provides resistance to the electrons.
3. The present ME composites having large ME response vary linearly with DC electric
field in the low and high magnetic field regions and are attractive for technological
applications for ME devices.
The content of ferroelectric is very important for getting high ME voltage coefficient. But in
order to obtain still better ME response, one can use layered (bilayer layer and multilayer)
composites of two phases (ferrites and ferroelectrics) and it requires minimum deficiencies
with particles of nano size.
9. Acknowledgement
The authors are thankful to Prof. B K Chougule, former head Department of Physics, Shivaji
University, Kolhapur and Dr. R B Pujar, former, Principal, S S Arts and T P Science Institute
Sankeshwar for fruitful discussions.
10. References
[1] Pawar. D. V. (1995). Bull. Mater. Sci. 18 141
[2] Srinivasan. G, Rasmussen. E. T, Levin. B. J & Hayes. R. (2003). Phy. Rev. B. 65 134402
Ferroelectrics - Characterization and Modeling
280
[3] Hummel. R. E, (2004). Electronic Properties of Materials, III edition, Spinger Publication
[4] Kanai. T, Ohkoshi. S. I, Nakajima. A, Wajanabe. T & Hashimoto. K. (2001). Adv. Mater. 13
487
[5] Suryanarayana. S. V. (1994). Bull. Mater. Sci. 17 (7) 1259
[6] Boomagaard. J. V & Born. R. A. J. (1978). J. Mater. Sci. 13 1538
[7] Takada. T & Kiyama. M. (1970). Ferrite. Proceed. Internl. Conf. Japan 69
[8] Sato. T, Kuroda. C & Sato. M. (1970). Ferrite. Proceed. Internl. Conf. Japan 72
[9] Bragg. W. L. (1915). Nature. (London) 95 561
[10] Goodenough. J. B. (1963). Magnetism and Chemical Bond. Interscience, New York
[11] Paulus. M. (1962). Phys. Stat. Solidi (a). 2 1181
[12] Bammannavar. B. K, Naik. L. R & Chougule. B. K. (2008). J. Appl. Phys. 104 064123.
[13] Choudharey. R. N. P, Shannigrahi. S. R & Singh. A. K. (1999). Bull. Mater. Sci. 22 (6) 75
[14] Boomgaard. J. V &Born. R. A. J. (1978). J. Mater. Sci. 13 1538
[15] Bammannavar. B. K, Chavan. G. N, Naik. L .R & Chougule. B. K. (2009). Matt. Chem.
Phys. 11 746
[16] Bammannavar. B. K & Naik. L. R. (2009). Smart. Mater. Struct. 18 085013
[17] Devan. R. S, Kanamadi. C. M, Lokare. S. A & Chougule. B. K. (2006). Smart. Mater.
Struct. 15 1877
[18] Maxwell. J. C. (1973). Electricity and Magnetism. Oxford University Press, London
[19] Wagner. K. W. (1913). Ann. Physik. 40 817
[20] Vishwanathan. B & Murthy. V. R. K. (1990). Ferrite Materials: Science and Technology
.(New Delhi; Narosa Publishing House)
[21] Iwauchi. K. (1971). Japn. J. Appl. Phys. 10 152
[22]
Hiroshima. T, Tanaka. K & Kimura. T. (1996). J. Am. Ceram. Soc. 79 3235
[23] Austin. I. G & Mott. N. F. (1996). Adv. Phys. 18 411
[24] Alder. D & Feinleib. J. (1970). Phys. Rev. B. 2 3112
[25] Ryu. J, Priya. S, Uchino. K & Kim. H. (2002). J. Electroceram. 8 107
[26] Devan. R. S, Lokare. S. A, Patil. D. R, Chougule. S. S, Kolekar. Y. D & Chougule. B. K.
(2006). J. Phys. Chem. Solids. 67 1524
[27] Bammannavar. B. K & Naik. L. R. (2009). J. Magn. Magn, Mater. 321 382
15
Characterization of Ferroelectric
Materials by Photopyroelectric Method
Dadarlat Dorin
1
, Longuemart Stéphane
2
and Hadj Sahraoui Abdelhak
2
1
National R&D Institute for Isotopic and Molecular Technologies Cluj-Napoca,
2
University Lille Nord de France, ULCO, Dunkerque,
1
Romania
2
France
1. Introduction
During last decades, the photothermal techniques have been largely applied to the study of
thermal and optical properties of condensed matter. Photothermal techniques are based on
the same physical principle: the optical energy, absorbed by given material, is partially
converted into heat; depending on the way used to measure the quantity of heat and to
follow its propagation through the material, several photothermal techniques have been
developed (photoacoustic calorimetry, photothermal radiometry, photothermal deflection,
thermal lensing, photopyroelectric method) (Tam, 1986). In this chapter we will focus on the
simplest one, the photopyroelectric calorimetry and its applications concerning the
investigation of some thermal and electrical properties of ferroelectric materials.
The photopyroelectric (PPE) detection was introduced in 1984, as a powerful tool for high-
resolution measurement of thermal properties of materials (Coufal, 1984; Mandelis, 1984).
The pyroelectric effect consists in the induction of spontaneous polarization in a
noncentrosymmetric, piezoelectric crystal, as a result of temperature change in the crystal.
Single crystals as LiTaO
3
and TGS, ceramics as PZT or polymers as PVDF were used as
pyroelectric sensors, for the main purpose of measuring temperature variations. In
principle, in the PPE method, the temperature variation of a sample exposed to a modulated
radiation is measured with a pyroelectric sensor, situated in intimate thermal contact with
the sample (Mandelis & Zver, 1985; Chirtoc & Mihailescu, 1989). The main advantages of
this technique were found to be its simplicity, high sensitivity, non-destructive character
and adaptability to practical restrictions imposed by the experimental requirements.
From theoretical point of view, in the most general case, the complex PPE signal depends on
all optical and thermal parameters of the different layers of the detection cell. A large effort
was dedicated in the last decades to simplify the mathematical expression of the PPE signal.
As a final result, several particular cases were obtained, in which the information is
contained both in the amplitude and phase of the PPE signal (Mandelis & Zver, 1985;
Chirtoc & Mihailescu, 1989); the amplitude and phase depend in these cases on one or, in a
simple way, on two of the sample's related thermal parameters.
The thermal parameters resulting directly from PPE measurements are usually the thermal
diffusivity and effusivity. It is well known that the four thermal parameters, the static volume
specific heat, C, and the dynamic thermal diffusivity, α , conductivity, k, and effusivity, e, are
Ferroelectrics - Characterization and Modeling
282
connected by two relationships, k=C
α
and e=(Ck)
1/2
; in conclusion, only two are independent. It
is important to note that the PPE calorimetry is (at the authors knowledge) the only technique
able to give in one measurement the value of two (in fact all four) thermal parameters.
Consequently, it is obvious that the PPE method is suitable not only to characterize from
thermal point of view a large class of solids and liquids, but also to study processes
associated with the change of the thermal parameters as a function of temperature (phase
transitions, for example), composition (chemical reactions), time (hygroscopicity), etc.
A particular application of the PPE calorimetry is the characterization of the ferroelectric
materials. The application is particular in this case because many ferroelectric materials are
in the same time pyroelectric materials. Consequently the investigated ferroelectric
specimen can be inserted in the PPE detection cell, both as sample or (sometimes) as
pyroelectric sensor, offering additional possibilities for thermal characterization.
This chapter makes a brief summary of the theoretical and experimental possibilities offered
by the PPE calorimetry in thermal characterization of some ferroelectric materials; the
advantages and the limitations of the technique, as well as a comparison with other
techniques are presented.
2. Development of the PPE theoretical aspects concerning the thermal
characterization of ferroelectric materials
From theoretical point of view, there are two PPE detection configurations, "back" and
"front", mainly applied for calorimetric purposes. In the back (BPPE) configuration, a
modulated light impinges on the front surface of a sample, and a pyroelectric sensor,
situated in good thermal contact with the sample's rear side, measures the heat developed in
the sample due to the absorption of radiation. In the front (FPPE) configuration, the
radiation impinges on the front surface of the sensor, and the sample, in good thermal
contact with its rear side, acts as a heat sink (Mandelis & Zver, 1985; Chirtoc & Mihailescu,
1989). The geometry of the BPPE and FPPE configurations is presented in Fig.2.1.
Fig. 2.1 Schematic diagram of the PPE detection cell: (g) – air, (w) – window, (m) – material,
(p) – pyroelectric sensor, (s) – substrate.
In the BPPE configuration the ferroelectric sample is represented by the “material” (m)
layer; in the FPPE configuration, the “material” layer is missing, and the investigated
material is the pyroelectric sensor itself.
Characterization of Ferroelectric Materials by Photopyroelectric Method
283
2.1 Ferroelectric material inserted as sample in the detection cell (“back” detection
configuration)
With the additional simplifying assumptions that the window and substrate are thermally
thick, the air and window are optically transparent and the incident radiation is absorbed
only at the window-material interface (by a thin opaque layer), the PPE voltage is given by
(Delenclos et al., 2002):
)2())exp()exp(()exp()exp(
)1()exp()exp(
)1)(1(
)exp(2
0
mmwmppsppp
mp
ppmpsppp
spppsppp
mpwm
mm
LRLRLRLRRL
RLRL
bb
LV
V
σσσσσ
σσ
σ
−−−+−−−
+−−+−
×
++
−
=
(2.1)
where
(1)/(1)
jk jk jk
Rb b=− +
;
kjjk
eeb /= ;
()
jj
ai+= 1
σ
; μ= (2
α
/ω)
1/2
(2.2)
In Eq. (2.1), V
0
is an instrumental factor, R
jk
represents the reflection coefficient of the
thermal wave at the ‘jk’ interface, ω is the angular chopping frequency and σ and a are the
complex thermal diffusion coefficient and the reciprocal of the thermal diffusion length (a =
1/μ), respectively. In order to eliminate V
0
, a normalization of the signal is necessary, the
best reference signal being obtained by the direct illumination of the empty sensor. The
obtained normalized signal is:
)()exp(
)1)(1(
)1(2
)( fPL
bb
b
fV
mm
mpwm
gp
n
σ
−
++
+
=
(2.3)
where
1exp(2)
()
1 exp( 2 ) [ exp( 2 )] exp( 2 )
sp gp p p
s
p
m
ppp
m
p
s
ppp
wm m m
RR L
Pf
RR L R R L R L
σ
σσσ
−−
=
−−+−− −
(2.4)
If we work in the thermally thick regime for the sensor (L
p
>> μ
p
) and we extract the phase
and the amplitude from Eq. (2.3), we get for the phase:
[]
−−
−+
−=Θ
)2exp( 1
)2exp( 1)tan(
arctan
mm
mmmm
LaR
LaRLa
(2.5)
with R = R
mw
R
mp ,
and for the amplitude:
mm
mpwm
gp
n
La
bb
b
V −
++
+
= )
)1)(1(
)1(2
lnln
(2.6)
An analysis of Eq. (2.5) indicates that the sample’s thermal diffusivity (contained in a
m
) can
be directly measured by performing a frequency scan of the phase of the PPE signal. The
most suitable particular case seems to be the thermally thick regime for the sample, (L
m
>>
μ
m
), when Eqs. (2.5) and (2.6) reduce to:
Ferroelectrics - Characterization and Modeling
284
()
1/2
0
exp /2
mm
n
pm
L
VV
ee
ωα
−
=
+
; (2.7)
2/1
0
2
−Θ=Θ
m
m
L
α
ω
. (2.8)
Inserting the value of the thermal diffusivity from Eq. (2.8) in Eq. (2.7) we obtain the value of
the thermal effusivity, and, using then the well known relationships between the thermal
parameters, we get the values of the remaining two thermal parameters, volume specific
heat and thermal conductivity.
2.2 Ferroelectric material inserted as sensor in the detection cell (“front” detection
configuration)
In the previous paragraph, a pyroelectric sensor was placed in thermal contact with the
studied ferroelectric sample. However, as mentioned before, it is possible to extract
information on the pyroelectric material itself. The configuration is in this case simpler,
being reduced to a three layers model: front medium-air, pyro(ferro)electric material (p)
with opaque electrodes, and a substrate (s) in good thermal contact with the pyroelectric
sensor (Fig. 2.2.).
(p) (g) (s)
L
p
Fig. 2.2 Schematic diagram of the PPE detection cell: (g) – air, (p) – pyroelectric sample, (s) –
substrate
If we consider the front medium (g) and the substrate (s) as semi-infinite (L
g
>> μ
g
and L
s
>>
μ
s
) the PPE voltage is given by :
)2exp(1
)]exp()2[exp()exp(1
1
0
ppspgp
ppppsppp
gp
LRR
LLRL
b
V
V
σ
σσσ
−−
−−−+−−
+
= . (2.9)
Considering frequencies for which the quantity
exp( 2 )
pp
L
σ
− can be neglected, the signal
expression reduces to:
)]exp()1(1[
1
0
ppsp
gp
LR
b
V
V
σ
−+−
+
=
. (2.10)
The signal can be normalized by the one obtained with empty sensor, leading to:
1(1 )exp( )
ns
ppp
VRL
σ
=− + −
. (2.11)
Characterization of Ferroelectric Materials by Photopyroelectric Method
285
The amplitude and the phase of the normalized complex signal are then expressed as:
(1 )exp( )sin( )
arctan
1(1 )exp( )cos( )
sp pp pp
s
ppppp
RaLaL
RaLaL
+−
Θ=
−+ −
; (2.12)
22
)]cos()exp()1(1[)]sin()exp()1[(
ppppspppppspn
LaLaRLaLaRV −+−+−+=
. (2.13)
In conclusion to this sub-section, the thermal diffusivity of the ferroelectric layer can be
extracted carrying out a frequency scan of the complex PPE signal. Concerning the
normalized phase (Eq. (2.12)), it has an oscillating behaviour with zero crossing at
frequencies for which a
p
L
p
is a multiple of π. The values of these frequencies allow a direct
determination of the thermal diffusivity of the ferroelectric material, providing its thickness
is known and independently on the type of substrate. The value of the thermal diffusivity
can be then used in the equation of the normalized amplitude or phase in order to obtain the
thermal effusivity of the pyro(ferro)electric layer (providing the effusivity of the substrate is
known). In addition to the thermal parameters, it is also possible to extract the temperature
dependence of the pyroelectric coefficient γ of the pyroelectric from the instrumental factor
V
0.
In current mode, it is expressed as:
pp
f
CL
Z
I
V
2
0
0
γ
−=
, (2.14)
with I
0
the intensity of the modulated light source and Z
f
the feedback complex impedance
of the current preamplifier. The normalized signal amplitude’s variation with temperature is
then proportional to γ/C
p
.
3. Instrumentation
3.1 Experimental set-up
The experimental set-up for PPE calorimetry contains some typical components (Fig. 3.1).
Fig. 3.1 Typical experimental set-up for PPE calorimetry.
Ferroelectrics - Characterization and Modeling
286
The radiation source, usually a laser, is modulated by an acousto-optical modulator or an
electro-mechanical chopper. The PPE signal is processed with a lock-in amplifier. A
computer with adequate software is used for data acquisition. When performing
temperature scans (phase transition investigations, for example), a thermostat, provided
with Peltier elements (Jalink et al., 1996), or “cold finger” refrigerator systems (Chirtoc et al.,
2009) with additional equipment (programmable power supply, electronic thermometer,
etc.) for temperature control, is included in the set-up.
3.2 Detection cells
In the following we will describe some typical detection cells used for PPE calorimetry of
ferroelectric materials. All presented cells can operate at room temperature or can be used
for temperature scans.
3.2.1 Cold-finger cell
The cold-finger concept (Fig. 3.2) allows investigations at temperatures both below and
above the ambient. The cell is provided with two windows, for investigations in both BPPE
and FPPE configurations. In principle, the copper bar transmits the temperature to the
sample – one extremity of the bar can be cooled down by using liquid nitrogen, or heated up
electrically, with a resistive coil. The role of the 0.1 mm thick steel cylinder is to keep the cell
(excepting the copper bar) at room temperature. Depending on the operating temperature,
one can make vacuum inside the cell or introduce dry atmosphere. The temperature of the
sample is measured with a diode, glued with silicon grease to the cold finger, in the vicinity
of the sample.
Fig. 3.2 Cold finger refrigerator system
Characterization of Ferroelectric Materials by Photopyroelectric Method
287
3.2.2 Detection cell provided with Peltier elements
The design of the PPE detection cell equipped with Peltier elements is presented in Fig. 3.3.
One face of one of the two Peltier elements (electrically connected in parallel) is thermally
connected to a thermostat (liquid flux from a thermostatic bath). The opposite face of the
second Peltier element is in thermal contact with an inside-chamber that accommodates the
sample-sensor assembly. Temperature feed-back is achieved with a thermistor placed close
to the sensor. Computer-controlled temperature scans with positive/negative rates
(heating/cooling) are possible.
Fig. 3.3 PPE detection cell provided with Peltier elements
3.2.3 Application of an electric field to the sample
The electrical and thermal properties of a ferroelectric material usually depend on an
external electric field. The investigation of these properties under external electric field
requires some adaptation of the detection cell. Basically, as mentioned above, two cases
must be considered: either the ferroelectric sample is in thermal contact with a pyroelectric
sensor, either the sample is the sensor itself.
In the first case, in order to avoid the influence of the electric field on the pyroelectric signal,
a special attention must be paid for the ground of the signal: the best alternative is to use
one electrode of the sensor as a common ground for both the pyroelectric signal and the
external applied voltage (Fig. 3.4).
Fig. 3.4 Electrical connections for PPE measurement under electric field.
Applied
voltage
Pyro
signal
sample
Pyro
sensor
Optical
excitation
Ferroelectrics - Characterization and Modeling
288
When the investigated sample is the sensor itself, it is not possible to use the same set-up,
because the lock-in amplifier doesn’t accept high input voltage. The sample, having
usually high impedance, can be inserted in serial inside a circuit constituted of the bias
voltage power supply and the lock-in amplifier. In such a way, the input of the lock-in
amplifier is not affected by the relative high (tens of volts) applied bias voltage to the
sample (Fig. 3.5).
Fig. 3.5 Electrical arrangement for PPE measurement, when applying electric field to the
material acting as sensor.
4. Applications
4.1 Investigation of thermal parameters of ferroelectric thin films
For most of the applications concerning the ferroelectric materials, the knowledge of their
thermal parameters is necessary because they are relevant for evaluating the figure of
merit of a IR sensor (Whatmore, 1986), or a pyroelectric accelerator (Fullem and Danon,
2009) for instance. When used as a sensor in a PPE experiment, the knowledge of these
parameters is crucial, because all other measured properties depend of these values
(Bentefour et al., 2003). Moreover, it has been shown (Nakamura et al., 2010) that these
parameters have slightly different values as a function of the composition/purity of the
ferroelectric material.
In the following we consider an opaque ferroelectric material with electrodes perpendicular
to the spontaneous polarization, placed in thermal contact with a substrate, the normalized
pyroelectric voltage phase and amplitude, resulting from the periodic heating of the
material, in the front configuration, is given by the equation (2.12) and (2.13). In practice,
several approaches are possible for extracting the thermal parameters of the pyroelectric
sensor from the experimental data. We will present here the results obtained on a largely
used pyro(ferro)electric sensor: LiTaO
3
single crystal.
4.1.1 Thermal parameters extracted from the phase and amplitude, at a given
temperature
The behaviour of the normalized phase and amplitude of the PPE signal, as a function of
frequency, obtained for a 510µm thick LiTaO
3
single crystal is plotted in Fig.4.1.
Lock-In
Amplifier
substrate
sample
Optical excitation
Bias voltage
power supply
Characterization of Ferroelectric Materials by Photopyroelectric Method
289
0 1020304050607080
-0.05
0.00
0.05
0.10
0.15
0.20
0 1020304050607080
0.92
0.94
0.96
0.98
1.00
1.02
1.04
1.06
Normalized phase (radians)
Frequency (Hz)
Normalized amplitude
Frequency (Hz)
Fig. 4.1 Normalized signal’s phase and amplitude obtained with a 510µm thick LiTaO
3
film
and water as substrate (open circles: experimental data, solid line: best fit).
The phase and amplitude of the signal contain both information about the thermal
diffusivity and effusivity of the ferroelectric material. From analytical point of view, the
phase goes to zero for a frequency f
0
which verifies the relationship:
π
α
=
p
p
fL
0
. (4.1)
In the experiment described before, f
0
= 44.2 Hz leading to a thermal diffusivity of 1.53 10
-6
m
2
.s
-1
for LiTaO
3
. This value can be then introduced in equation (2.12) to extract R
sp
values
and finally the thermal effusivity of LiTaO
3
:
1
1
s
p
ps
s
p
R
ee
R
−
=
+
(4.2)
Knowing the thermal effusivity of water used as substrate (e
s
=1580 W.s
1/2
.m
-2
.K
-1
), the
average value of the calculated thermal effusivity is e
p
= 3603 W.s
1/2
.m
-2
.K
-1
. A similar
procedure can be adopted to extract the thermal parameters from the amplitude of the
signal. The frequency f
1
corresponding to the maximum of the amplitude should verify the
relationship (see Eq. 2.13):
4
3
1
π
α
=
p
p
fL
(4.3)
Fig. 4.1 indicates that the amplitude has a maximum for a frequency f
1
=25.3Hz,
corresponding to a value of 1.56 10
-6
m
2
.s
-1
for the thermal effusivity of LiTaO
3
. By inserting
this value in Eq. (2.13) one can extract the value of R
sp
and, using Eq. (4.2), calculate the
thermal effusivity of the ferroelectric sample. From data of Fig. 4.1, one finds e
p
= 3821
W.s
1/2
.m
-2
.K
-1
.
Ferroelectrics - Characterization and Modeling
290
A simple comparison of Eqs. (4.1) and (4.3) indicates that f
1
is theoretically proportional to f
0
by
a ratio 16/9. This criterion can be used to estimate the accuracy of the experimental results. For
example, in the experiment described before, one finds a ratio of 1.74 between f
1
and f
0
, to be
compared to the theoretical value of 16/9
)78.1(≈ . Another way to check for the validity of
the experimental results is to combine the phase and the amplitude of the signal. Considering
the model described by Eq. (2.11), a plot of the modulus of the complex quantity (1-V
n
) as a
function of the square root of frequency should display a line whose slope gives the value of
the thermal diffusivity of the sample; the extrapolation of the curve to zero frequency leads to
the value of the thermal effusivity. Such a calculation has been performed for the experimental
data shown in Fig. 4.1 and the result is represented in Fig. 4.2.
0123456
-4,0
-3,5
-3,0
-2,5
-2,0
-1,5
-1,0
-0,5
0,0
0,5
1,0
ln(|1-V
N
|)
f
1/2
(Hz
1/2
)
Fig. 4.2 Plot of the logarithm of |1-V
n
| as a function of square root of frequency, for data of
Fig. 4.1.
Fig. 4.1 indicates that the model is valid for high enough frequencies. The linear fit of the
data leads to values of thermal parameters in agreement with previous calculated ones, as
reported in table 4.I.
Procedure
Thermal diffusivity
(x10
-6
.m
2
.s
-1
)
Thermal effusivity
(W.s
1/2
.m
-2
.K
-1
)
Zero crossing (phase)
Maximum (amplitude)
1.53
1.56
3821
3603
Combination of amplitude
and phase (linear fit)
1.58 3886
Non linear fit
Phase
Amplitude
1.54
1.53
3688
3718
Table 4.I Comparison of values of thermal diffusivity and effusivity, obtained with various
procedures, for a 510µm thick LiTaO
3
single crystal.
The previous results show that the proposed model allows the determination of the thermal
parameters from a frequency scan of the PPE signal generated by the ferroelectric sample
Characterization of Ferroelectric Materials by Photopyroelectric Method
291
itself. There are several approaches giving similar results (3% to 5% maximum difference for
values of thermal diffusivity and effusivity, respectively). However, it should be pointed out
that the results obtained with the phase as source of information are often more reliable due
to the fact that the amplitude of the signal can be affected by light source’s intensity stability
as well as by the optical quality of the irradiated surface. Additionally, the frequency
dependence of the amplitude around maximum is rather smooth, and the maximum value
difficult to be located exactly.
At the end of this section, we have to mention that the theoretical results have been obtained
without any hypothesis on the nature of the ferroelectric material used as pyroelectric
sensor. The experimental results were obtained on LiTaO
3
crystals, but a similar procedure
can be carried out for any type of ferroelectric material, as PZT ceramics, polymer films
(PVDF, PVDF-TrFE) and even liquid crystal in S
C
* ferroelectric phase. In the next section this
last particular case will be described.
4.1.2 Thermal parameters of a liquid crystal in Sc* ferroelectric phase.
In this subsection the procedure described in the previous section has been extended to the
study of a ferroelectric liquid crystal (FLC). In chiral smectic S
C
* phase of FLCs, molecules are
randomly packed in layers and tilted from the layer normal. Each smectic layer possess an in
plane spontaneous polarization which is oriented perpendicularly to the molecular tilt. The
direction of the tilt plane precesses around an axis perpendicular to the layer planes so that a
helicoidal structure of the S
C
* is formed. In this helicoidal structure, the S
C
* phase doesn't
possess a macroscopic polarization. When it is confined in thin film between two substrates,
which are treated so that a planar alignment is imposed on the molecules at the surfaces, as
used in surface stabilized FLC (SSFLC) devices (Clark & Lagerwall, 1980; Lagerwall, 1999), the
smectic layers stand perpendicular to the surfaces and the helix can be suppressed if the LC
film is sufficiently thin. This results in two possible states where the orientation of the
molecules in the cell is uniform. The polarization vector in these two states is perpendicular to
the substrates but oriented in the opposite direction. In both configurations the S
C
* film
develops a macroscopic polarization, and consequently, a pyroelectric effect of the film can be
obtained when it is submitted to a temperature variation. We used the LC film as a
pyroelectric sensor and we carried out the procedure described in section 4.1.1 to determine
the thermal diffusivity and effusivity of the S
C
* mesophase.
The ferroelectric liquid crystal (FLC) used in this study was a mixture FELIX 017/000 from
Clariant Inc. (Germany). Its phase sequences and transition temperatures (in°C) are: Crystal
-26 S
C
* 70 S
A
* 75 N* 84.5 I. The sample cell was prepared using a pair of parallel glass
substrates. One of the substrates was metallised with gold. It acts as a light absorber and
generates a heat wave penetrating into the sample. The other substrate was coated with a
transparent electrode of indium-tin oxide in order to control the alignment of the FLC by
means of polarized optical microscopy. The gap of the cell was set by a 13 μm thick spacers
of PET, and the electrode area was 5
×
5mm
2
. The two plates were spin-coated with
PolyVinylAlcohol (PVA) and then rubbed in parallel directions for the FLC alignment. The
FLC was inserted by capillary action in the cell in its isotropic phase, then slowly cooled into
S
A
* and S
C
* in the presence of an AC electric field to achieve uniform alignment of the
smectic layers. The sample cell was then observed at room temperature by means of
polarized optical microscope. It was found that the LC cell exhibits a uniform texture, and
we have not observed any “up” and “down” polarization domains coexistence.
Ferroelectrics - Characterization and Modeling
292
In the previous section, the studied pyroelectric sample was a solid material and the
normalizing signal was obtained by using air as substrate. Here, the studied material is
fluid (this is the case of the liquid crystal material), the normalizing signal is then obtained
using another solid pyroelectric material with air as substrate. In this case the normalized
signal is given by:
0
1
(1 (1 )exp( ))
ns
ppp
K
VRL
K
σ
=−+ −
(4.4)
K
0
/K
1
is a real factor independent of the modulation frequency and represents the limit value
of the normalized amplitude at high frequency. This factor does not affect the analysis
carried out on Eq. (2.11) for the determination of the thermal parameters. The frequency of
the zero crossing of the normalized phase (Eq. 3.1) or the frequency corresponding to the
normalized amplitude maximum (Eq. 3.3) allows the determination of the absolute value of
the thermal diffusivity of the sample. The thermal effusivity can also be calculated from the
normalized amplitude once α
p
is obtained and the quantity K
0
/K
1
is determined from the
value of the normalized amplitude at high frequency. The frequency behaviour of the
normalized phase of the PPE signal is shown in Fig. 4.3.a
10 100 1000
-0.1
0.0
0.1
0.2
0.3
0.4
0.5
0.6
0.7
0.8
Normalized phase (radians)
Frequency (Hz)
10 100 1000
1
Normalized amplitude
Frequency (Hz)
(a) (b)
Fig. 4.3 Experimental frequency behaviour of the normalized phase (a) and the normalized
amplitude (b) obtained for the liquid crystal at room temperature, in the S
C
* phase.
As expected from the theory, the phase goes to zero, for a frequency f
0
= 354 Hz. Once f
0
is
determined, equation 4.1 is used to obtain the thermal diffusivity of the ferroelectric liquid-
crystal sample. A value of α
p
= 1.90 10
−8
m
2
s
−1
was found.
The normalized amplitude of the PPE signal (Fig. 4.3.b) shows a maximum for the frequency
f
1
= 191 Hz. The value of
α
p
calculated by using Eq. (4.3) is
α
p
= 1.82 10
−8
m
2
s
−1
, denoting
that the values of the thermal diffusivity obtained independently from phase and amplitude
are in good agreement.
The effusivity e
p
is calculated from the signal phase by using Eqs. (2.12) and (4.2) and taking
from the literature the value of the thermal effusivity of glass (e
s
= 1503 Ws
1/2
m
−2
K
−1
). The
Characterization of Ferroelectric Materials by Photopyroelectric Method
293
mean value of e
p
is then calculated in a range of frequencies for which the sample is
thermally thick; e
p
is found to be 340W s
1/2
m
−2
K
−1
.
The same procedure carried out for different temperatures allows for example the
investigation on the temperature dependence of the thermal parameters of the smectic S
C
*
phase and near the S
C
*-S
A
* transition of FLC materials. However, the use of frequency scans
together with temperature scanning procedures can be time consuming when working in
the vicinity of critical regions. In the next section, we will introduce a procedure avoiding
such frequency scans.
4.1.3 The temperature dependence of the thermal parameters
In the previous section, it has been shown that a frequency scan of the amplitude and/or the
phase of the photopyroelectric signal allows the direct measurement of the room
temperature values of thermal diffusivity and effusivity of a ferroelectric material and
consequently, the calculation of its heat capacity and thermal conductivity. In the following
we will describe a procedure useful to study the temperature evolution of these thermal
parameters without involving any frequency scan.
Considering the modulus A and the argument
φ
of the complex quantity 1-V
n
, and using
Eq. (2.11), one has:
)exp()1(
ppsp
LaRA −+=
and
pp
aL
φ
=
The expression for the thermal diffusivity and thermal effusivity is obtained as a function of
A and
φ
as:
2
2
φ
π
α
fL
p
p
=
(4.5)
1
)exp(
−
−
=
φ
A
R
sp
(4.6)
A and
φ
are calculated from the phase Θ and the amplitude |V
n
| of the PPE signal, using
the relationship:
2
12 cos
nn
AV V=+− Θ
(4.7)
Θ−
Θ
=
cos1
sin
arctan
n
n
V
V
φ
(4.8)
We have applied this procedure to find the temperature dependence of thermal parameters
of a 510µm thick LiTaO
3
single crystal, provided with opaque electrodes and using ethylene
glycol as substrate. The temperature range was 25°C-70°C. During the experiment, the
modulation frequency was 7.2Hz. The signal of the LiTaO
3
alone (without substrate) was
recorded in the same conditions for normalization purposes. The normalized amplitude and
phase are represented in Fig. 4.4. The thermal diffusivity and thermal effusivity, calculated
from these data, are displayed in Fig. 4.5.