Nuclear Power System Simulations and Operation Part 4 potx
Bạn đang xem bản rút gọn của tài liệu. Xem và tải ngay bản đầy đủ của tài liệu tại đây (429.32 KB, 15 trang )
Nuclear Power - System Simulations and Operation
34
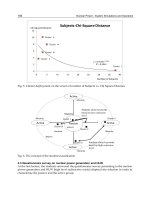
Future woks will simulate the IPR-R1 employing other method to flux calculate. The
information about neutron flux predicted by MNCP5 and MCNPX 2.6.0 can improve NAA
where the sample activity can be estimated knowing neutron flux. Furthermore, these codes
can characterize the neutron flux in other parts of the reactor where experimental measuring
is difficult to be obtained.
Previous Studies Present Study
Model 1
(MCNP 4B)
Model 2
(MCNP5)
Model 3
(MCNPX)
Position
RSR
Experi-
mental
Value
Value Error Value Error Value Error
1 6.69 6.77 1.18 6.11 8.67 7.14 6.30
3 6.55 6.65 1.50 6.60 0.76 6.50 0.76
7 6.35 6.67 4.80 5.79 8.82 6.32 0.47
10 5.99 6.90 13.19 6.44 6.99 6.24 4.01
24 6.94 6.98 0.57 6.33 8.79 6.97 0.43
25 6.45 6.86 5.98 6.91 6.66 6.54 1.38
29 7.32 6.86 6.28 6.57 10.25 6.77 7.51
34 7.30 6.73 7.81 5.90 19.18 5.77 20.96
35 7.18 6.72 6.41 7.00 2.51 6.29 12.40
38 6.58 6.80 3.24 5.76 12.46 5.58 15.20
40 6.16 6.73 8.47 5.91 4.06 6.51 5.38
Table A2. Thermal neutron flux (x 10
11
n/cm
-2
s
-1
)
ANNEX B. Example of RELAP5 code application to IPR-R1 research reactor
BI. Introduction
The RELAP5 system code was developed to simulate transient scenarios in power reactors
such as PWR and BWR but recent works have been performed to investigate the
applicability of the code to research reactors operating conditions with good results.
Specifically, the TRIGA reactors are constructed in a variety of configurations and
capabilities, with steady-state power levels ranging from 20 kilowatts to 16 megawatts
offering true "inherent safety". TRIGA is a pool-type reactor that can be installed without a
containment building being designed for use by scientific institutions and universities for
purposes such as graduate education, private commercial research, non-destructive testing
and isotope production.
In the present work, the IPR-R1 TRIGA reactor, Mark-I model, installed in Brazil, in
operation since 1960, has been modeled for RELAP5 code with the aim of to reproduce the
measured steady-state as well as transient conditions. The development and the calculation
for the validation of a RELAP5 model for the IPR-R1 TRIGA research reactor have been
presented. The version MOD3.3 was used to perform the simulations. The current results
obtained with the developed nodalization demonstrate that the IPR-R1 TRIGA model is
representative of the reactor behaviour considering steady-state and transient operation
conditions as it is being described in the next sections.
Safety Studies and General Simulations of Research Reactors Using Nuclear Codes
35
IPR-R1 presents low power, low pressure, for application in research, training and
radioisotopes production. The reactor is housed in a 6.625 meters deep pool with 1.92 meters
of internal diameter and filled with light water. A schematic reactor diagram is illustrated in
the Figure B1.
Fig. B1. Schematic representation of the IPR-R1 (out of scale, measure in mm)
The main aim of the water in the pool is for cooling, as well as moderator, neutron reflector
and it is able to assure an adequate radioactive shielding. The reactor cooling occurs
predominantly by natural convection, with the circulation forces governed by the water
density differences. The heat removal generated from the nuclear fissions is performed
pumping the pool water through a heat exchanger. The core has a radial cylindrical
configuration with six concentric rings (A, B, C, D, E, F) with 91 channels able to host either
fuel rods or other components like control rods, reflectors and irradiator channels. There are
in the core 63 fuel elements constituted by a cylindrical metal cladding filled with a
homogeneous mixture of zirconium hydride and Uranium 20% enriched in
235
U isotope.
There are 59 fuel elements covered with aluminium and 4 fuel elements with stainless steel.
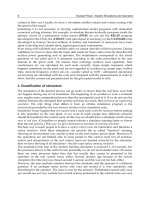
BII. Modelling
Each of the 63 fuel elements was modelled separately and 63 heat structure (HS)
components were associated with 13 corresponding hydrodynamic pipe components
constituting 13 hydrodynamic channels (201 – 213), as can be verified in Figure B2.
Figure B3 shows the RELAP5 general nodalization developed to simulate the IPR-R1. The
reactor pool was modelled using two pipe components, each one composed by ten volumes.
As it can be verified by the Figure B3, both components (020 and 050) have their volumes
connected by single junctions to characterize a cross flow model. This model improves
transient predictions as it will be clearly demonstrated in the transient results. A time
Nuclear Power - System Simulations and Operation
36
dependent volume was used to simulate the atmospheric pressure on the pool surface. The
natural convection system and the primary loop circulation have been modelled. The
secondary loop, composed mainly by the external cooling tower was not modelled in the
present nodalization because the primary circuit was sufficient to guaranty the heat removal
of the coolant.
Fig. B2. Representation of the 13 TH channels in RELAP5 model
Fig. B3. IPR-R1 TRIGA nodalization in the RELAP5 model
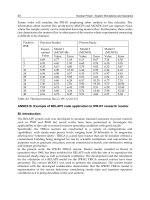
The point kinetics model was used in the current model. A detailed representation of each
element is, however, essential to properly take into account the radial power distribution
associated with the position of the fuel elements. The axial power distribution was
Safety Studies and General Simulations of Research Reactors Using Nuclear Codes
37
calculated considering a cosine profile and taking into account also that the power is cut off
in the extremes of the element due the presence of the graphite as it is sketched in the Figure
B4. Although the above modelling procedure is approximated, it is used here to maintain
the actual axial and radial power distribution fixed.
Fig. B4. Prediction of the axial power distribution function in a TRIGA fuel element
BIII. Steady state results
The validation of a RELAP5 nodalization implicates that the model reproduces the
measured steady-state conditions of the system with acceptable margins. The nodalization
may be considered qualified when it has a geometric fidelity with the system, it reproduces
the measured steady-state condition of the system, and it demonstrates satisfactory time
evolution conditions. The RELAP5 steady state calculation has been performed at 50 and 100
kW. The temperature values at the inlet and outlet of the thermal hydraulic channels 3, 8
and 13 calculated using RELAP5 can be verified in the Tables B1 and B2, for 50 e 100 kW,
respectively. The calculated values were compared with the available experimental data
(inlet and outlet channel temperature). Chromel-alumel calibrated thermocouples were used
to collect the coolant temperature data and the measured values have a maximum error of
±1°C.
As it can be verified in the Table B1, considering operation at 50 kW, the results of the
RELAP5 code are in good agreement with the experimental data. The error obtained using
the RELAP5 calculation is into the range of the maximum acceptable error suggested for
coolant temperature (0.5 %) by the RELAP5 users.
Nuclear Power - System Simulations and Operation
38
Outlet Channel Temperature (K) Inlet Temperature (K)
TH
Channel
Experi-
mental
RELAP5 Error (%)*
Experi-
mental
RELAP5 Error (%)*
3 300.0 298.4 0.5 294.1 294.7 0.1
8 298.0 296.4 0.5 296.1 294.7 0.5
13 298.0 296.4 0.5 0.4 294.7 0.5
* error = 100 X (Calculation – Experimental)/Experimental
Table B1. Experimental and calculated results at 50 kW of power operation
Results performed at 100 kW of power operation are shown in Table B2. The error found for
RELAP5 calculation is a few overestimated in comparison with the error suggested for
coolant temperature (0.5 %) by the RELAP5 users. However, considering the error from the
experimental data (±1°C) the values predicted using RELAP5 are perfectly acceptable for the
present model validation process for operation power up to 100 kW.
Outlet Channel Temperature (K) Inlet Temperature (K)
TH
Channel
Experi-
mental
RELAP5 Error (%)*
Experi-
mental
RELAP5 Error (%)*
3 304.0 301.3 0.9 294.0 295.7 0.6
8 300.5 298.8 0.8 295.5 295.7 0.1
13 301.5 298.8 1.1 296.5 295.7 0.3
* error = 100 X (Calculation – Experimental)/Experimental
Table B2. Experimental and calculated results at 100 kW of power operation
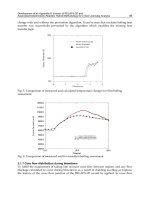
Figures B5 and B6 show the RELAP5 calculation for the inlet and outlet temperature for the
TH channel 1, at 50 and 100 kW of power, respectively. Such channel was chosen because it
concentrates the HS with higher values of radial power. As it can be verified, after about
2500 s of calculation, the temperatures reach steady-state condition. The temperature stable
values are in good agreement with the experimental available data.
BIV. Transient results
In spite of the IPR-R1 to be inherently safe, situations that can disturb the normal reactor
operation are possible to occur. The RELAP5 model presented in this work has
demonstrated to reproduce very well the steady-state conditions. Therefore, in addition to
the validation of the modelling process, a transient event was investigated using the code
and the results has been compared with available experimental data. The investigated event
is the forced recirculation off and may be caused by the recirculation pump failure, bringing
the reactor to operate in natural circulation conditions.
In the experiment, the reactor operated during about 2.5 hours with the forced cooling
system switched off and with an indication of 100 kW at the linear neutronic channel
(Mesquita et al., 2009). The measurements have demonstrated an average temperature-rise
rate of about 4.8°C/h. At inlet and outlet of a thermal hydraulic channel the temperature
values were verified to increase about 5.3 °C/h in both cases.
Safety Studies and General Simulations of Research Reactors Using Nuclear Codes
39
0 1000 2000 3000 4000 5000 6000 7000 8000 9000
290
292
294
296
298
300
302
304
306
308
310
312
314
outlet
inlet
Temperature (K)
Time (s)
Fig. B5. Inlet and outlet coolant temperature for the channel 1 at 50 kW predicted by the
RELAP5
0 1000 2000 3000 4000 5000 6000 7000 8000 9000
29 0
29 2
29 4
29 6
29 8
30 0
30 2
30 4
30 6
30 8
31 0
31 2
31 4
out let
inlet
Temperature (K)
Time (s )
Fig. B6. Inlet and outlet coolant temperature for the channel 1 at 100 kW predicted by the
RELAP5
To perform the simulation using the RELAP5, the valve in the primary system (number 600
in the nodalization) has been closed at 3000 s of calculation after the system to reach steady-
state condition. After the beginning of the transient, the temperatures increase as
consequence of no energy removal from the pool since the primary was off (see Figure B7).
After the beginning of the transient, the coolant temperature at inlet and outlet TH channel 1
increased gradually with rates of about 4.9°C/h and 4.6°C/h, respectively, demonstrating
very good agreement with the experimental available data.
The insertion of the cross flow model in the pool nodalization makes possible better removal
of heat from the core during natural circulation condition due improvement on the coolant
Nuclear Power - System Simulations and Operation
40
0 1000 2000 3000 4000 5000 6000 7000 8000 9000
290
292
294
296
298
300
302
304
306
308
310
312
314
Coolant outlet
Coolant inlet
Temperature (K)
Time (s)
Fig. B7. Inlet and outlet coolant temperature for the channel 1 at 100 kW predicted by the
RELAP5 after forced recirculation off at 3000 s
flow between the pool pipe volumes. Figure B8 illustrates the coolant temperature code
prediction considering the nodalization presented in this paper and that in the nodalization
without cross flow model, both at 100 kW of power operation. The curves show clearly that
the model using cross flow presents a temperature-rise rate (4.9°C/h) much more
approximated to the experimental (4.8°C/h) than that without cross flow model (30.0°C/h).
3000 3500 4000 4500 5000 5500 6000
280
290
300
310
320
330
340
350
360
100 kW
without cross flow model
100 kW
with cross flow model
Temperature (K)
Time (s)
Fig. B8. Forced recirculation off transient prediction using two types of pool nodalization
BV. Conclusion
Considering the three basic aspects necessary to qualify a nodalization for a system
(geometric fidelity, reproduction of the measured steady-state conditions and satisfactory
time evolution conditions), it is possible to conclude that the RELAP5 model presented in
Safety Studies and General Simulations of Research Reactors Using Nuclear Codes
41
this work was qualified to represent adequately the IPR-R1 TRIGA research reactor in
steady-state as well as in transient situations.
9. References
Antariksawan, A. R., Huda, M. Q., Liu, T., Zmitkova, J., Allison C. M., Hohorst, J. K. (2005).
Validation of RELAP/SCAPSIM/MOD3.4 for research reactor applications, In: 13th
International Conference on Nuclear Engineering, pp. 1–8, Beijing, China, May 16–20, 2005.
Costa, A. L., Reis, P. A. L., Pereira, C., Silva, C. A. M., Veloso, M. A. F., Mesquita, A. Z.
(2011). Simulation of the TRIGA IPR-R1 research reactor using the RELAP5-3D,
Proceedings of the European Research Reactor Conference 2011, pp. 1-5, Rome, Italy,
March 20-24, 2011.
Costa, A. L., Reis, P. A. L., Pereira, C., Veloso, M .A. F., Mesquita, A. Z., Soares, H. V. (2010).
Thermal hydraulic analysis of the IPR-R1 research reactor using a RELAP5 model.
Nuclear Engineering and Design, Vol. 240, pp. 1487–1494.
Dalle, H. M., Pereira, C., Souza, R. G. P. (2002). Neutronic calculation to the TRIGA Ipr-R1
reactor using the WIMSD4 and CITATION codes. Vol. 29, Annals of Nuclear Energy,
pp. 901–912.
D’Auria, F. and Galassi, G. M. (1998). Code validation and uncertainties in system
thermalhydraulics. Progress in Nuclear Energy, Vol. 33, pp.175-216.
D’Auria, F., Frogheri, M. and Giannoti, W. (1999). RELAP5/MOD3.2 Post test analysis and
accuracy quantification of lobi test BL-44. International Agreement Report,
NUREG/IA-0153.
D’Auria, F. (2004). Approach and methods to evaluate the uncertainty in system
thermalhydraulic calculations. In: Mecánica Computacional, G. Buscaglia, E. Dari, O.
Zamonsky (Eds.), Vol. XXIII, pp. 1411-1425, Bariloche, Argentina.
Fernandes, A. C., Santos, J. P., Marques, J. G., Kling, A., Ramos, A. R., Barradas, N. P. (2010).
Validation of the Monte Carlo model supporting core conversion of the Portuguese
Research Reactor (RPI) for neutron fluence rate determinations. Annals of Nuclear
Energy, Vol. 37, pp. 1139–1145.
Guerra, B. T., Silva, C. A. M., Oliveira, A. H., Pereira, C., Costa, A. L. (2011). Simulation of
the thermal neutron fluxes characterization in the irradiation channels of the IPR-
R1 TRIGA research reactor using Monte Carlo method, Proceedings of the European
Research Reactor Conference 2011, pp. 1-5, Rome, Italy, March 20-24, 2011.
Hainoun, A., Hicken, E., Wolters, J. (1996). Modelling of void formation in the subcooled
boiling regime in the ATHLET code to simulate flow instability or research
reactors. Nuclear Engineering and Design, Vol. 167, pp. 175-191.
Housiadas, C. (2002). Lumped parameters analysis of coupled kinetics and thermal-
hydraulics for small reactors. Annals of Nuclear Energy, Vol. 29, pp. 1315–1325.
Huda, M. Q. (2006). Computational analysis of Bangladesh 3 MW TRIGA research reactor
using MCNP4C, JENDL-3.3 and ENDF/B-Vl data libraries. Annals of Nuclear
Energy, Vol. 33, pp. 1072–1078.
IAEA (2009). Research Reactor Modernization and Refurbishment, IAEA-TECDOC-1625, Vienna,
Austria
IAEA (2008). Safety Analysis for Research Reactors. IAEA Safety Standards Series, Nº 55, IAEA,
Vienna, Austria.
IAEA (2005). Safety of Research Reactors, Safety Requirements. IAEA Safety Standards Series,
Nº NS-R-4. IAEA, Vienna, Austria.
Nuclear Power - System Simulations and Operation
42
Khan, L. A., Ahmad, N., Zafar, M. S., Ahmad, A. (2000). Reactor physics calculations and
their experimental validation for conversion and upgrading of a typical swimming
pool type research reactor. Vol. 27, Annals of Nuclear Energy, pp. 873 – 885.
Khedr, A., Adorni, M., D’Auria, F. (2005). The effect of code user and boundary conditions
on RELAP calculations of MTR research reactor transient scenarios. Nuclear
Technology & Radiation Protection, Vol. 1, pp. 16–22.
Marcum, W. R., Woods, B. G., Reese, S. R. (2010). Experimental and theoretical comparison of
fuel temperature and bulk coolant characteristics in the Oregon State TRIGA
®
reactor
during steady state operation. Nuclear Engineering and Design, Vol. 240, pp. 151-159.
Mesquita, A. Z., Rezende, H. C., Souza, R. M. G. P., 2009. Thermal power calibrations of the
IPR-R1 TRIGA nuclear reactor. Proceedings of the 20th International Congress of
Mechanical Engineering, COBEM 2009, November 15-20, Gramado, Brazil.
NEA - Nuclear Energy Agency (2009). Nuclear Fuel Behaviour in Loss-of-coolant Accident
(LOCA) Conditions, State-of-the-art Report, ISBN 978-92-64-99091-3, OECD 2009.
Papin, J., Petit, M., Grandjean, C., Georgenthum, V. (2006). IRSN R&D studies on high burn-
up fuel behaviour under RIA and LOCA conditions. Proceedings of Top Fuel 2006,
pp. 274-278, Salamanca, Spain, October 22-26, 2006.
Petruzzi, A. and D’Auria, F. (2008) Thermal-hydraulic system codes in nuclear reactor safety
and qualification procedures. Science and Technology of Nuclear Installations, Vol.
2008, doi:10.1155/2008/460795, pp. 1-16.
Reis, P. A. L., Costa, A. L., Pereira, C., Silva, C. A. M., Veloso, M. A. F., Mesquita, A. Z.
(2011). Sensitivity analysis of the RELAP5 nodalization to IPR-R1 TRIGA research
reactor, In: International Conference on Mathematics and Computational Methods Applied
to Nuclear Science and Engineering (M&C 2011), Rio de Janeiro, Brazil, May 8-12,
2011, ISBN 978-85-63688-00-2.
Reis, P. A. L., Costa, A. L., Pereira, C., Veloso, M. A. F., Mesquita, A. Z., Soares, H. V.,
Barros, G. P., (2010). Assessment of a RELAP5 model for the IPR-R1 TRIGA
research reactor. Annals of Nuclear Energy, Vol. 37, pp. 1341-1350.
Shoushtari, M. K., Kakavand, T., Ghaforian, H., Sadat Kiai, S. M. (2009). Preliminary scoping
study of some neutronic aspects of new shim safety rods for a typical 5MW
research reactor by Monte Carlo simulation. Nuclear Engineering and Design, Vol.
239, pp. 239–243.
Stamatelatos, I. E., Varvayanni, M., Tzika, F., Ale, A. B. F. Catsaros, N. (2007). Monte Carlo
simulation of the Greek Research Reactor neutron irradiation facilities. Nuclear
Instruments and Methods in Physics Research, Vol. 263, pp. 136–139.
Terremoto, L. A. A., Zeituni, C. A., Perrotta, J. A., da Silva J. E. R. (2000). Gamma-ray
spectroscopy on irradiated MTR fuel elements. Nuclear Instruments and Methods in
Physics Research A, Vol. 450, pp. 495–514.
Velit, C. G. and Primm, R. T. (2008). Partial safety analysis for a reduced uranium
enrichment core for the high flux isotope reactor, Joint International Workshop:
Nuclear Technology and Society – Needs for Next Generation, pp. 1-6, Berkeley,
California, January 6-8, 2008.
Verfondern, K., Nabielek, H., Kendall, J. M. (2007). Coated particle fuel for high temperature
gas cooled reactors. Nuclear Engineering and Technology, Vol. 39, pp. 603 – 616.
Woodruff, W. L., Hanan, N. A., Smith, R. S., Matos, J. E. (1996). A Comparison of the
PARET/ANL and RELAP5/MOD3 codes for the analysis of IAEA Benchmark
transients, Proceedings of the International Meeting on Reduced Enrichment for Research
and Test Reactors, pp. 1-11, Seoul, Republic of Korea, October 7-10, 1996.
3
Development of an Appendix K
Version of RELAP5-3D and
Associated Deterministic-Realistic Hybrid
Methodology for LOCA Licensing Analysis
Thomas K. S. Liang
Shanghai Jiao Tong University
China
1. Introduction
The Loss of Coolant Accident (LOCA) is one of the most important design basis accidents
(DBA). In light water reactors, particularly the pressurized water reactor (PWR), the severity
of a LOCA will limit how high the reactor power can operate. In the regulatory analysis
(USNRC, 1987), it was estimated that if the peak cladding temperature (PCT) during a
LOCA decreases by 100°F, it would be possible to raise the plant power by 10%. The
revision of 10 CFR50.46 in 1988 stated that two kinds of LOCA licensing approaches can be
accepted, namely the realistic and Appendix K methodologies. The realistic licensing
technique describes the behavior of the reactor system during a LOCA with best estimate
(BE) codes. However, the uncertainties of BELOCA analysis must be identified and assessed
so that the uncertainties in the calculated results can be estimated to a high confidence level.
Alternatively, the Appendix K approach will guarantee the conservatism of the calculation
results, instead of answering the analytical uncertainty. It is widely believed that the realistic
approach can more precisely calculate the sequences of a LOCA accident, and therefore
provides a greater margin for the PCT evaluation. The associated margin can be more than
200K (Westinghouse, 2009). However, the development of a realistic LOCA methodology is
long and costly, and the safety authority is highly demanding in their approach to evaluate
uncertainties. Instead, implementation of evaluation models required by Appendix K of 10
CFR 50 (USNRC, 1988) upon an advanced thermal–hydraulic platform, such as RELAP5-3D
(RELAP5-3D Code development Team, 1998), TRAC (Liles et al., 1981), CATHARE (Bestion,
1990) et al., also can gain significant margin in the PCT calculation. For instance, the PCT of
Taiwan’s Maanshan Nuclear Power Plant calculated by the latest Westinghouse Appendix K
Evaluation Model BASH (Westinghouse, 1987) is 445°F (2170°F→1725°F) lower than that of
1981´s calculation (Taipower Company, 1982).
To develop a new Appendix K LOCA licensing tool using the most advanced version of
RELAP5, namely RELAP5-3D, the compliance of the advanced RELAP5-3D code with
Appendix K of 10 CFR 50 has been evaluated, and it was found that there are nine areas
where code assessment and/or further modifications were required to satisfy the
requirements set forth in Appendix K of 10 CFR 50. All of the ten areas have been evaluated
Nuclear Power - System Simulations and Operation
44
and the RELAP5-3D has been successfully modified to fulfill the associated requirements. It
was also demonstrated that all the phases of both LBLOCA and SBLOCA can be covered in
RELAP5-3D/K.
To quantify uncertainty in BELOCA analysis, generally there are two categories of
uncertainties required to be identified and quantified, which involve model uncertainties
and plant status uncertainties. Particularly, it will take huge effort to systematically quantify
individual model uncertainty of a best estimate LOCA code. Instead of applying a full ranged
BELOCA methodology to cover both model and plant status uncertainties, a deterministic-
realistic hybrid methodology (DRHM) was also developed to support LOCA licensing
analysis with RELAP5-3D/K. Regarding the DRHM methodology, Appendix K deterministic
evaluation models are adopted to ensure model conservatism, while CSAU methodology
(Boyack, B., et al., 1989) is applied to quantify the effect of plant status uncertainty on PCT
calculation. Generally, DRHM methodology can generate about 80-100K (Liang, et al., 2011)
margin on PCT as compared to traditional Appendix K bounding state LOCA analysis.
2. Development and assessment of RELAP5-3D/K
To develop an Appendix K version of RELAP5-3D, the best-estimate version of RELAP5-3D
was modified and assessed (Liang et al., 2002) to fulfill requirements set forth in Appendix
K of 10CFR50. Nine build-in models in RELAP5-3D need to be modified and assessed (Schultz
et al., 1999), which include (1) Metal-Water Reaction Rate; (2) Discharge Model; (3) ECC
Bypass Model; (4) Critical Heat Flux During Blowdown; (5) Post–CHF Heat Transfer During
Blowdown; (6) Prevention from Returning to Nucleate Boiling and Transition Boiling Heat
Transfer Prior to Reflood; (7) Core Flow Distribution During Blowdown; (8) Reflood rate for
PWR; and (9) Refill and Reflood Heat Transfer for PWRs. Separate-effects experiments were
applied to assess specific code models and ensure that each modification can function
properly. The separate effects assessment cases for each modification are summarized in
Table 1.
Table 1. Matrix of Separate-effect assessments
Development of an Appendix K Version of RELAP5-3D and
Associated Deterministic-Realistic Hybrid Methodology for LOCA Licensing Analysis
45
2.1 Code modification and Separate-effect assessments
2.1.1 Metal-water reaction rate
Since melting of fuel cladding is not the applicable domain, the parabolic rate low from the
Baker-Just model (Baker et al., 1962) would be applied to calculate the fuel oxidation from
zirconium-water reaction. Once the oxidation thickness has been evaluated, the associated
amount of reaction heat added to the cladding and hydrogen generation also would be
calculated. The Cathcart data (Cathcart, 1977) was used to assess the implementation of the
Baker-Just models into RELAP5-3D. Cathcart measured the isothermal reaction rates of
Zircaloy-4 tubes in steam at elevated temperatures. After the specified oxidation time, the
tube was removed and the oxide thickness was measured using standard metallographic
techniques. Typical assessment calculation is shown in Figure 1. It can be seen that at a
higher bath temperature (1500°C), the conservatism of the Baker-Just model is very clear.
5 10152025303540455055
Oxidation time (s)
20
30
40
50
60
70
80
90
100
110
Oxidation thickness(10
-6
m)
Temperature=1504
o
C
Cathcart experiments
Carthcart model
Baker-Just model
Up bound
Low bound
Fig. 1. Oxidation thickness of zirconium 4 (temperature 1504°C)
2.1.2 Discharge model
The Moody model (Moody, 1965) for the calculation of two phase choked flow and the
Henry Fauske model (Fauske et al., 1971)for the single phase liquid choked flow were added
to RELAP5-3D to make a break flow evaluation model. Regarding applying the Moody
model, the stagnation conditions (p
o
, h
o
) need to be derived from the cell center immediately
upstream of the exit plane. The stagnation enthalpy can be calculated from the cell center
properties as:
22
0
()(1)()
22
fg
fg
vv
hh xh x=+ −++
(1)
Nuclear Power - System Simulations and Operation
46
where the local enthalpies, fluid velocities and flow quality are evaluated at the equilibrium
condition at the cell center. By assuming an isentropic process, the stagnation pressure can
then be obtained from the local entropy defined by the cell center properties and the
stagnation enthalpy through steam table iteration:
(
)
,(, )
ooo
PPhshP= (2)
Data from Marviken Test 22 (Erickson et al., 1977) was used to assess the implementation of
the Moody model. Marviken Test 22 was a full-scale critical flow test. The break was
connected to the bottom of a large pressure vessel. The pressure vessel, which was originally
part of the Marviken Nuclear Power Station in Sweden, was 5.2 meters in diameter and 24.6
meters tall. The vessel initially contained regions of subcooled liquid, saturated liquid and a
steam dome. The assessment calculations against measured break flow are shown in Figure
2. The conservatism of the Moody model in two-phase choked flow was demonstrated.
0204060
Time (s)
0
4000
8000
12000
16000
Flow
R
ate (kg/s)
Test Data
RELAP5-3D/K
mar-bf_rpt_steam.grf
Fig. 2. Comparison of measured and calculated break flow
2.1.3 ECC bypass model
During the ECC bypass period, the emergency coolant would be held in the upper
downcomer region. Those ECC water would accumulate in the inlet lines, and then leave
RCS through the break without taking decay heat from the reactor core, until the vapor flow
from the core can no longer sustain the water in the downcomer. The downcomer flooding
model derived from the UPTF full-scale test (Siemens, 1988) was applied to determine when
the ECC water could penetrate the downcomer through the RELAP5-3D regular CCFL input
process. The UPTF downcomer flooding model is:
*1/2 *1/2
2.193 0.6208
g
f
jj+= (3)
Development of an Appendix K Version of RELAP5-3D and
Associated Deterministic-Realistic Hybrid Methodology for LOCA Licensing Analysis
47
According to the requirement, before the end of the bypass period all the injected ECC water
needs to be removed from the system. To fulfill the ECC subtraction requirement, a set of
time dependent junction and volume (TMDPJUN, TMDPVOL) would be connected to the
cold leg of the broken loop close to the downcomer. Equal amount of injected ECC water
will be forced to be on-line removed from the reactor system by this artificial set of
TMDPJUN and TMDPVOL before the end of ECC bypass. The boron transport calculation
of RELAP5-3D can indicate when the end of ECC bypass takes place. This boron model will
trace the transport of the borated ECC water. Once the borated ECC water penetrates the
downcomer and reaches the lower plenum, a signal of the end of ECC bypass will be
generated and the ECC subtraction scheme via the TMDPJUN and TMDPVOL will be
automatically terminated. The comparison of actual injected ECC water in the LOFT L2-5
(Davis, 1998) and the one calculated by the Appendix K model is shown in Figure 3.
0 102030
TIME (sec)
0
200
400
600
Accumulated ECC Mass In RCS (kg)
Injected ECC Flow
Extracted Flow
Effective Injected Flow
End of ECC Bypass
Fig. 3. Comparison of measured and calculated ECC water
2.1.4 Critical heat flux during blowdown
The set of three Appendix K CHF correlations used in RELAP4/MOD7 (Behling et al., 1981)
would be adopted, which includes B&W-2, Barnett and Hughes (modified Barnett)
correlations, to cover the pressure range of interest. For the high-pressure range (P>10.34
MPa), B&W-2 was applied; for the medium pressure range (8.96 MPa>P>6.89MPa), Barnett
correlation was applied; for the low-pressure range (P < 5 MPa), the modified Branett was
adopted. For pressures between ranges, interpolation by pressure was applied to calculate
the correspond CHF:
() ()
LH
HCHF LCHF
CHF
HL
PPq PPq
q
PP
−+−
=
−
(4)
where index H and L represent the high and low ends of the interpolation range. Rod
bundle heat transfer tests (Yoder et al., 1982)
performed in the Thermal-Hydraulic Test
Facility (THTF) at Oak Ridge National Laboratory (ORNL) were used to assess the CHF
model and film boiling heat transfer. These tests were performed using an 8 ×8 fuel bundle.
The rod geometry was representative of 17 ×17 fuel bundles, and the full-length bundle was
electrically heated and had uniform axial and radial profiles. Three tests were used for
Nuclear Power - System Simulations and Operation
48
assessment the CHF calculation, which include tests 3.07.9B, 3.07.9N and 3.07.9W. The range
of conditions during this test was representative of those expected during a large break
LOCA. A typical comparison of the location first experiencing CHF is shown in Figure 4. It
can be seen that the CHF location predicted by the EM models was conservatively lower.
Fig. 4. Comparison of measured and calculated surface temperatures for THTF-307.9B test
2.1.5 Post-CHF heat transfer during blowdown
Two correlations suggested by Appendix K of 10 CFR 50 were adopted to calculate film
boiling and transition boiling heat transfer. For the stable film boiling, Groeneveld 5.7 was
applied, while the McDonough-Milich-King correlation was used for transition boiling heat
transfer. Once CHF has occurred, the greater heat flux would be applied which were
calculated by either the film boiling or transition boiling correlations. As stated in Appendix
K, the Groeneveld correlation shall not be used in the region near its low-pressure
singularity. As suggested by INEEL (Schultz et al., 1999), for high flow (
*1/2 *1/2
1.36
g
f
jj+>
for up flow,
*1/2 *1/2
3.5
g
f
jj+>for downflow) if pressure is less than 1.38 MPa, the modified
Dittus-Boelter correlation can be used to replace the Groeneveld correlation. If the core flow
is not high, the modified Bromley correlation by Hsu with convection can be used to correct
the low-pressure singularity. Typical assessments against THTF tests for film boiling heat
transfer of the EM model are shown in Figure 5. As for the assessment of transition boiling
heat transfer, THTF transition test with power ramping (THTF-303.6AR) was adopted. A
typical comparison is shown in Figure 6.
2.1.6 Prevention from returning to nucleate boiling and transition boiling
As required by Appendix K, during the blowdown phase once CHF occurs, transition
boiling and nucleate boiling heat transfer shall not be reapplied for the remainder of the
LOCA blowdown, unless the reflood phase of the transition has been entered. Assessment
of the artificial prevention algorithm is shown in Figure 7. This figure depicts the mode