Aeronautics and Astronautics Part 4 potx
Bạn đang xem bản rút gọn của tài liệu. Xem và tải ngay bản đầy đủ của tài liệu tại đây (858.31 KB, 40 trang )
Numerical Investigation of Plasma Flows Inside Segmented Constrictor Type Arc-Heater
109
mass flow rate, kg/s
voltage, V
0 0.1 0.2 0.3 0.4 0.5
0
2000
4000
6000
8000
Experiments
ARCFLO4
AHF arc heater, I=2000A
mass flow rate, kg/s
mass averaged enthalpy, MJ/kg
0 0.1 0.2 0.3 0.4 0.5
0
5
10
15
20
25
30
35
Experiments
ARCFLO4
AHF arc heater, I=2000A
(a) Voltage (b) Mass-Averaged Enthalpy
mass flow rate, kg/s
pressure, atm
0 0.1 0.2 0.3 0.4 0.5
0
2
4
6
8
10
12
14
Experiments
ARCFLO4
AHF arc heater, I=2000A
mass flow rate, kg/s
efficiency
00.10.20.30.40.5
0
0.2
0.4
0.6
0.8
1
Experiments
ARCFLO4
AHF arc heater, I=2000A
(c) Pressure (d) Efficiency
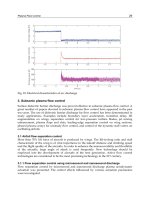
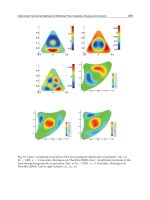
Fig. 6. Comparison between Calculation and Experiment
Figure 6 shows the results for I = 2000 A. As shown in the figure, the overall results show a
tendency similar to the case of I = 1600 A and are in good agreement with the experimental
results. Considering the results described in Sections 3.1.1 and 3.1.2, we can say that the
ARCFLO4 code predicted the arc heater flow accurately for high electric power cases.
3.1.3 JAXA 750KW arc heater
The Japan Aerospace Exploration Agency (JAXA) has serviced a 750 kW segmented arc
heater since the 1990s, and its operational data are available through the references of
Aeronautics and Astronautics
110
Matsuzaki et al. (2002) and Sakai et al. (2007). The JAXA 750 kW segmented arc heater
operates at a current between 300 and 700 A and a mass flow rate between 10 and 20 g/s.
The constrictor length and diameter are 39 cm and 2.54 cm, respectively. The diameter of the
nozzle throat is 2.5 cm. The diameter and the radius of the electrode is 7.6 cm and 1.9 cm,
respectively. In this section, a numerical flow calculation of the JAXA 750 kW arc heater is
introduced as a low electric power case. The voltage between electrodes, the mass-averaged
enthalpy at the nozzle throat, the pressure in the cathode chamber, and the arc heater
efficiency are calculated and compared to the experimental data.
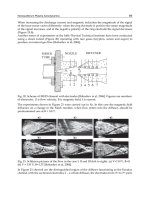
(a) Voltage (b) Mass-Averaged Enthalpy
(c) Pressure (d) Efficiency
Fig. 7. Comparison between Calculation and Experiment (Lee & Kim, 2010)
Mass flow rate, g/s
Efficiency
10 12 14 16 18 20
0.3
0.4
0.5
0.6
0.7
0.8
Experiments, I=300A
Experiments, I=500A
Experiments, I=700A
ARCFLO4, I=300A
ARCFLO4, I=500A
ARCFLO4, I=700A
JAXA 750 kW Segmented Arc Heater
Mass flow rate, g/s
Pressure, atm
10 12 14 16 18 20
0.4
0.6
0.8
1
1.2
1.4
Experiments, I=300A
Experiments, I=500A
Experiments, I=700A
ARCFLO4, I=300A
ARCFLO4, I=500A
ARCFLO4, I=700A
JAXA 750 kW Segmented Arc Heater
Mass flow rate, g/s
Mass averaged enthlapy, MJ/kg
10 12 14 16 18 20
0
5
10
15
20
25
30
35
Experiments, I=300A
Experiments, I=500A
Experiments, I=700A
ARCFLO4, I=300A
ARCFLO4, I=500A
ARCFLO4, I=700A
JAXA 750 kW Segmented Arc Heater
Mass flow rate, g/s
Voltage, V
10 12 14 16 18 20
400
600
800
1000
1200
1400
1600
1800
Experiments, I=300A
Experiments, I=500A
Experiments, I=700A
ARCFLO4, I=300A
ARCFLO4, I=500A
ARCFLO4, I=700A
JAXA 750 kW Segmented Arc Heater
Numerical Investigation of Plasma Flows Inside Segmented Constrictor Type Arc-Heater
111
Figure 7 shows a comparison of the operational data plotted in terms of mass flow rates. As
shown in the figure, the computed operational data are in good agreement with the
experimental data. Thus, it is confirmed that the ARCFLO4 simulation of low electric power
segmented arc heater flows is valid.
3.1.4 150KW arc heater
A 150 kW arc heater in Korea was analyzed in order to validate ARCFLO4 for a lower
electric power regime. This arc heater is basically a Hules-type heater. However, to stabilize
the arc, the constrictor is located at the center of the heater. The details of the configurations
are shown in Fig. 8, and the test cases for present analysis are given in Table 1.
Fig. 8. Computational Grid
Current(Amphere) Mass flow rate(g/s)
CASE1 363 11.78
CASE2 393.3 10.11
CASE3 383 9.08
CASE4 374.4 7.53
Table 1. Test Cases
Generally, radiant heat flux is mainly generated at the constrictor and has almost zero value
at the cathode and anode for the case of a long constrictor. Therefore, the ARCFLO4 code
calculates the radiant flux using the assumption of long cylindrical coordinates. However,
this 150 kW arc heater has a relatively short constrictor length, so the assumption is not
valid. Considering the short length of the constrictor, the calculation of radiant flux was
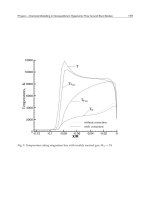
slightly corrected using a configuration factor, as shown in Fig. 10. The details of the
correction are available in Han et al., 2011.
1100 4325 7550 10775 14000
temperature[K]:
Fig. 9. Correction of Radianit Heat Flux Using Configuration Factor (Han et al., 2011)
Aeronautics and Astronautics
112
Table 2 shows a comparison of the ARCFLO4 numerical results and the experimental
results. The table shows that the calculated voltage and pressure are in very good agreement
with the experimental data. That is, ARCFLO4 showed good accuracy again for the flow
inside the low electric power arc heater.
Pressure(atm) Voltage(volt)
Cal. Exp. Error Cal. Exp. Error
Case1 6.25 6.33 1.3% 385 392 2.8%
Case2 5.62 5.60 0.35% 345 344 0.3%
Case3 5.05 4.93 2.4% 328 320 2.5%
Case4 4.41 4.56 3.1% 325 335 2.8%
Table 2. Comparisons between Calculations and Experiments (Han et al., 2011)
Considering the results described in Sections 3.1.1 to Sec. 3.1.4, the ARCFLO4 code
predicted the flow inside the arc heater accurately for a wide range of electric power (150
kW to 60 MW). It is also confirmed that the turbulence model used in ARCFLO4 reflected
the convection physics of turbulence properly near the wall region.
4. CFD code as a design tool of the arc heater
The NASA Ames Research Center developed a segmented arc heater in the 1960s. Currently,
NASA Ames has three segmented arc heater facilities: the 20 MW Aerodynamic Heating
Facility, the 20 MW Panel Test Facility, and the 60 MW Interactive Heating Facility
(Terrazas-Salinas and Cornelison, 1999). In the 1990s, Europe and Japan began to develop
segmented arc heaters. In Europe, a 6 MW segmented arc heater was developed and
operated with an L3K arc heated facility of the German Aerospace Center (Smith et al.,
1996). Recently, 70 MW segmented arc heater was added to the SCIROCCO arc heated
facility of the Italian Aerospace Research Center (Russo, 1993). Japan has serviced the 750
kW segmented arc heater since the 1990s. Despite these arc heater development experiences,
a design process has been accomplished by only a few research centers and companies. In
the development stage, there was probably considerable trial and error since the flow
phenomena inside segmented arc heaters had not been characterized. Also, the higher cost
would have been spent during the development of the segmented arc heater. In an effort to
reduce the difficulties and cost during arc heater development, Lee et al. (2007, 2008)
recently developed the ARCFLO4 computational code to study the flow physics in
segmented arc heaters. As described in Section.3, the code accurately simulated existing arc
heaters under various operating conditions. It predicted well the operational data of the
AHF, IHF (Lee et al., 2007, 2008) and JAXA 750 kW arc heater (Lee & Kim, 2010). Since
ARCFLO4 can accurately predict operational data and the wall heat energy loss,
development costs can be reduced without previous design experience.
In this section, the effects of configuration and input operational conditions on the
performance of an arc heater are investigated in order to provide fundamental data for the
design of segmented arc heaters. A parametric study is performed to determine the main
design variables that strongly affect arc heater performance. First, performance changes in
terms of constrictor length, constrictor diameter, and nozzle throat diameter are investigated.
Then, performance changes due different input currents and mass flow rates are examined.
Numerical Investigation of Plasma Flows Inside Segmented Constrictor Type Arc-Heater
113
4.1 Parametric study
The relationship between performance and main design parameters, such as configuration
and input operational conditions is investigated. The 750 kW JAXA segmented arc heater is
chosen as a baseline model. To study the effect of configuration on arc heater flows, a
constrictor length, a constrictor diameter, and a nozzle throat diameter are changed. Then,
the input current and mass flow rate are changed to determine the effect of input
operational conditions on arc heater flows.
4.1.1 Length of the constrictor
Generally, the arc length inside a segmented arc heater is similar to the constrictor length.
Thus, the constrictor length is one of the key factors that affects arc heater flows. In this
section, a parametric study according to the various constrictor lengths is described. The
constrictor length varies from 10 to 100 cm with other parameters are fixed for comparison.
In order to maintain an input electric power lower than 1 MW, a current of 300 A and a mass
flow rate of 10 g/s were selected. The nozzle throat diameter is 1.5 cm. Figure 10 shows
(a) Voltage & Power (b) Mass-Averaged Enthalpy
(c) Pressure (d) Efficiency
Fig. 10. Operational Data (Lee & Kim, 2010)
Length of constrictor, cm
Efficiency
20 40 60 80 100
0
0.2
0.4
0.6
0.8
1
Current = 300 A
Mass flow rate = 10 g/s
Diameter of nozzle throat = 1.5 cm
D=2.0cm
D=1.0cm
D=1.5cm
D=2.5cm
L/D=40
L/D=10
L/D=20
L/D=30
Length of constrictor, cm
Pressure, atm
20 40 60 80 100
1
1.2
1.4
1.6
1.8
2
D=1.0cm
D=1.5cm
D=2.0cm
D=2.5cm
Current = 300 A
Mass flow rate = 10 g/s
Diameter of nozzle throat = 1.5 cm
D=Diameter of constrictor
Length of constrictor, cm
Mass averaged enthalpy, MJ/kg
20 40 60 80 100
10
11
12
13
14
15
16
Current = 300 A
Mass flow rate = 10 g/s
Diameter of nozzle throat = 1.5 cm
D=2.5cm
L/D=40
D=1.5cm
D=2.0cm
D=1.0cm
L/D=10
L/D=20
L/D=30
Length of constrictor, cm
Voltage, V
Power, MW
20 40 60 80 100
500
1000
1500
2000
2500
0.2
0.3
0.4
0.5
0.6
0.7
Current = 300 A
Mass flow rate = 10 g/s
Diameter of nozzle throat = 1.5 cm
L/D=40
D=1.0cm
D=1.5cm
D=2.0cm
D=2.5cm
L/D=10
L/D=20
L/D=30
Aeronautics and Astronautics
114
operational data in terms of a constrictor length at specific constrictor diameters. As shown
in Fig. 10a, the voltage and the electric power are increased proportionally to the constrictor
length. On the other hand, as shown in Figs. 10b and 10c, the effects of constrictor length on
the mass-averaged enthalpy and the cathode chamber pressure are relatively small. It is
shown that the efficiency decreases as the constrictor length increases. In general, the
efficiency is strongly related to the amount of heat energy loss at the arc heater wall. The
heat energy loss per unit length increases and the electric power input per unit length
decreases, by increasing the constrictor length. Therefore, the longer the constrictor length,
the lower the total efficiency becomes.
4.1.2 Diameter of the constrictor
The effects of the constrictor diameters are also investigated. The constrictor diameters vary
from 1.0 to 6.0 cm, while other configurations are fixed. The nozzle throat diameter is 1.5 cm.
The current and mass flow rate are also fixed at 300 A and 10 g/s, respectively. Figure 11
(a) Voltage & Power (b) Mass-Averaged Enthalpy
(c) Pressure (d) Efficiency
Fig. 11. Operational Data (Lee & Kim, 2010)
Diameter of constrictor, cm
Efficiency
123456
0
0.2
0.4
0.6
0.8
1
L=40cm
L=60cm
L=80cm
Current = 300 A
Mass flow rate = 10 g/s
Diameter of nozzle throat = 1.5 cm
Diameter of constrictor, cm
Pressure, atm
123456
1
1.2
1.4
1.6
1.8
2
L=40cm
L=60cm
L=80cm
Current = 300 A
Mass flow rate = 10 g/s
Diameter of nozzle throat = 1.5 cm
Diameter of constrictor, cm
Mass averaged enthalpy, MJ/kg
123456
8
10
12
14
16
18
20
L=40cm
L=60cm
L=80cm
Current = 300
A
Mass flow rate = 10 g/s
Diameter of nozzle throat = 1.5 cm
Diameter of constrictor, cm
Voltage, V
Power, MW
123456
0
500
1000
1500
2000
2500
0
0.1
0.2
0.3
0.4
0.5
0.6
0.7
L=40 cm
L=60 cm
L=80 cm
Current = 300
A
Mass flow rate = 10 g/s
Diameter of nozzle throat = 1.5 cm
Numerical Investigation of Plasma Flows Inside Segmented Constrictor Type Arc-Heater
115
shows operational data in terms of constrictor diameter. As shown in the figure, the voltage,
mass-averaged enthalpy, and efficiency are strongly affected by the constrictor diameter. As
shown in Fig. 11a, the voltage and the electric power increase as the constrictor diameter
decreases. For the mass-averaged enthalpy, the effect of the constrictor diameter is greater
than that of the constrictor length, as shown in Figs. 10b and 11b. In Fig. 11c, we note that
the cathode chamber pressure is weakly affected by the constrictor diameter. Finally, Fig.
11d shows that the efficiency decreases as the constrictor diameter decreases.
To understand the change in efficiency, we consider the heat energy loss on the arc heater
wall as illustrated in Fig. 12. In the figure, as the constrictor diameter decreases, both the
conductive and radiant energy losses increase, and thus the efficiency decreases. Generally,
if a constrictor diameter decreases, the quantity of injecting working gas per unit area
increases. Thus, the axial speed of the working gas increases, and thus a viscous dissipation
phenomenon due to turbulence is strongly generated near the wall. Therefore, the heat
energy loss by thermal conduction increases as the constrictor diameter decreases.
Moreover, the distance from the core to the wall is small; thus, only a small amount of
radiation is absorbed by the surrounding gas on its way to the wall.
Fig. 12. Heat Flux (Lee & Kim, 2010)
The effect of the ratio of constrictor length to constrictor diameter, L/D, on the stability of an
arc discharge is investigated. Figure 13 shows the temperature distribution in the radial
direction. In the figure, we can define a region where the temperature is greater than 9,000 K
and the current density is high, as an arc column. It is shown that the thickness of the arc
column is large at the upstream region of the constrictor where L/D is greater than 30. Also,
x, cm
Heat flux, kW/cm
2
0 10203040
0
0.5
1
1.5
2
2.5
D=1.00 cm, L/D=40
D=1.33 cm, L/D=30
D=2.00 cm, L/D=20
D=4.00 cm, L/D=10
Current=300 A
Mass flow rate=10 g/s
Constrictor length L=40 cm
Radiant heat flux
Conductive heat flux
Aeronautics and Astronautics
116
the arc column broadens as L/D increases. If an arc column broadens, there is not enough
room for the arc column to fluctuate and the stability of an arc discharge improves.
Generally, it is known that L/D should be greater than 30 to stabilize an arc discharge (Sakai
et al., 2007).
Fig. 13. Temperature (Lee & Kim, 2010)
4.1.3 Diameter of nozzle throat
To investigate the effect of nozzle throat diameter on the arc heater flow, the nozzle throat
diameter is chosen to vary from 1.0 to 2.0cm, while other parameters are fixed. The length
and the diameter of the constrictor are 60.0 cm and 2.0 cm, respectively. Figure 14 shows
operational data in terms of the nozzle throat diameter. As shown in the figure, the nozzle
throat diameter does not affect operational data, such as electric voltage, mass averaged
enthalpy, and efficiency. However, the chamber pressure is strongly affected by the nozzle
throat diameter since the pressure is inversely proportional to nozzle area for a fixed mass
flow rate. The pressure decreases as the nozzle throat diameter increase.
4.1.4 Input current
When designing a segmented arc heater, a range of input currents must be determined as
well as arc heater configurations. In this section, the effects of the input current on arc heater
flow are investigated. The input current is defined to vary from 100 to 900 A. The length and
the diameter of the constrictor are 60.0 cm and 2.0 cm, respectively. The diameter of the
nozzle throat is 1.5 cm.
y/R
Temperature, K
0 0.2 0.4 0.6 0.8 1
2000
4000
6000
8000
10000
12000
14000
D=1.00 cm, L/D=40
D=1.33 cm, L/D=30
D=2.00 cm, L/D=20
D=4.00 cm, L/D=10
Current=300 A
Mass flow rate=10 g/s
Constrictor length D=40 cm
Position x=6 cm
Numerical Investigation of Plasma Flows Inside Segmented Constrictor Type Arc-Heater
117
(a) Voltage & Power (b) Mass-Averaged Enthalpy
(c) Pressure (d) Efficiency
Fig. 14. Operational Data (Lee & Kim, 2010)
Figure 15 shows operational data in terms of input current at the following mass flow rates:
10, 15, and 20 g/s. Figure 15a shows that the electric power is almost proportional to the
input current, while the voltage decreases as the input current increases. The reason is that
constrictor length dominantly determines the voltage value. Accordingly, the mass-
averaged enthalpy and pressure increase under the condition of constant mass flow rate, as
shown in Figs. 15b and c. Efficiency decreases as the input current increases.
Diameter of nozzle throat, cm
Efficiency
1.0 1.2 1.4 1.6 1.8 2.0
0
0.2
0.4
0.6
0.8
1
Current=300 A
Mass flow rate=10 g/s
Constrictor length L=60 cm
Constrictor diameter D=2.0 cm
Diameter of nozzle throat, cm
Pressure, atm
1.0 1.2 1.4 1.6 1.8 2.0
0
1
2
3
4
Current=300 A
Mass flow rate=10 g/s
Constrictor length L=60 cm
Constrictor diameter D=2.0 cm
Diameter of nozzle throat, cm
Mass averaged enthalpy, MJ/kg
1.0 1.2 1.4 1.6 1.8 2.0
0
5
10
15
20
25
Current=3 00 A
Mass flow rate=10 g/s
Constrictor length L=60 cm
Constrictor diameter D=2.0 cm
Diameter of nozzle throat, cm
Voltage, V
Power, MW
1.0 1.2 1.4 1.6 1.8 2.0
0
500
1000
1500
2000
0
0.1
0.2
0.3
0.4
0.5
0.6
Current=300 A
Mass flow rate=10 g/s
Constrictor length L=60 cm
Constrictor diameter D=2.0 cm
Aeronautics and Astronautics
118
(a) Voltage & Power (b) Mass-Averaged Enthalpy
(c) Pressure (d) Efficiency
Fig. 15. Operational Data (Lee & Kim, 2010)
Efficiency is strongly related to temperature distribution. As the input current increases, the
core temperature increases and the arc column broadens. Generally, if the current increases,
the temperature increases due to high Joule heating. On the other hand, strong radiation
prohibits the core temperature from increasing. Instead, it makes the temperature
distribution to be flat at the core region and arc column broader, which leads to enhanced
radiation throughout the wall. Also, the temperature gradient near the wall increases, which
increases the heat energy loss by thermal conduction. As a consequence, efficiency decreases
due to high heat energy loss caused by radiation and thermal conduction.
Current, A
Efficiency
100 200 300 400 500 600 700 800 900
0
0.2
0.4
0.6
0.8
1
Mass flow rate=10 g/s
Mass flow rate=15 g/s
Mass flow rate=20 g/s
Current, A
Pressure, atm
100 200 300 400 500 600 700 800 900
0
0.5
1
1.5
2
2.5
3
3.5
4
Mass flow rate=10 g/s
Mass flow rate=15 g/s
Mass flow rate=20 g/s
Current, A
Mass averaged enthalpy, MJ/kg
100 200 300 400 500 600 700 800 900
0
5
10
15
20
25
30
Mass flow rate=10 g/s
Mass flow rate=15 g/s
Mass flow rate=20 g/s
Current, A
Voltage, V
Power, MW
100 200 300 400 500 600 700 800 900
0
500
1000
1500
2000
2500
3000
3500
0
0.2
0.4
0.6
0.8
1
1.2
1.4
Mass flow rate=10 g/s
Mass flow rate=15 g/s
Mass flow rate=20 g/s
Power
Voltage
Numerical Investigation of Plasma Flows Inside Segmented Constrictor Type Arc-Heater
119
4.1.5 Mass flow rate
A parametric study according to a mass flow rate is performed. The mass flow rate changes
from 5 to 30 g/s. The length and diameter of the constrictor are 60.0 cm and 2.0 cm,
respectively. The diameter of the nozzle throat is 1.5 cm. Figure 16 shows operational data in
terms of the mass flow rate for three input currents: 300, 500, and 700 A. Figure 16a shows
that the voltage and the electric power increase as the mass flow rate increases. This is
(a) Voltage & Power (b) Mass-Averaged Enthalpy
(c) Pressure (d) Efficiency
Fig. 16. Operational Data (Lee & Kim, 2010)
Mass flow rate, g/s
Efficiency
5 1015202530
0
0.2
0.4
0.6
0.8
1
Current=300 A
Current=500 A
Current=700 A
Mass flow rate, g/s
Pressure, atm
5 1015202530
0
1
2
3
4
5
Current=300 A
Current=500 A
Current=700 A
Mass flow rate, g/s
Mass averaged enthalpy, MJ/kg
5 1015202530
0
5
10
15
20
25
30
Current=300 A
Current=500 A
Current=700 A
Mass flow rate, g/s
Voltage, V
Power, MW
5 1015202530
0
500
1000
1500
2000
2500
3000
0
0.5
1
1.5
2
2.5
3
Current=300 A
Current=500 A
Current=700 A
Power
Voltage
Aeronautics and Astronautics
120
because that the ionization rate decreases due to the high mass flow rate inside the arc
column. As shown in Fig. 16b, the mass-averaged enthalpy decreases as the mass flow rate
increases. On the other hand, in Fig. 16c, the cathode chamber pressure increases as the mass
flow rate increases. In addition, efficiency increases as the mass flow rate increases. Figure
17 shows the temperature distribution along the radial direction at the middle cross section,
which is 30 cm from the constrictor starting point. As shown in the figure, the core
temperature decreases and the arc column becomes narrower as the mass flow rate
increases. This temperature distribution makes the voltage higher and reduces the energy
loss due to radiation, as shown in Fig. 18. On the other hand, viscous dissipation by
turbulence occurs noticeably near the wall due to the high mass flow rate and high axial
speed of the working gas. Hence, both the temperature gradient near the wall and the heat
energy loss due to thermal conduction increase, as shown in the Fig. 18. Consequently, the
more the mass flow rate increases, the higher the total energy loss becomes. However, as a
result, the efficiency increases slowly along with the increase in mass flow rate because the
total heat energy loss increases more slowly than the total electric power input.The mass
flow rate also has an influence on the stability of arc discharge. Figure 17 shows that the arc
column becomes narrower with increased mass flow rate. That is, the stability of the arc
discharge becomes worse as the mass flow rate increases. In a real design process, the
maximum value of the mass flow rate should be determined considering the stability of the
arc discharge for a given arc heater configuration.
Fig. 17. Temperature (Lee & Kim, 2010)
y, cm
Temperature, K
0 0.2 0.4 0.6 0.8 1
0
2000
4000
6000
8000
10000
12000
14000
Mass flow rate=10g/s
Mass flow rate=15g/s
Mass flow rate=20g/s
Current=300 A
Constrictor length L=60 cm
Constrictor diameter D=2.0 cm
Nozzle thorat diameter D
t
=1.5 cm
Position x=30 cm
Numerical Investigation of Plasma Flows Inside Segmented Constrictor Type Arc-Heater
121
Fig. 18. Heat Flux (Lee & Kim, 2010)
4.2 Design of a segmented arc heater
In Section 3, the numerical code, ARCFLO4, is validated using the real operating data of the
arc heater. In Section 4.1, a parametric study is performed for the various design parameters
of the arc heater. Since the accuracy of the numerical results is rigorously proven, the
database obtained by the parametric study is quite reliable. Therefore, it is expected that the
database can be used in arc heater design processes. If target parameters such as total
pressure and total enthalpy are given, the configuration and operational conditions such as
the size of the constrictor and the nozzle throat, and the range of the input current and the
mass flow rate, can be directly determined through the database based on the parametric
study. Moreover, in the design of a cooling system, the database can be effectively used
since the CFD code predicts the wall heat flux value quite well, i.e., if the heat flux value on
the arc heater is known, the size of the cooling system and pipe configuration can be
determined directly.
5. Conclusion
The accuracy level of current CFD analysis on arc heater flows is introduced. It is shown
that current state-of-the art CFD technologies can predict the plasma flow inside the arc
heater well. Both the high input power cases (60MW, 20MW) and the low input power cases
(750kW, 150kW) are validated successfully using the ARCFLO4 computational code. The k-ε
turbulence model combined with the 3-band radiation model provides good solutions for
arc heater flows. Moreover, the possibility of the present computational code as a design
tool for arc heater is introduced. A parametric study is performed to investigate the relation
between arc heater performance and the design parameters. In the case of constrictor length,
x, cm
Heat flux, kW/cm
2
0 102030405060
0
0.1
0.2
0.3
0.4
0.5
0.6
0.7
0.8
0.9
1
Mass flow rate=10g/s
Mass flow rate=15g/s
Mass flow rate=20g/s
Mass flow rate=300 A
Constrictor length L=60 cm
Constrictor diameter D=2.0 cm
Nozzle thorat diameter D
t
=1.5 cm
Thermal conduction
Radiation
Aeronautics and Astronautics
122
as the constrictor length increases, the voltage and electrical power increase while the
efficiency decreases. It is also shown that the voltage, the mass-averaged enthalpy, and the
efficiency are strongly affected by the constrictor diameter. The mass-averaged enthalpy
seems to be affected more by the constrictor diameter than by the constrictor length. From
the view point of arc stability, as the L/D ratio increases, the arc column broadens, which
means that the stability of the arc improves. Based on a parametric study of the nozzle
throat diameter, it is determined that the nozzle throat diameter strongly affects the
pressure. The effects of input operational conditions such as input current and mass flow
rate are also discussed. It appears that the electric power increases as the input current and
the mass flow rate increase. Moreover, arc stability becomes worse as the mass flow rate
increases or the input current decreases. It appears that if the configuration of the arc heater
is known, the minimum value of input current and maximum value of the mass flow rate
can be determined using the numerical parametric study results. Therefore, it is expected
that the ARCFLO4 code could play an important role in the design process of arc heater.
6. Acknowledgement
The authors would like to specially thank Chul Park for a technical guidance at the Korea
Advanced Institute of Science and Technology. The authors would like to also thank
Takehara Sakai for an offer of his three-band radiation code at the Nagoya University.
7. References
Gupta, R. N., Yos, J. M., Thompson, R. A., & Lee, K. P. (1990). A Review of Reaction Rates
and Thermodynamic and Transport Properties for an 11-Species Air Model for
Chemical and Thermal Nonequilibrium Calculations to 30000 K, NASA RP-1232,
August 1990.
Han, S. H., Byeon, J. Y., Lee, J. I, & Kim, K. H. (2011). Numerical analysis of a 150kW
enhanced Huels type arc heater, 49
th
AIAA aerospace science meeting, Orlando,
January 2011.
Hightower, T. M., Balboni, J. A., MacDonald, C. L., Anderson, K. F., & Martinez, E. R. (2002).
Enthalpy by Energy Balance for Aerodynamic Heating Facility at NASA Ames Re-
search Center Arc Jet Complex, 48th International Instrumentation Symposium, the
Instrumentation, Systems, and Automation Society, Research Triangle Park, NC,
May 2002.
Jameson, A. & Yoon, S. (1987). Lower-Upper Implicit Schemes with Multiple Grids for the
Euler Equations, AIAA Journal, Vol. 25, No. 7, 1987, 929-935.
Jones, W. P., & Launder, B. E. (1972). The Prediction of Laminarization with a Two-Equation
Model of Turbulence, International Journal of Heat and Mass Transfer, vol. 15, No.
2, 1972, 301–314.
Kim, K. H. & Kim, C. (2005). Accurate, efficient and monotonic numerical methods for
multi-dimensional compressible flows Part II: Multi-dimensional limiting process,
Journal of Computational Physics, Vol. 208, No. 2, September 2005.
Kim, J. G., Oh, J. K., & Park, C. (2006). A High Temperature Elastic Collision Model for
DSMC Based on Collision Integrals, AIAA paper 2006-3803, June 2006.
Numerical Investigation of Plasma Flows Inside Segmented Constrictor Type Arc-Heater
123
Kim, K. H., Rho, O. H., & Park, C. (2000). Navier-Stokes Computation of Flows in Arc
Heaters, Journal of Thermophysics and Heat Transfer, Vol. 14, No. 2, 2000, 250-258.
Kim, K. H., Kim, C., & Rho, O. H. (2001). Methods for the Accurate Computations of
Hypersonic Flows: I. AUSMPW+ Scheme, Journal of Computational Physics, Vol.
174, No.1, November 2001, 38-80.
Lee, J. I., Kim, C., & Kim, K. H. (2007). Accurate Computations of Arc-heater Flows Using
Two-equation Turbulence Models, Journal of Thermophysics and Heat Transfer,
Vol. 21. No. 1, 2007, 67-76.
Lee, J. I., Han, S. H., Kim, C., & Kim, K. H. (2008). Analysis of Segmented Arc-heater Flows
with High Argon Concentration, Journal of Thermophysics and Heat Transfer, Vol.
22, No. 2, 2008, 187-200.
Lee, J. I. & Kim, K. H. (2010). Numerical Parameter Study of Low Electric Power Segmented
Arc Heaters, AIAA 2010-230, January 2010.
Matsuzaki, T., Ishida, K., Watanabe, Y., Miho, K., Itagaki, H., & Yoshinaka, T. (2002).
Construction and Characteristics of the 750 kW Arc Heated Wind Tunnel, Rept.
TM-760, October 2002.
McBride, B. J., Zehe, M. J., & Gordon, S. (2002). NASA Glenn Coefficients for Calculating
Thermodynamic Properties of Individual Species, NASA TP 2002-211556,
September 2002.
Menter, F. R. (1994). Two-Equation Eddy Viscosity Turbulence Models for Engineering
Applications, AIAA Journal, Vol. 32 No. 8, Nov. 1994, 1598-1605.
Nicolet, W. E., Shepard, C. E., C. E., Clark, K. J. Balakrishnan, A., Kesselring, J. P., Suchsland,
K. E., & Reese, J. J. (1975). Analytical and Design Study for a High-Pressure, High-
Enthalpy Constricted Arc Heater, AEDC-TR-75-47, July 1975.
Park, C. (2001). Chemical-Kinetic Parameters of Hyperbolic Earth Entry, Journal of
Thermophysics and Heat Transfer, Vol. 15, No. 1, 2001, 76-90.
Russo, G. (1993). The Scirocco Wind Tunnel Project - Progress report 1993, AIAA Paper
1993-5117, November 1993.
Sakai, T. & Olejniczak, J. (2001). Navier-Stokes Computations for Arcjet Flows, AIAA Paper
2001-3014, June 2001.
Sakai, T. & Olejniczak, J. (2003). Improvement in a Navier-Stokes Code for Arc Heater
Flows, AIAA Paper 2003-3782, June 2003.
Sakai, T. (2007). Computational Simulation of High-Enthalpy Arc Heater Flows, Journal of
Thermophysics and Heat Transfer, Vol. 21, No. 1, 2007, 77-85.
Smith, R., Wagner, D. A., & Cunningham, J. W. (1996). Experiments with a Dual Electrode
Plasma Arc Facility at the Deutsche Forschungsanstalt fur Luft-und Raumfahrt E.V.
(DLR), AIAA Paper 96-2211, June 1996.
Terrazas-Salinas, I. & Cornelison, C. (1999). Test Planning Guide for ASF Facilities, A029-
9701-XM3 Rev. B, March 1999.
Watson, V. R. & Pegot, E. B. (1967). Numerical Calculations for the Characteristics of a Gas
Flowing Axially Through a Constrictor Arc, NASA TN D-4042, June 1967.
Wilcox, D. C. (1998). Turbulence Modeling for CFD, 2nd ed., DCW Industries, La Canada,
CA, 1998, 119–122.
Aeronautics and Astronautics
124
Whiting, E. E., Park, C., Liu, Y., Arnold, J. O., & Paterson, J. A. (1996). NEQAIR96, Non-
equilibrium and Equilibrium Radiative Transport and Spectra Program: User
Manual, NASA Reference Publication 1389, December 1996.
Yos, J. M. (1963). Transport Properties of Nitrogen, Hydrogen, Oxygen, and Air to 30,000 K,
RAD-TM-63-7, March 1963.
0
Physico - Chemical Modelling in Nonequilibrium
Hypersonic Flow Around Blunt Bodies
Ghislain Tchuen
1
andYvesBurtschell
2
1
Institut Universitaire de Technologie F-V, LISIE, Université de Dschang,
Bandjoun - Cameroun
2
Ecole Polytechnique Universitaire de Marseille, Université de Provence,
DME, 5 rue Enrico Fermi Technopole de Chateau Gombert, Marseille, France
France
1. Introduction
The development of new space transportation vehicle requires better knowledge of
hypersonic flow around blunt bodies and an accurate prediction of thermal protection system
for extremely high temperatures. The complex domain of this hypersonic research program
concerns the fully understanding and the control of reentry flowfield. The vehicle flying
with high velocity through the upper layers of the atmosphere with low density. A very
strong bow shock wave around vehicle is generated and converted the high kinetic energy
into internal energy, thus increasing the temperature of the gas. Therefore, shock layer is the
site of intensive physico-chemical nonequilibrium processes such as vibrational excitation,
dissociation, electronic excitation, even the ionization and radiation phenomena. Under this
typical hypersonic condition, air must be considered as a plasma around the vehicle which
perturbes traditionally the communication between the vehicle and ground control station
because the plasma absorbs radio waves. The computation of such flowfield is a challenging
task.
The successful conception of such high technology would not have been possible without
some knowledge of these thermochemical nonequilibrium phenomena and how they affect
the performance of the vehicle. Some of these informations can either be obtained from
experimental facilities such as wind tunnel and ballistic range, or large scale fight experiments,
and/or numerical simulations. Moreover, small scale laboratory experiments are severely
limited by impossible exact simulation of thermo-chemical nonequilibrium flow around a
full scale hypersonic vehicle, and flight experiments are too costly to allow their widespread
usage. Therefore, much of these aerothermodynamics informations needed to design future
hypersonic vehicle will have to come from numerical predictions (the least expensive
approach) which is a reasonable alternative after sufficient validations.
The numerical simulation of hypersonic flow in thermochemical nonequilibrium past a blunt
body presents considerable difficulties for accurate solutions in the stagnation region. The
computational results depend on the choice of the thermochemical model and the strategy of
resolution. Generally, efforts provided to solve these types of flows have been based on the
full coupling between Navier-Stokes equations and the thermochemical phenomena. Many
5
2 Aeronautics and Astronautics
researchers have developed different thermal and chemical models for the description of
hypersonic flowfield with the same experimental configurations. Therefore, it is important
to determine an adequate model for accurate description of hypersonic flowfield.
Some of the largest uncertainties in the modeling of reacting hypersonic flow are the chemical
reaction rates and the coupling between thermochemical phenomena. The uncertainties
about the thermochemical processes render the calculations doubtful. Whereas methods
for analyzing the aerodynamics in equilibrium flow have achieved a level of maturity,
uncertainties remain in their nonequilibrium counterparts due to the incomplete modeling
of chemical processes. Consequently, a good knowledge of the chemical modeling is required.
For example, several chemical kinetics model give only the forward reaction rates. Many
options are available for the calculation of the backward reaction rate with the equilibrium
constant (Park[1], Gupta[2], Gibb[3]) and lead to different results. The method of computation
of the backward reaction rate affects flowfield structure, shock shapes, and vehicle surface
properties. It is necessary therefore, to make a judicious choice of an adequate model through
a comparative study.
In the literature, a multitude of models for chemical kinetics of air exist. These models are built
on different simplifying assumptions, and have all advantages and disadvantages depending
on the problem simulated. The objective of the present study is to investigate results
obtained with four different models of chemical kinetic. Solutions from models proposed by
Gardiner[4], Moss[5], Dunn and Kang[6], and Park[7] are compared. Particular attention has
been devoted to the way in which the backward reactions have been obtained. Gupta[2] high
temperature least-squares equilibrium constant curves fits are also included. The influence of
the formulations of Hansen[8], and Park[1] for the coupling between a molecule’s vibrational
state and its dissociation rate are compared. Several studies were presented in the past on
the dissociation of nitrogen or of oxygen separately[9; 10]. The extension of these works to
the complexity of overall reactions of air remains questionable. The present chapter attempt
to identify the model with an acceptable confidence for a wide range of Mach number. The
gas was chemically composed either by seven species (O, N, NO, O
2
, N
2
, NO
+
, e
−
)with24
step chemical reactions or by 17 reactions involving five species (O, N, NO, O
2
, N
2
)and,orby
nitrogen dissociated partially (N
2
, N ). One approach to validate the thermochemical model in
CFD codes is to compare the shock standoff distance and the stagnation heating point along a
sphere, with the experimental data.
Moreover, it has been shown that the description of the flow with a one temperature model
leads to a substantial overestimation of the rate of equilibration when compared with the
existing experimental data [1]. Much work on nonequilibrium flow are based on a model with
two [11] or three [12] temperatures. For two temperature model, vibrational and electronic
mode of molecules are described by a single temperature. This assumption is made to
simplify the calculation. For the model at three temperature, it is assumed that a single
temperature control the translational-rotational modes, a second temperature for vibrational
mode for all molecules, and the third temperature for electronic-free electron modes. This was
a resonable assumption if the vibrational-vibrational coupling between the various molecular
species is very strong. It is well known that the vibrational and electronic temperatures
play important role in a high temperature gas because they improve the definition and
evaluation of the physical properties of nonequilibrium hypersonic flow. In the present
chapter, four-temperature model is used with two vibrational temperatures and the numerical
results obtained for RAM C flight have well been compared with experimental data.
126
Aeronautics and Astronautics
Physico - Chemical Modelling in Nonequilibrium Hypersonic Flow Around Blunt Bodies 3
The results present in this chapter were obtained using an improved version of the time
marching Navier-Stokes code CARBUR, originally developed at IUSTI Marseille. The code
has been extensively tested in the past[13–16], and it’s used here for the solutions of the
stagnation-region flowfield. The scheme is based on a multiblock finite volume technique.
The convective numerical flux is calculated by upwind technology with Riemann’s solvers
algorithms. The second-order central differences are used to discretize the viscous fluxes.
An accurate second order algorithm in space and time is obtained by employing the MUSCL
approach in conjunction with the Minmod limiter and the time predictor-corrector schemes.
The source terms are treated implicitly to relax the stiffness. The steady state is obtained
after convergence of the unsteady formulation of the discretized equations. We have included
the recent definition and improvement in physical modelling. Special attention will be
given to treatment of chemical phenomena that take place during reentry phase, in order to
complete some description and modelisation of thermochemical nonequilibrium flow around
atmospheric reentry vehicle.
2. Nomenclature
A
i,j
area of the cell (i, j)
A
r
constant for evaluating foward reaction rate coefficient K
f ,r
C
s
v,q
specific heat at constant volume for species s for energy mode q,
(where q
≡ Translation, rotation, vibration, electronic)
C
s
p,q
specific heat at constant pressure for species s for energy mode q
D
s
diffusion coefficient of species s
ρe, e total energy per unit volume, mass
ρe
e
, e
e
s
electron-electronic energy per unit volume, mass of species s
ρe
v
m
, e
v
m
vibrational energy per unit volume, mass of molecules m
H
i,j
axisymmetric source term
K
eq,r
equilibrium constant for reaction r
K
f ,r
, K
b,r
forward and backward reaction-rate coefficient for reaction r
L
e
Lewis constant number, (= ρC
p
D/λ)
M
s
molecular weight of species s
NM total number of molecules
N
k
outward normal vector on each side of the cell
NR total number of reactions
NS total number of species
NSV total number of molecules in vibrational nonequilibruim
p
s
pressure of species s
Q
T−e
translation-electronic energy transfer rate
Q
T−v
m
translation-vibration energy transfer rate
Q
v−v
m
vibration-vibration energy transfer rate
r
i,j
radius of the cell-center position
T Translational-rotational temperature
T
a
geometrically averaged temperature (= T
q
T
1−q
v
or = T
q
T
1−q
e
)
T
e
electron-electronic excitation temperature
T
v
m
vibrational temperature of molecule m
t time
127
Physico - Chemical Modelling in Nonequilibrium Hypersonic Flow Around Blunt Bodies
4 Aeronautics and Astronautics
U vector of conserved quantities
u, v velocity in x and y directions
Y
s
mass fraction of species s (=
ρ
i
ρ
)
Greek symbols
λ
tr
translational thermal conductivity of mixture
λ
v,m
vibrational thermal conductivity of molecule m
λ
el
electronic thermal conductivity of mixture
ω
s
mass production rate for species s
α
s,r
stoichiometric coefficient for reactant s in reaction r
β
s,r
stochiometric coefficient for product s in reaction r
γ ratio of specific heat (γ
= C
p
/C
v
)
Ω
i,j
source term
θ
r
characteristic temperature of reaction r
θ
v,m
characteristic temperature of vibration
τ
m
average vibrational relaxation time of molecule m
τ
VT
m,s
vibrational relaxation time for collision pair m − s
ρ total density (
= Σ
s
ρs)
ρ
s
density of species s
Subscripts
eq equilibrium
m molecule
s species
w wall
∞ freestream
3. Analysis
The governing equations that describe the weakly ionized, thermo-chemical nonequilibruim
flow have been developed by Lee [17]. In this work, the following assumptions are introduced:
1) The flow regime is continuum. 2) The energy level of each mode are populated following
boltzmann distribution with a characteristic temperature. 3) The rotational mode energy of
molecules is fully equilibrated with the translational mode of heavy particles, and therefore
translational and rotational temperatures of molecules are equal. 4) The harmonic oscillator
model is employed for the vibrational energy. 5) The gas in the shock layer does not emit nor
absorb radiation. 6) When ionization is taken into account, absence of the conduction current
is assumed and an induced electric field is built up by charge separation [18], the magnitude
of this field is predicted to be: E
i
∼
=
−
1
N
e
e
∂p
e
∂x
i
.
The full laminar Navier-Stokes equations for two-dimensional conservation equations are
written as:
The mass conservation equation for each species, s,
∂ρ
s
∂t
+
∂ρ
s
u
j
∂x
j
+
∂ρ
s
V
j
s
∂x
j
= ω
s
(1)
128
Aeronautics and Astronautics
Physico - Chemical Modelling in Nonequilibrium Hypersonic Flow Around Blunt Bodies 5
The momentum conservation equation in x and y directions,
∂ρu
i
∂t
+
∂(ρu
i
u
j
+ pδ
ij
)
∂x
j
+
∂τ
ij
∂x
j
=
∑
s
N
s
Z
s
E
i
(2)
The total energy equation,
∂ρe
∂t
+
∂((ρe + p)u
j
)
∂x
j
+
∂u
i
τ
ij
+ q
t
j
+ q
v
m
j
+ q
e
j
+
∑
ns
s
(ρ
s
h
s
V
j
s
)
∂x
j
=
∑
s
N
s
Z
s
E
i
u
i
(3)
The conservation equation of vibrational energy for each nonequilibrium molecule,
∂ρe
v
m
∂t
+
∂(ρe
v
m
u
j
)
∂x
j
+
∂(q
v
j
+ ρ
m
e
v
m
V
j
m
)
∂x
j
= Q
T−v
m
+ Q
v
m
−v
r
+ Q
v
m
−e
(4)
When the electronic relaxation is accounted, the electron-electronic energy conservation
equation
∂ρe
e
∂t
+
∂((ρe
e
+ p
e
)u
j
)
∂x
j
+
∂(q
e
j
+
∑
s
ρ
s
e
e
s
V
j
s
)
∂x
j
= u
j
∂p
e
∂x
j
− Q
v
m
−e
+ Q
T−e
+ Q
el
(5)
In these equations, the electric field due to the presence of electrons in flow is expressed as:
−→
E −
1
N
e
−→
∇
p
e
(6)
The mixture is assumed to be electrically neutral
(
∑
s
N
s
Z
s
E
i
0
)
as a consequence of the
chemical kinetic mechanism; for each ion produced/consumed in the flow an electron is
also produced/consumed. The local charge neutrality is also assumed. Thus, the number
of electrons is equal to number of ions at each point:
ρ
e
=
ˆ
M
e
∑
s=io ns
ρ
s
ˆ
M
s
(7)
The state equation of the gas allows to close the system of equations (1-5). The total pressure
is given as sum of partial pressures of each species regarded as perfect gas.
p
=
NS
∑
s=1
p
s
=
∑
s=e
ρ
s
R
s
T + ρ
e
R
e
T
e
(8)
The total energy of the mixture per unit volume
ρe
=
∑
s=e
ρ
s
C
s
v,tr
T +
1
2
∑
s
ρ
s
u
2
s
+
NM
∑
m=1
ρ
m
e
v
m
+ ρe
e
+
NS
∑
s=1
ρ
s
h
0
s
(9)
is splitted between the translational-rotational, kinetic, vibrational, electron-electronic
contributions, and the latent chemical energy of the species. T and T
e
are deduced through
the equation (5) and (9) with an iterative method. The vibrational temperature of the diatomic
129
Physico - Chemical Modelling in Nonequilibrium Hypersonic Flow Around Blunt Bodies
6 Aeronautics and Astronautics
species m is determined by inverting the expression for the energy contained in a harmonic
oscillator at temperature T
v
m
:
e
v
m
=
R
ˆ
M
m
θ
v,m
e
θ
v,m
/T
v
m
− 1
(10)
The speed of sound plays a major role in flux-split algorithm. It’s evaluation in the case
of one translational temperature is no longer applicable in the case of multiple translation
temperature. The correction of the speed of sound due to electronic contribution and the
presence of electron translational temperature has been included[19]:
a
2
= γ
p
ρ
+(γ − 1)
T
T
e
− 1
p
e
ρ
(11)
where classical speed of sound is obtained when T
= T
e
.
3.1 Transport coefficients
The transport coefficient modelling can have a considerable quantitative influence on
practically relevant quantities such as skin friction and heat flux at the vehicle walls. Accurate
measurements of transport coefficients at the high temperatures of interest for hypersonic
applications are very difficult to realize and there is accordingly severe dearth of reliable
experimental data for these thermophysical properties. Several useful simplifications have
been used but their relevance and reliability, other than for quick estimates of order of
magnitude, become rather questionable under increasingly advanced demands on accuracy.
Some of the formulas in use become less reliable at high temperatures where ionization
becomes important. In this study, the viscous stresses τ
ij
are defined with the hypothesis
of Stokes. The dynamic viscosity is given by Blottner[20] interpolation law. The thermal
conductivity of each species is derived from Eucken’s[3] relation. The Wilke’s semi-empirical
mixing rule[21] is used to calculate total viscosity and conductivity of the gas. For simplicity,
the mass diffusion fluxes for neutral species are given by Fick’s law with a single diffusion
coefficient [19]. The diffusion of ions is modeled with ambipolar diffusion coefficient D
ambi
ion
=
2D
s
. To improve this formula, we used D
ambi
ion
= D
ion
(1 + T
e
/T) as recommended in[22]. The
effective diffusion coefficient of the electrons (D
e
) is proportional to the ambipolar diffusion
coefficient of the ions [19].
The total heat flux is assumed to be given by the Fourier’s law as:
Q
=
∑
s
q
s
= −
∑
s
λ
tr,s
∇T + λ
v,s
∇T
v,s
+ λ
el,s
∇T
e
+ ρ D
s
h
s
∇Y
s
(12)
which is the resultant of the flux of conduction, vibration, electronics and the diffusion of the
total energy. After using an extension form of Masson and Monchick assumptions[23], and
the relation given by Athye[24] to connect thermal conductivity of vibration with the diffusion
coefficient, a more convenient form of the total heat flux is obtained as:
−→
Q = −
λ
tr
C
pf
∇h +(L
e
− 1)
NS
∑
s=1
h
s
∇Y
s
+
NSV
∑
s=1
Y
s
∇e
v,s
+ ∇e
e
(13)
130
Aeronautics and Astronautics
Physico - Chemical Modelling in Nonequilibrium Hypersonic Flow Around Blunt Bodies 7
Where the Lewis number L
e
=
ρDC
pf
λ
tr
represents the ratio of the parts of the heat flux due
to the energy transport by the diffusion gas mixture components and by heat conduction
which depends on the translational temperature, and λ
tr
= λ
tr
+
∑
I=eq
λ
v,I
(I: molecules in
equilibrium); and the similar expression for C
pf
= C
p
tr
+
∑
I=eq
Y
I
C
v
vib,I
.
3.2 Energy exc hange model
The energy exchange between translation and vibrational mode Q
T−v
is described according
to Landau-Teller theory[1]
Q
T−v
m
= ρ
m
e
v
m
(T) − e
v
m
(T
v
m
)
τ
m
(14)
and τ
m
is the relaxation time expressed as in reference[19].
The vibrational energy transfer between the different molecules is modelled by Candler[25]:
Q
v−v
m
=
∑
s=m
P
sm
Z
sm
ˆ
M
s
N
[
e
vs
(T
vsm
) − e
vs
] (15)
where T
vsm
is the same vibrational temperature obtained after the collision of the two
molecules, Z
sm
is the s − m collision number per unit volume which is determined from
kinetic theory[3], P
m−s
and P
s−m
are the two probabilities originating from the work of Taylor
et al.[26]. These probabilities have been presented recently in an exponential form by Park
and Lee[7].
When electron-electronic energy is taken into account, the expression of the energy exchanged
during electron-heavy particles collisions is derived from Lee[17]
Q
T−e
= 3Rρ
e
(T − T
e
)
8RT
e
πM
e
∑
r=e
ρ
r
N
ˆ
M
2
r
σ
er
(16)
where σ
er
are the collision cross sections for interaction electron-other particle. The value is
assumed to be constant and equal to 10
−20
m
2
.
Q
e−v
m
is the energy source term from vibration-electron coupling. It is assumed that only
N
2
− e coupling is strong[17], and its expression is assumed to be of the Landau-Teller form :
Q
e−v
m
= ρ
m
ˆ
M
m
ˆ
M
e
e
v
m
(T
e
) − e
v
m
(T
v
m
)
τ
em
; m = N
2
(17)
where the relaxation time τ
em
is a function of electron-electronic temperature and electron
pressure as presented in[25]. The term Q
el
accounts for the rate of electron energy loss when
a free electron strikes a neutral particle and ionizes it, with a loss in electron translational
energy.
3.3 Chemical processes
The accurate characterization of the shock layer in hypersonic flow requires the good
knowledge of the species mass, produced by chemical reactions which take place according to
a suitable chemical kinetic model. An instantaneous accurate prediction of the mass fraction
and the heating rate require a correct simulation of the chemical behavior of the flow field. The
131
Physico - Chemical Modelling in Nonequilibrium Hypersonic Flow Around Blunt Bodies
8 Aeronautics and Astronautics
mechanism by which the considered chemical reactions appear is little known. Several ways
lead to intermediate products or highly unstable excited states, which are available virtually
for each reaction. It is difficult to produce theoretical formulations that involve all species,
and to conduct experimental work for the kinetic data that shows the evolution of chemical
reactions. Solutions from Dunn and Kang[6], the Gardiner[4], Moss[5] and Park[7] reaction
rate sets are compared. All these models are different essentially in the data of the forward and
backward coefficients of reactions rate. In Dunn and Kang, the ratio of rate is not necessarily
equal to the equilibrium constant as required by Eq.19. A modified Dunn and Kang model,
was created when the backward rate is computed either with exact or curve fit equilibrium
constants. Three different models of chemical reactions are simulated in this study.
- The first model applied to 5 species (O, N , NO, O
2
, N
2
) with 17 elementary reactions are
grouped into 15 reactions of dissociation and 2 exchange reactions.
• Dissociation
O
2
+M O+O+M
N
2
+M N+N+M
NO + M
N+O+M
• Exchange or Zel’dovich reaction
O+N
2
NO + N
NO + O
O
2
+N
M represents the collision partner which is one of the 5 species of the mixture.
- The second model is applied to 7 air species (O, N, NO, O
2
, N
2
, NO
+
, e
−
) with 24 elementary
reactions. In this case, the reaction of ionization is added to the model above
N+O
NO
+
+ e
−
- The last model is applied to the dissociation of nitrogen gas (N
2
, N ).
The increase or decrease of the species concentration due to chemical reactions is given by
source terms ω
s
as follows:
ω
s
=
ˆ
M
s
NR
∑
r=1
(β
s,r
− α
s,r
).
K
f ,r
NS
∏
s=1
(ρ
s
/
ˆ
M
s
)
α
s,r
− K
b,r
NS
∏
s=1
(ρ
i
/
ˆ
M
s
)
β
s,r
where the associated forward and reverse reaction rate coefficients are assumed to satisfy the
generalized Arrhenius law:
K
f ,r
= A
r
T
η
r
e
−θ
r
/T
(18)
Backward rates K
b,r
are defined either with curve fit constants in the Arrhenius expression, or
with the equilibrium constant K
eq,r
:
K
eq,r
=
K
f ,r
K
b,r
=
∏
NS
i=1
(ρ
i
/
ˆ
M
i
)
α
i,r
∏
NS
i
=1
(ρ
i
/
ˆ
M
i
)
β
i,r
(19)
K
eq,r
can be determined analytically with the minimization of Gibbs free energy of each species
under thermodynamics assumptions [3]. Moreover, for thermo-chemical nonequilibrium,
132
Aeronautics and Astronautics
Physico - Chemical Modelling in Nonequilibrium Hypersonic Flow Around Blunt Bodies 9
the theoretical formulation becomes poorly defined due to the complexity of the physical
phenomenon. However, the fitting of experimental data would be more reliable than the
theoretical formulation, because every simplification introduce in the thermodynamics model
affects results.
According to Park, the equilibrium constant K
eq,r
is given by the following exponential
polynomial
K
eq,r
= ex p(A
1,r
+ A
2,r
z + A
3,r
z
2
+ A
4,r
z
3
+ A
5,r
z
4
), (20)
z
= 10000/T
This Park curve fits were performed from data points only at 2 000, 4 000, 6 000, 8 000 and 10
000K. Gupta[2] has examined the curve fits for equilibrium constants to temperatures above
30 000K. He demonstrates that the five parameters used in both the Park reaction rate set and
those derived from the Dunn and Kang[2] rates are incorrect at temperatures above 10 000K.
Gupta least squares curve fitted, with a six parameters function for equilibrium constant is of
the form
K
eq,r
= exp(a
1,r
z
5
+ a
2,r
z
4
+ a
3,r
z
3
+ a
4,r
z
2
+ a
5,r
z + a
6,r
) (21)
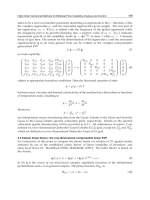
The forward reactions rate of the dissociation of the nitrogen molecule are represented in Fig.1
and it is observed that the Dunn and Kang kinetic is largely seperated from the others. The
causes of uncertainties on the determination of the reactions rate coefficients are multiple, and
is still rather poorly known. The present work examines various options for calculating the
backward rates for several chemical kinetic models. The vibration - dissociation coupling is
also considered in this chapter.
3.4 Vibration-dissociation coupling
The vibration - dissociation coupling is very important behind a strong shock in
thermo-chemical nonequilibriun flow. Directly behind the shock, the translational
temperature reaches a maximum value while the vibrational temperature takes a time to be
excited before reaching its equilibrium value. Therefore, a model of dissociation depending
only on the translational temperature will tend to overestimate total dissociation. The most
important and poorly understood issue is how to model the coupling between a molecule’s
vibrational state and its dissociation rate. Many analyses of this coupling have been made in
the past, either with more or less realistic and sophisticated physico-chemical models, or with
semi-empirical methods easily usable in hypersonic computation codes[1]. There are perhaps
10 such models available in literature, however only the Park and Hansen models are used in
this study.
Chemical reaction rates are affected by the extent to which the internal modes of atoms
and molecules are excited. The coupling factor translating the influence of the vibration on
dissociation is given by the ratio:
Z
(T, T
v
)=
K
f
(T, T
v
)
K
f
(T)
(22)
There are several methods for including thermal non-equilibrium effects in the chemical
kinetic of air. Some have a semi-empirical origin, based on experimental results and
133
Physico - Chemical Modelling in Nonequilibrium Hypersonic Flow Around Blunt Bodies