Nuclear Power System Simulations and Operation Part 5 potx
Bạn đang xem bản rút gọn của tài liệu. Xem và tải ngay bản đầy đủ của tài liệu tại đây (811.53 KB, 15 trang )
Development of an Appendix K Version of RELAP5-3D and
Associated Deterministic-Realistic Hybrid Methodology for LOCA Licensing Analysis
49
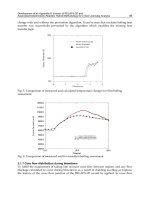
change with and without the prevention algorithm. It can be seen that nucleate boiling heat
transfer was successfully prevented by the algorithm which modifies the existing heat
transfer logic.
Fig. 5. Comparison of measured and calculated temperature changes for film boiling
assessment
Fig. 6. Comparison of measured and for transition boiling assessment
2.1.7 Core flow distribution during blowdown
To fulfill the requirement of taking into account cross flow between regions and any flow
blockage calculated to occur during blowdown as a result of cladding swelling or rupture,
the feature of the cross flow junction of the RELAP5-3D would be applied. In cross flow
Nuclear Power - System Simulations and Operation
50
junctions, the transverse momentum convection terms are neglected. Therefore, there is no
transport of x-direction momentum due to the flow in the transverse direction. To assess the
calculation of core flow distribution under flow partial blockage, two EPRI flow blockage
tests (Tapucu et al., 1984) were adopted in which single-phase liquid and two-phase
air/water were used for a range of blockages and flow conditions. The comparisons of the
calculated channel pressure distribution for the unblocked channel of the two-phase test
against measurements is shown in Figure 8.
0.0 5.0 10.0 15.0 20.0
Time (s)
0
2
4
6
8
10
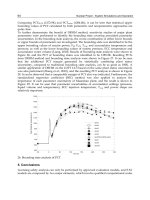
Heat Transfer Mode
htmode 1101001(RELAP5-3D/K)
htmode 1101001(RELAP5-3D)
'3036-hm10-1.grf'
transition boiling
sat. nucleate boiling
subcooled nucleate boiling
Fig. 7. Heat transfer mode calculated by the modified RELAP5-3D with & w/o nucleate
boiling lock-out
-0.8 -0.6 -0.4 -0.2 0.0 0.2 0.4 0.6 0.8 1.
0
A
xial Position
(
M
)
1.0E+005
1.2E+005
1.4E+005
1.6E+005
1.8E+005
2.0E+00
5
Pre
s
s
ure
(
P
a
)
EPRI Two-Phase Cross Flow Test
Run #4, Blocked Channel
Test Data
RELAP5-3D
Fig. 8. Comparison of measured and calculated pressure distributions of the blocked
channel
2.1.8 Reflood rate for PWRs
According to Appendix K of 10 CFR 50, the calculated carryover fraction and mass in
bundle needs to be verified against applicable experimental data. In the existing PSI reflood
Development of an Appendix K Version of RELAP5-3D and
Associated Deterministic-Realistic Hybrid Methodology for LOCA Licensing Analysis
51
model (Analytis, 1996)
of RELAP5-3D, the modified Bestion correlation was used for
interfacial drag in vertical bubbly-slug flow at pressures below 10 bars to replace the EPRI
correlation. Above 20 bars the EPRI correlation was used. Between 10 and 20 bars the
interfacial drag was interpolated. To assess the performance of the PSI model in the best
estimate version of the RELAP5-3D, five FLECHT-SEASET tests
(31504, 31203, 31302, 31805
and 33338) (Loftus et al., 1980) were adopted. For the first four forced reflood tests, the
flooding rates ranged from 0.81 inch/s to 3.01 inch/s. As for the last gravity-driven reflood
test, the flooding rate was up to 11.8 inch/s during the accumulator injection period. Typical
assessments were shown in Figures 9 and 10. Through the assessments against five reflood
tests, it was found that the PSI model could predict the flooding rate reasonable well but
with enough conservatism.
0 100 200 300 400 500
Time (sec)
0
10
20
30
40
Mass in Bundle(kg)
Flecht Seaset 31504
Test Data
Relap5 3D
Fig. 9. Comparison of measured and calculated carryover fractions
0 100 200 300 400 500
Time (sec)
0.00
0.20
0.40
0.60
0.80
1.00
Carryover Fraction
Flecht Seaset 31504
Test Data
Relap5 3D
Fig. 10. Comparison of measured and calculated bundle masses
Nuclear Power - System Simulations and Operation
52
2.1.9 Refill and reflood heat transfer for PWRs
During reflood phase, the RELAP5-3D PSI model was adopted to fulfill the Appendix K
requirement for a flooding rate greater than 1 inch/sec with necessary modifications. In the
PSI model, a modified Weisman correlation calculating the heat transfer to liquid and a
modified Dittus-Boelter correlation calculating the heat transfer to vapor replace the Chen
transition boiling correlation. As for film boiling, heat transfer to liquid uses the maximum
of a film coefficient contributed by the modified Bromley correlation, and a Forslund-
Rohsenow coefficient. In addition, radiation to droplets is added to the final film-boiling
coefficient to liquid. The heat transfer to vapor for film boiling is the same as the one for
transition boiling, which was calculated by the modified Dittus-Boelter. As required by the
Appendix K of 10 CFR 50, when the flooding rate is less than 1 inch/s, only steam cooling in
the PSI model was allowed. Assessment calculations were performed to against the five
FLECHT SEASET tests discussed above. To bind the peak cladding temperature (PCT) span
on each measured fuel rods at the same elevation, the calculated heat transfer coefficient
calculated by the original PSI model was reduced by a factor of 0.6 for the flooding rate
greater than 1 inch/sec to ensure reasonable conservatism. Typical comparison of the PCTs
is shown in Figures 11. While the comparison of heat transfer coefficients is shown in
Figures 12.
Fig. 11. Comparison of measured and calculated peak cladding temperatures
2.2 RELAP5-3D/K integral-effect assessments
To verify the overall conservatism of the newly developed Appendix K version of RELAP5-
3D, 11 sets of integral LOCA experimental data covering SBLOCA and LBLOCA for both
PWR and BWR, were applied, as listed in Table 2 and Table 3 for both PWR and BWR
respectively. In this paper, only integral assessments LOFT LBLOCA experiment L2-5
(Anklam et al., 1982) and SBLOCA S-LH-1 (Grush et al., 1981) were summarized.
Development of an Appendix K Version of RELAP5-3D and
Associated Deterministic-Realistic Hybrid Methodology for LOCA Licensing Analysis
53
Fig. 12. Comparisons of measured and calculated heat transfer coefficients
Cases L2-3 L2-5 Lp-Lb-1 S-06-3 L3-7 S-LH-1 IIST
Break Size 200% 200% 200% 200% 0.1% 5% 2%
Break
Location
Cold Leg Cold Leg Cold Leg Cold Leg Cold Leg Cold Leg Cold Leg
Notes
RCP
Running
RCP
Tripped
Higher
Power
RCP
Running
Without
Core
Heatup
With Core
Heatup
With
Core
Heatup
Table 2. Matrix of PWR LOCA integral effect assessments
Cases TLTA 6425 FIST 6DBA1B FIST 6LB1A FIST 6SB2C
Break Size 200% 200% 100% 2%
Break Location Recir. Line Break Recir. Line Break LPCI Line Break Recir. Line Break
Notes ADS Actuation HPCS Unavailable
Table 3. Matrix of BWR LOCA integral effect assessments
2.2.1 LBLOCA assessment
In the assessment of LOFT L2-5, important parameters including break flow, downcomer
water level and hot spot heat transfer coefficient calculated from both evaluation model
(EM) and best estimate (BE) model were shown in Figures 13, 14 and 15 respectively. It can
be seen that results from EM model are relatively conservative. The comparison of peak
cladding temperature (PCT) against measurement was shown in Figure 16. The calculated
PCT from EM model clearly bounds not only the BE PCT but also all the measurement
scatterings. The conservative PCT calculated by RELAP5-3D/K against LBLOCA experiments
Nuclear Power - System Simulations and Operation
54
from both LOFT and Semi-scale was summarized in Table 4 and the conservative trend is
shown in Figure 17. It can be seen that RELAP5-3D/K can conservatively predict PCT by 60-
260
K.
Fig. 13. Comparison of break flow of LOFT LBLOCA L2-5
Fig. 14. Comparison of downcomer water level of LOFT LBLOCA L2-5
2.2.2 SBLOCA assessment
SBLOCA experiment Semi-Scale S-LH-1 is a typical 5% cold break. Most important SBLOCA
phenomena were involved in S-LH-1 experiment, which includes early core uncover caused
by the core level depression, loop seal clearance and later core heat up caused by core boiled
off. The calculated break flow, core water level and PCT against S-LH-1 (5% SBLOCA) were
shown in Figures 18, 19 and 20 respectively. The conservatism of RELAP5-3D/K in SBLOCA
analysis generally can be observed.
Development of an Appendix K Version of RELAP5-3D and
Associated Deterministic-Realistic Hybrid Methodology for LOCA Licensing Analysis
55
Fig. 15. Comparison of core heat transfer coefficient of LOFT LBLOCA L2-5
Fig. 16. Comparison of peak cladding temperature of LOFT LBLOCA L2-5
Fig. 17. Conservative trend of PCT calculated by RELAP5-3D/K
Nuclear Power - System Simulations and Operation
56
Fig. 18. Comparison of breaks flow of semiscale SBLOCA S-LH-1
Cases
Measured
PCTs (°K)
PCTs by BE
Model (°K)
PCTs by EM
Model (°K)
PCT (°K)
(PCT
EM
-PCT
exp
)
L2-5 1057.2 998.6 1123.1 65.9
L2-3 898.3 938.1 1094.6 196.3
LP-LB-1 1252.4 1290.5 1343.4 91.0
S-06-3 1061.2 1123.7 1320.5(1271.2*) 259.3(210.0*)
TLTA6425 608.9 599.7 745.0 136.1
FIST 6DBA1B 646.9 691.3 714.9 68.0
Table 4. Summary of LBLOCA assessments
Fig. 19. Comparison of core water level of semiscale SBLOCA S-LH-1
Development of an Appendix K Version of RELAP5-3D and
Associated Deterministic-Realistic Hybrid Methodology for LOCA Licensing Analysis
57
Fig. 20. Comparison of peak cladding temperature of semiscale SBLOCA S-LH-1
3. Deterministic-realistic hybrid methodology for LOCA licensing analysis
Instead of applying a full ranged BELOCA methodology to cover both model and plant
status uncertainties, a deterministic-realistic hybrid methodology (DRHM) was developed
to support LOCA licensing analysis with RELAP5-3D/K. In the DRHM methodology,
Appendix K evaluation models are still adopted to ensure conservatism of physical model,
while CSAU methodology is applied to quantify the effect of plant status uncertainty on
PCT calculation. To ensure the model conservatism, not only physical model should satisfy
requirements set forth in the Appendix K of 10 CFR 50, sensitivity studies also need to be
performed to ensure a conservative plant modeling.
Fig. 21. PCT safety margins calculated by BE and appendix K LOCA methodologies
Nuclear Power - System Simulations and Operation
58
To statistically consider the plant status uncertainties, which involve uncertainties of plant
initial condition, accident boundary condition and plant system settings, the NRC endorsed
CSAU methodology is applied. Three major elements are involved in the CSAU methodology,
which are (I) requirements and capabilities, (II) assessment and ranging of parameters and (III)
sensitivity and uncertainty analysis. Since Appendix K conservative models will be adopted to
cover physical model uncertainties, model assessments stated in element II are not related.
Instead, ranking and ranging of plant status uncertainty would be the major focus. The
resulting PCT by using DRHM method theoretically can be lower than the PCT
APK
but higher
than the PCT
95/95
(PCT calculated by BELOCA methodology) as illustrated in Figure 21.
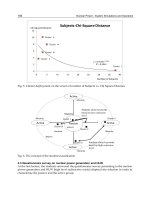
In DRHM methodology, six sequential steps are included, which are (1) ranking of plant
status parameters, (2) ranging of plant status uncertainties, (3) development of a run matrix
by random sampling, (4) using conservative E.M. model to perform LOCA analysis of each
trial, (5) statistical analysis of calculated figure of merit (PCTs) and (6) determine licensing
value of PCT. The procedure of DRHM is shown in Figure 22 and each step will be
elaborated as following:
Item Number Uncertainty Attributes Plant Parameters
1 Break Type
2 Break Area
3 Core Average Linear Heat Rate
4 Initial Average Fluid Temperature
5 Pressurizer Pressure
6 Accumulator Liquid Volume
7 Accumulator Pressure
8 Accumulator Temperature
9 Safety Injection Temperature
10 Peak Heat Flux Hot Channel Factor (FQ)
11 Peak Hot Rod Enthalpy Rise Hot Channel Factor (FDH)
12 Axial Power Distribution (PBOT)
13 Axial Power Distribution (PMID)
14 Off-Site Power
15 ECCS Capacity
Table 5. Major plant status parameters
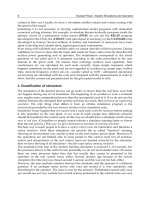
(1) Ranking of plant status parameters
Plant parameters which will affect LOCA analysis can be generally divided into three
groups, namely plant initial conditions, accident boundary conditions and plant system
settings. Essential plant parameters need to be identified and ranked to limit the scope of
uncertainty analysis. Typical PWR important plant status parameters are listed in Table 5.
Major plant status parameters generally involve system initial conditions, core initial
conditions, ECCS initial conditions, boundary conditions and system settings.
(2) Ranging of plant status uncertainties
To define the uncertainty of a plant parameter, not only the uncertainty range needs to be
quantified, but also the distribution function needs to be specified. Three different kinds of
Development of an Appendix K Version of RELAP5-3D and
Associated Deterministic-Realistic Hybrid Methodology for LOCA Licensing Analysis
59
Ranking of Plant Status Parameters
PCT
i
Distribution Check
(Goodness of fit)
PCT
95/95,L
max( PCT
95/95
,PCT
1st
/PCT
2nd
)
Ranging of Parameter Uncertainty &
Distribution Identification
Development of Run Matrix by Random
Sampling
( 59/ 124 trials )
Using RELAP 5- 3D/K to perform LOCA
Analysis of Each Trail, PCT
i
, i = 1,N
PCT
i
, N=1,59
or
PCT
i
, N=1,124
PCT
95/95
PCT
1s t
, N=59 (1 output)
or
PCT
95/95
PCT
1s t
, N=124 (3 outputs)
Calculate the Value of PCT
95/95
Yes
No
Non-parametric
Approach
Parametric
Approach
Plant Boundary
Conditions
Plant Initial
Conditions
Plant System
Settings
Penalized of Un -
ranged Parameters
Parameter Bias
=
<
<
Fig. 22. Procedures of DRHM methodology
elements contribute the total uncertainty of a particular plant status parameter, which
involve measurement uncertainty, fabrication uncertainty and normal operational range.
For instance, the uncertainties of system pressure and coolant average temperature (T
avg
) are
majorly contributed by measurement uncertainty. While for the uncertainty of the total
peaking factor (F
Q
), measurement uncertainty, fabrication uncertainty and operational
uncertainty are all involved. The associated range of operational uncertainty of F
Q
can be
determined by the nominal technical specification value (typically 2.274) and statistical
upper bounding operating value (typically 2.000). As for the determination of power shape,
the traditional bounding shape will be relaxed by sampling realistic operating shapes. Each
Nuclear Power - System Simulations and Operation
60
operating power shape can be divided into three segments, P
mid
, P
bot
and (1- P
mid
-P
bot
). With
the sampling values of F
Δ
H
, F
Q
, P
mid
and P
bot
, a unique power shape can be defined as shown
in Figure 23.
0 0.1 0.2 0.3 0.4 0.5 0.6 0.7 0.8 0.9 1
Normalized core height
0
0.2
0.4
0.6
0.8
1
1.2
1.4
1.6
1.8
2
2.2
2.4
Normalized power density
hot rod
hot bundle
average bundle
FQ=2.22, FH=1.73, Pbot=0.315, Pmid=0.3325
0 0.1 0.2 0.3 0.4 0.5 0.6 0.7 0.8 0.9 1
Normalized core height
-0.2
0
0.2
0.4
0.6
0.8
1
1.2
1.4
1.6
1.8
2
2.2
2.4
Normalized power density
hot rod
hot bundle
average bundle
FQ=2.22, FH=1.54, Pbot=0.2575, Pmid=0.365
Fig. 23. Sampling of power shapes
(3) Development of a run matrix by random sampling
Once the major system parameters have been identified and ranged, random sampling of
each parameter needs to be performed to generate a run matrix. Typical parameter samplings
of F
Q
, P
rcs
, T
avg
and P
acc
are shown in Figure 24. The run matrix needs to consist of trials of 59
sets, 93 sets or 124 sets according to the order statistic method (David and Nagaraja, 1980).
Fig. 24. Typical parameter sampling
Development of an Appendix K Version of RELAP5-3D and
Associated Deterministic-Realistic Hybrid Methodology for LOCA Licensing Analysis
61
(4) Using conservative plant E.M. model to perform LOCA analysis of each trial
Conservative plant E.M. model will be applied to analyze each trial to calculate the PCT of
each LOCA event. Regarding the conservative plant E.M. model, requirements of Appendix
K for physical models will be satisfied, and a conservative plant specific model will be
implemented based on sensitivity studies. Since RELAP5-3D/K is an Appendix K version of
RELAP5-3D, it will be adopted to build a plant specific model.
(5) Statistical analysis of calculated figure of merit (PCTs)
Once the PCT of each trial can be calculated, both parametric (Devore, 2004) and non-
parametric statistical approaches (David and Nagaraja, 1980) can be applied to determine
the statistical upper tolerance limit. The parametric approach can directly calculate the
PCT
95/95
while the non-parametric approach can conservatively estimate of value of PCT
95/95
.
Non-parametric approach
In this approach, it is not necessary to identify the distribution of PCT outcomes. If only one
outcome is cited from each trail, the Wilk’s formula (David & Nagaraja, 1980) can be applied
to calculate the estimator the 95/95 upper tolerance limit.
1
N
β
γ
=− (5)
where
β is the confidence level, γ is the tolerance interval and N is the required number of
samples. According to the Wilk’s formula, the 95/95 value can be conservatively estimated
by either the greatest PCT from 59 trials, the 2nd highest value of PCT from 93 trials or the
3rd highest value of PCT from 124 trials. That is:
95/95 1
(59)
st
YY
≈
or
95/95 2
(93)
nd
YY
≈
or
95/95 3
(124)
rd
YY
≈
(6)
If more than one outcome needs to be cited from each trial, the Guba’s formula (Guba and
Makai, 2003) can be used:
0
!
(1 )
()!!
NP
j
N
j
j
N
Njj
βγγ
−
−
=
=−
−
∑
(7)
where N is the sample size and P is the number of output variables. If output variable is
only one, the Guba formula will reduce to Wilk’ formula.
Parametric approach
In this approach, the distribution of outcome needs to be identified by using fitting test, such
as goodness-of-fitting test. If a certain distribution can be identified, such as normal
distribution or uniform distribution, the population mean (μ
p
) and population standard
deviation (σ
p
) can be projected by sample mean (μ
s
) and sample standard deviation (σ
s
)
under a certain confidence level, such as 95%. The sample mean (μ
s
) and sample standard
deviation (σ
s
) are:
1
/
n
si
i
xn
μ
=
=
∑
,
2
2
*
11
n
i
i
ss
x
n
nn
σ
μ
⎡⎤
⎢⎥
⎛⎞
⎢⎥
=−
⎜⎟
⎢⎥
−−
⎝⎠
⎢⎥
⎢⎥
⎣⎦
∑
(8)
Nuclear Power - System Simulations and Operation
62
If normal distribution can be assumed by goodness-of-fitting test, the μ
p
and σ
p
under a
given confidence level can be expressed as:
(1) /
ps s
tn n
α
μμ σ
⎡
⎤
≤+ −∗
⎣
⎦
(9)
2
2
2
1
(1)
(1)
s
p
n
n
α
σ
σ
χ
−
−
≤
−
(10)
where t
α
(n-1) is the student t variable at (1-α) confidence level under (n-1) degree of
freedom,
2
1
(1)n
α
χ
−
−
is
2
χ
variable at (1-α) confidence level under (n-1) degree of freedom.
Once μ
p
and σ
p
are projected at 95% confidence level (μ
p,95%
, σ
p,95%
), the 95/95 coverage can
be directly expressed as:
95/95 ,95% ,95%
1.645
pp
Y
μ
σ
=
+ (11)
(6) Determine licensing value of PCT
If both parametric and nonparametric approaches and be applied to calculate the 95/95
upper tolerance limit, then the maximum value of these two calculations will be defined as
the licensing value of PCT. That is:
sin 95/95
max( , )
Licen
g
order
PCT PCT PCT
=
(12)
where PCT
95/95
is the PCT statistical upper bounding value determined by the parametric
approach, and PCT
order
is the PCT statistical upper bounding value determined by non-
parametric order statistic method.
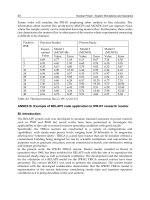
4. Application of DRHM on PWR LBLOCA analysis with RELAP5-3D/K
To demonstrate the benefit of DRHM method for LOCA analysis, uncertainty ranges and
distributions of each essential plant parameter identified by Westinghouse (Westinghouse,
2009) are applied to analyze LBLOCA using DRHM method for the Taiwan Maanshan 3-
loop PWR plant. The resulting PCT by DRHM method will be compared with the PCT
calculated by traditional Appendix K bounding parameter analysis.
In Maanshan DRHM LBLOCA analysis, 59 trails are generated by random sampling of
major plant parameters listed in Table 5. The resulting PCT of each trail are shown in Figure
25 and the greatest PCT among 59 sets is 1284.6K. Therefore, the PCT
95/95
estimated by order
statistic method is:
[
]
95/95
, 1,59 1284.6
order i
PCT PCT Max PCT i K≈= == (13)
Furthermore, the 59 sets of PCT were also arranged into six groups in sequential order for
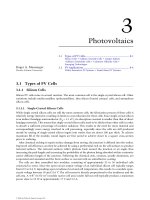
goodness of fitting test by using the Pearson Chi-squares test statistic (Devore, 2004):
()
2
2
1
ˆ
ˆ
k
ii
i
i
nn
p
np
χ
=
−
=
∑
(14)
Development of an Appendix K Version of RELAP5-3D and
Associated Deterministic-Realistic Hybrid Methodology for LOCA Licensing Analysis
63
0 100 200 300 400
Time (s)
200
400
600
800
1000
1200
1400
Peak Cladding Temperature (K)
PCT
1st
=Max[PCT
i
,i=1,59]=1852F=1284.6K
Fig. 25. Calculated PCT of each trial figure
where n is the total number of samples, n
i
is the number of samples in group i and
ˆ
p
is the
probability estimated by integration over group i with standard normal distribution
function. The Pearson Chi-squares test statistic will be checked with the Chi-squares critical
value,
2
(1)kr
α
χ
−− where k is the number of group (k=6) and r is the number of unknowns
(r=2). A rejection region at (1-α) confidence level will be defined by
2
(1)kr
α
χ
−
− as :
22
(1)kr
α
χχ
≥−− (15)
Therefore, the successful condition of goodness-of-fit test at 95% confidence level will be:
22 2
0.05
( 1) (3) 7.815kr
α
χχ χ
<−−= = (16)
Since
2
χ
is 4.376 and it is less than the Chi-squares critical value (
2
0.05
(3) 7.815
χ
= ), therefore
the distribution normality can be accepted and the classical parametric approach can be
applied to project the μ
p
and σ
p
base on the μ
s
and σ
s
under a giver confidence level. Under
95% confidence level the population mean value of PCT can be no greater than:
,95%
( 1)* / 967.6
ps s
tn n K
α
μμ σ
⎡⎤
≤+ − =
⎣⎦
(17)
and the population standard deviation of PCT can be no greater than:
2
22
,95%
2
1
(1)
(185.6 )
(1)
s
p
n
K
n
α
σ
σ
χ
−
−
≤=
−
(18)
As a result, the PCT
95/95
calculated by parametric approach is:
95/95 ,95% ,95%
1.645 * 1272.9
pp
PCT K
μ
σ
=
+= (19)