REPORT NO. 2010-138 MARCH 2010 EDISON STATE COLLEGE _part2 pot
Bạn đang xem bản rút gọn của tài liệu. Xem và tải ngay bản đầy đủ của tài liệu tại đây (210.54 KB, 9 trang )
MARCH 2010 REPORT NO. 2010-138
6
Revenues and expenses of the College and its component unit for the respective periods ended are shown in the
following table:
Operating Results for the Periods Ended
(In Thousands)
6-30-09 6-30-08 3-31-09 3-31-08
Operating Revenues
Student Tuition and Fees, Net of Scholarship
Allowances 19,615$ 14,535$ $ $
Federal Grants and Contracts 1,158 2,052
Nongovernmental Grants and Contracts 1,899 731 5,397 6,902
Auxiliary Enterprises 1,284 1,654
Other Operating Revenues 928 542 1,597 45
Total Operating Revenues
24,884 19,514 6,994 6,947
Less, Operating Expenses 65,660 57,431 5,948 3,338
Operating Income (Loss)
(40,776) (37,917) 1,046 3,609
Nonoperating Revenues (Expenses)
State Appropriations 24,130 27,737
Other Nonoperating Revenues 15,904 12,554 1,415 3,471
Other Nonoperating Expenses (95) (74) (12,048) (4,855)
Net Nonoperating Revenues (Expenses)
39,939 40,217 (10,633) (1,384)
Income (Loss) Before Other Revenues,
Expenses, Gains, or Losses
(837) 2,300 (9,587) 2,225
Capital Appropriations 23,218 10,109
Capital Grants, Contracts, Gifts, and Fees 2,049 76 516 1,829
Increase to Permanent Endowments 200 142
Increase (Decrease) in Net Assets
24,430 12,485 (8,871) 4,196
Net Assets, Beginning of Year 113,623 101,138 44,670 40,474
Net Assets, End of Year
138,053$ 113,623$ 35,799$ 44,670$
College Component Unit
Operating Revenues
GASB Statement No. 35 categorizes revenues as either operating or nonoperating. Operating revenues generally
result from exchange transactions where each of the parties to the transaction either give up or receive something of
similar value.
This is trial version
www.adultpdf.com
MARCH 2010 REPORT NO. 2010-138
7
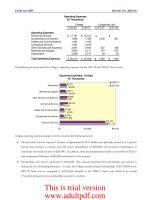
The following chart presents the College’s operating revenues for the 2008-09 and 2007-08 fiscal years:
Operating Revenues: College
(In Thousands)
When compared to the prior fiscal year, the College’s operating revenues increased by $5.4 million, or 27.5 percent,
due primarily to the 5 percent increase in the student tuition rate, an increase in enrollment, an increase in amounts
from Federal and nongovernmental grants and contracts, and the lease of its excess Education Broadband Station
bandwidth.
Operating Expenses
Expenses are categorized as operating or nonoperating. The majority of the College’s expenses are operating
expenses as defined by GASB Statement No. 35. GASB gives financial reporting entities the choice of reporting
operating expenses in the functional or natural classifications. The College has chosen to report the expenses in their
natural classification on the statement of revenues, expenses, and changes in net assets and has displayed the
functional classification in the notes to financial statements.
Operating expenses for the College and its discretely presented component unit for the respective periods ended are
presented in the following table:
$19,615
$1,158
$1,899
$1,284
$928
$14,535
$2,052
$731
$1,654
$542
$0 $12,500 $25,000
Student Tuition and Fees, Net
Federal Grants and Contracts
Nongovernmental Grants and Contracts
Auxiliary Enterprises
Other
2007-08
2008-09
This is trial version
www.adultpdf.com
MARCH 2010 REPORT NO. 2010-138
8
Operating Expenses for the Periods Ended
(In Thousands)
6-30-09 6-30-08 3-31-09 3-31-08
Operating Expenses
Personnel Services 37,050$ 34,170$ $ $
Scholarships and Waivers 8,195 5,803 3,202 2,431
Utilities and Communications 2,187 2,079
Contractual Services 6,214 5,029 2,063 280
Other Services and Expenses 3,850 4,594 683 627
Materials and Supplies 4,445 2,261
Depreciation 3,719 3,495
Total Operating Expenses
65,660$ 57,431$ 5,948$ 3,338$
College Component Unit
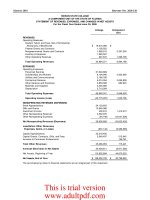
Operating expense changes were primarily the result of an increase in personnel costs due to authorized pay increases
and increases in health insurance benefit costs. Scholarships and waivers increased due to the increase in student
enrollment. Contractual services increased due to services being performed by third parties rather than in-house.
Other services and expenses decreased due to decreased spending for repairs and maintenance, noncapitalized
expenditures, and printing. Materials and supplies increased due to increased costs of noncapitalized software and
information technology supplies.
The following chart presents the College’s expenses for the 2008-09 and 2007-08 fiscal years:
Operating Expenses: College
(In Thousands)
Nonoperating Revenues and Expenses
Certain revenue sources that the College relies on to provide funding for operations, including State appropriations,
certain gifts and grants, and investment income, are defined by GASB as nonoperating. Nonoperating expenses
$3,719
$4,445
$3,850
$6,214
$2,187
$8,195
$37,050
$3,495
$2,261
$4,594
$5,029
$2,079
$5,803
$34,170
$0 $22,500 $45,000
Depreciation
Materials and Supplies
Other Services and Expenses
Contractual Services
Utilities and Communications
Scholarships and Waivers
Personnel Services
2007-08
2008-09
This is trial version
www.adultpdf.com
MARCH 2010 REPORT NO. 2010-138
9
include capital financing costs and other costs related to capital assets. The following summarizes the College’s
nonoperating revenues and expenses for the 2008-09 and 2007-08 fiscal years:
Nonoperating Revenues (Expenses): College
(In Thousands)
2008-09 2007-08
State Appropriations 24,130$ 27,737$
Gifts and Grants 12,948 8,654
Investment Income 403 879
Other Nonoperating Revenue 2,553 3,021
Other Nonoperating Expenses (95) (74)
Net Nonoperating Revenues 39,939$ 40,217$
Other Revenues, Expenses, Gains, or Losses
This category is mainly comprised of capital appropriations. The following summarizes the College’s other revenues,
expenses, gains, or losses for the 2008-09 and 2007-08 fiscal years:
Other Revenues, Expenses, Gains, or Losses: College
(In Thousands)
2008-09 2007-08
Capital Appropriations 23,218$ 10,109$
Capital Grants, Contracts, Gifts, and Fees 2,049 76
Total
25,267$ 10,185$
The $13.1 million increase in capital appropriations is due to a significant increase in Public Education Capital Outlay
funding for general renovation and remodeling at all campuses, the Health Science Annex Addition (Nursing Building
at the Lee Campus), and the Classrooms and Labs Remodel/Renovation at the Lee and Collier Campuses.
T
HE STATEMENT OF CASH FLOWS
Another way to assess the financial health of an institution is to look at the statement of cash flows. Its primary
purpose is to provide relevant information about the cash receipts and cash payments of an entity during a period.
The statement of cash flows also helps users assess:
¾ An entity’s ability to generate future net cash flows.
¾ Its ability to meet its obligations as they come due.
¾ Its need for external financing.
A summary of the College’s cash flows for the 2008-09 and 2007-08 fiscal years is presented in the following table:
This is trial version
www.adultpdf.com
MARCH 2010 REPORT NO. 2010-138
10
Condensed Statement of Cash Flows: College
(In Thousands)
2008-09 2007-08
Cash Provided (Used) by:
Operating Activities (36,896)$ (34,126)$
Noncapital Financing Activities 39,635 38,549
Capital and Related Financing Activities 4,112 (1,902)
Investing Activities (9,579) 656
Net Increase (Decrease) in Cash and Cash Equivalents
(2,728) 3,177
Cash and Cash Equivalents, Beginning of Year 20,988 17,811
Cash and Cash Equivalents, End of Yea
r
18,260$ 20,988$
The College’s cash inflows from operating activities were primarily provided by tuition and fees and grants and
contracts. Cash inflows from student tuition and fees increased by $4.7 million dollars as a result of increased student
fee rate and increased enrollments. Cash outlays from operating activities were primarily for payments for employee
wages and benefits of $36.7 million, payments to suppliers for goods and services of $12.8 million, and payments for
scholarships of $16.5 million. Cash outlays for payments to employees increased by $2.1 million due to salary
increases and cash outlays for payments for employee benefits increased by 0.7 million due to increases in health
insurance costs.
State appropriations are the primary source of noncapital financing inflows. Other noncapital financing activities
included gifts and grants considered nonexchange transactions in accordance with GASB Statement No. 35. Cash
provided by noncapital financing activities increased $1 million from the previous year. Cash flows from State
appropriations decreased $3.3 million and cash flows from gifts and grants increased by $4.4 million. The cash flows
from gifts and grants are primarily due to an increase in Federal Pell grants of $3.7 million, or 62 percent.
The main capital and related activities include payments received under the Public Education Capital Outlay
appropriation, proceeds from the issuance of debt, and receipt of capital related grants and gifts. Net cash provided
by capital and related financing activities increased by $6 million from the previous year. Outflows include purchases
of capital assets of $12.2 million for the acquisition of items related to ongoing construction projects.
CAPITAL ASSETS AND DEBT ADMINISTRATION
C
APITAL ASSETS
At June 30, 2009, the College had $144.4 million invested in capital assets, less accumulated depreciation of
$50.2 million, for net capital assets of $94.2 million. Depreciation charges for the current fiscal year totaled
$3.7 million. The following table summarizes the College’s capital assets for the 2008-09 fiscal year.
This is trial version
www.adultpdf.com
MARCH 2010 REPORT NO. 2010-138
11
Capital Assets: College
(In Thousands)
Capital Assets Beginning Additions Reductions Ending
Balance Balance
Land 2,702$ 378$ $ 3,080$
Art Collections 147 145 292
Buildings 107,870 1,317 109,187
Other Structures and Improvements 11,788 531 12,319
Furniture, Machinery, and Equipment 4,795 1,011 210 5,596
Construction in Progress 5,042 9,738 869 13,911
Total
132,344 13,120 1,079 144,385
Less, Accumulated Depreciation:
Buildings 35,329 3,483 38,812
Other Structures and Improvements 7,604 (251) 7,353
Furniture, Machinery, and Equipment 3,771 487 214 4,044
Total Accumulated Depreciation
46,704 3,719 214 50,209
Capital Assets, Net
85,640$ 9,401$ 865$ 94,176$
Major capital projects completed during the 2008-09 fiscal year included the HVAC Chiller replacement for
$0.3 million and the fire main extension for $0.2 million on the Lee and Charlotte Campuses, and other district-wide
remodeling and renovation projects.
D
EBT ADMINISTRATION
At fiscal year-end, the College had $2.6 million in long-term debt outstanding, comprised solely of State Board of
Education (SBE) Capital Outlay Bonds issued on behalf of the College. These bonds mature serially and are secured
by the College’s portion of the State-assessed motor vehicle license tax. Proceeds from these bonds are used to
construct and renovate College facilities. More detailed information about the College’s long-term liabilities is
presented in the notes to financial statements.
ECONOMIC FACTORS THAT WILL AFFECT THE FUTURE
Edison State College’s economic condition is closely tied to that of the State of Florida and the southwest Florida
region. Due to the current economic downturn the State has decreased the amounts appropriated for colleges.
Although State appropriations comprised approximately 60 percent of total unrestricted general revenue, State
Appropriations decreased 13 percent from the prior year. These decreases are expected to continue in the next few
years.
Public education, by all indications, will continue to be a priority for Federal funding. The Obama administration
recently pledged $12 billion to the Nation’s community colleges. The State will have to rely on funds appropriated
through the American Recovery and Reinvestment Act in order to properly fund the college system. The State will
grant the moneys to the colleges as the part of the State Fiscal Stabilization Fund. Although the College maintains a
healthy unrestricted net assets balance, it has reserved funds in order to meet its long term needs as the Federal
This is trial version
www.adultpdf.com
MARCH 2010 REPORT NO. 2010-138
12
stimulus funding will cease to continue after the two years for which it has been earmarked. These factors indicate
that current operations will be adequately funded for the future.
REQUESTS FOR INFORMATION
Questions concerning information provided in the MD&A, and financial statements and notes thereto, or requests for
additional financial information should be addressed to the Executive Director of Financial Services, Edison State
College, 8099 College Parkway, Fort Myers, FL 33919.
This is trial version
www.adultpdf.com
MARCH 2010 REPORT NO. 2010-138
13
BASIC FINANCIAL STATEMENTS
College Component
Unit
ASSETS
Current Assets:
Cash and Cash Equivalents 6,494,018$ 215,543$
Restricted Cash and Cash Equivalents 4,579,915
Investments 4,896,884
Restricted Investments 5,335,232
Accounts Receivable, Net 2,377,614 1,054,404
Notes Receivable, Net 178,351
Due from Other Governmental Agencies 22,679,943
Prepaid Expenses 624,777 2,252
Total Current Assets
47,166,734 1,272,199
Noncurrent Assets:
Restricted Cash and Cash Equivalents 7,185,652
Investments 95,268
Restricted Investments 511,559 30,762,991
Depreciable Capital Assets, Net 76,893,201
Nondepreciable Capital Assets 17,282,589
Other Assets 8,922,156
Total Noncurrent Assets
101,968,269 39,685,147
TOTAL ASSETS
149,135,003$ 40,957,346$
LIABILITIES
Current Liabilities:
Accounts Payable 2,225,141$ 83,231$
Salary and Payroll Taxes Payable 401,477
Retainage Payable 392,991
Deferred Revenue 807,220 5,075,160
Deposits Held for Others 2,343
Long-Term Liabilities - Current Portion:
Bonds Payable 145,000
Special Termination Benefits Payable 152,311
Compensated Absences Payable 119,738
Total Current Liabilities
4,246,221 5,158,391
Noncurrent Liabilities:
Bonds Payable 2,435,000
Special Termination Benefits Payable 110,719
Compensated Absences Payable 4,250,032
Postemployment Healthcare Benefits Payable 40,326
Total Noncurrent Liabilities
6,836,077
TOTAL LIABILITIES
11,082,298 5,158,391
EDISON STATE COLLEGE
A COMPONENT UNIT OF THE STATE OF FLORID
A
STATEMENT OF NET ASSETS
June 30, 2009
This is trial version
www.adultpdf.com
MARCH 2010 REPORT NO. 2010-138
14
College Component
Unit
NET ASSETS
Invested in Capital Assets, Net of Related Debt 91,595,790$ $
Restricted:
Nonexpendable:
Endowment 644,027 12,683,250
Expendable:
Grants and Loans 1,512,317
Scholarships 1,154,314 18,973,245
Capital Projects 33,964,315
Debt Service 81,299
Unrestricted 9,100,643 4,142,460
Total Net Assets
138,052,705 35,798,955
TOTAL LIABILITIES AND NET ASSETS
149,135,003$ 40,957,346$
EDISON STATE COLLEGE
A COMPONENT UNIT OF THE STATE OF FLORID
A
STATEMENT OF NET ASSETS (Continued)
June 30, 2009
The accompanying notes to financial statements are an integral part of this statement.
This is trial version
www.adultpdf.com