REPORT NO. 2011-059 DECEMBER 2010 UNIVERSITY OF SOUTH FLORIDA POLYTECHNIC A REGIONAL CAMPUS OF THE UNIVERSITY OF SOUTH FLORIDA _part2 pptx
Bạn đang xem bản rút gọn của tài liệu. Xem và tải ngay bản đầy đủ của tài liệu tại đây (111.39 KB, 10 trang )
DECEMBER 2010 REPORT NO. 2011-059
7
Operating Expenses
Expenses are categorized as operating or nonoperating. The majority of the Regional Campus’s expenses are
operating expenses as defined by GASB Statement No. 35. GASB gives financial reporting entities the choice of
reporting operating expenses in the functional or natural classifications. The Regional Campus has chosen to report
the expenses in their natural classification on the statement of revenues, expenses, and changes in net assets and has
displayed the functional classification in the notes to financial statements.
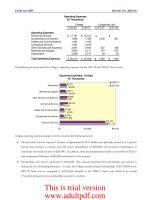
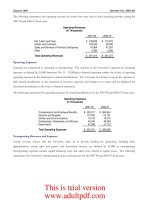
The following summarizes the operating expenses by natural classifications for the 2009-10 and 2008-09 fiscal years:
Operating Expenses
(In Thousands)
2009-10 2008-09
Compensation and Employee Benefits 11,600$ 10,400$
Services and Supplies 2,078 1,577
Utilities and Communications 87 81
Scholarships, Fellowships, and Waivers 1,483 1,338
Depreciation 719 708
Total Operating Expenses
15,967$ 14,104$
Total operating expenses increased by $1.9 million mainly attributable to increases in compensation and employee
benefits of $1.2 million; services and supplies of $0.5 million; and scholarships, fellowships, and waivers of
$0.1 million. Increases in compensation and employee benefits, and services and supplies are the result of increased
faculty/support personnel, infrastructure, and program and campus operating support.
Nonoperating Revenues and Expenses
Certain revenue sources that the Regional Campus relies on to provide funding for operations, including State
appropriations, certain gifts and grants, and investment income, are defined by GASB as nonoperating. Nonoperating
expenses include capital financing costs and other costs related to capital assets. The following summarizes the
Regional Campus’s nonoperating revenues and expenses for the 2009-10 and 2008-09 fiscal years:
Nonoperating Revenues (Expenses)
(In Thousands)
2009-10 2008-09
State Appropriations 12,995$ 8,621$
Federal and State Student Financial Aid 1,980 1,589
State Appropriated American Recovery
and Reinvestment Act Funds 709
Investment Income 249 116
Other Nonoperating Revenues 2 2
Interest on Capital Asset-Related Debt (20)
Other Nonoperating Expenses (47) (288)
Net Nonoperating Revenues
15,888$ 10,020$
Total nonoperating revenues (expenses) increased by $5.9 million, due primarily to a 50.7 percent increase in State
appropriations of $4.4 million. The appropriation increase will assist in establishing the faculty/support personnel
and infrastructure necessary to meet operating requirements of the Regional Campus as it aligns course offerings and
faculty hires necessary to meet the Polytechnic mission and vision of an applied learning environment. Other changes
included an increase in Federal and State student financial aid of $0.4 million, State Appropriated American Recovery
This is trial version
www.adultpdf.com
DECEMBER 2010 REPORT NO. 2011-059
8
and Reinvestment Act funds of $0.7 million, and an increase in investment income of $0.1 million due to an increase
in the average investment portfolio balance and favorable changes in investment activities. Other nonoperating
expenses decreased $0.2 million mainly due to a reduction in the loss on disposal of capital assets.
Other Revenues, Expenses, Gains, or Losses
This category is mainly composed of capital appropriations; capital grants, contracts, donations and fees; and transfers
to and from other University campuses. The following summarizes the Regional Campus’s other revenues, expenses,
gains, or losses for the 2009-10 and 2008-09 fiscal years:
Other Revenues, Expenses, Gains, or Losses
(In Thousands)
2009-10 2008-09
Capital Appropriations 10,490$ 15,220$
Capital Grants, Contracts, Donations, and Fees 17,914
Transfers To/From Other University Campuses, Net (297) 792
Total
10,193$ 33,926$
Total other revenues decreased by $23.7 million. The major reduction in capital grants, contracts, donations, and fees
was because of a onetime donation of land, $17.9 million, recorded in the 2008-09 fiscal year. Capital appropriations
decreased $4.7 million from the previous fiscal year’s continued funding for the new campus building. A reduction of
$1.1 million in net transfers to/from other university campuses was primarily from interdepartmental charges and
cash transfers between other campus University funds.
T
HE STATEMENT OF CASH FLOWS
The statement of cash flows provides information about the Regional Campus’s financial results by reporting the
major sources and uses of cash and cash equivalents. This statement will assist in evaluating the Regional Campus’s
ability to generate net cash flows, its ability to meet its financial obligations as they come due, and its need for external
financing. Cash flows from operating activities show the net cash used by the operating activities of the Regional
Campus. Cash flows from the capital financing activities include all plant funds. Cash flows from the investing
activities show the net source and use of cash related to purchasing or selling investments, and earning income on
those investments. Cash flows from the noncapital financing activities include those activities not covered in other
sections.
The following summarizes cash flows for the 2009-10 and 2008-09 fiscal years:
Condensed Statement of Cash Flows
(In Thousands)
2009-10 2008-09
Cash Provided (Used) by:
Operating Activities (9,910)$ (9,068)$
Noncapital Financing Activities 15,047 11,459
Capital and Related Financing Activities (819) (129)
Investing Activities (2,351) (9,370)
Net Increase (Decrease) in Cash and Cash Equivalents
1,967 (7,108)
Cash and Cash Equivalents, Beginning of Year 3 7,111
Cash and Cash Equivalents, End of Year
1,970$ 3$
This is trial version
www.adultpdf.com
DECEMBER 2010 REPORT NO. 2011-059
9
Major sources of operating activities cash inflows included net student tuition and fees ($4.4 million) and grants and
contracts ($0.3 million). The three major outflows included in the calculation of net cash used for operating activities
are payments to employees ($11.1 million), payments to suppliers ($2.1 million) and payments to students for
scholarships and fellowships ($1.5 million). The net cash used for operating activities increased by $0.8 million,
primarily due to increases in payments to employees of $0.8 million, payments to suppliers of $0.3 million and
payments to students for scholarships and fellowships of $0.1 million, offset by increases in tuition and fees
collections of $0.5 million, and a reduction in grants and contracts of $0.1 million.
The net cash provided by noncapital financing activities consists primarily of $13 million of State appropriations,
$0.7 million of American Recovery and Reinvestment Act funds, and $2 million for Federal and State student financial
aid received during the 2009-10 fiscal year.
Cash used by capital and related financing activities increased by $0.7 million. This was mainly due to an increase in
purchases or construction of capital assets.
Cash used by investing activities decreased by $7 million mainly due to a decrease in purchases of investments and a
change in investment strategy and activities.
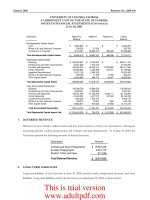
CAPITAL ASSETS, CAPITAL EXPENSES AND COMMITMENTS,
AND DEBT ADMINISTRATION
C
APITAL ASSETS
At June 30, 2010, the Regional Campus had $39.8 million in capital assets, less accumulated depreciation of
$3.9 million, for net capital assets of $35.9 million. Depreciation charges for the current fiscal year totaled
$0.7 million. The following table summarizes the Regional Campus’s capital assets, net of accumulated depreciation at
June 30:
Capital Assets, Net at June 30
(In Thousands)
2010 2009
Land 17,910$ 17,910$
Buildings 10,653 10,902
Construction in Progress 5,734 3,848
Infrastructure and Other Improvements 29 31
Furniture and Equipment 1,386 1,447
Library Resources 27 44
Other Capital Assets 160 139
Capital Assets, Net
35,899$ 34,321$
Additional information about the Regional Campus’ capital assets is presented in the notes to financial statements.
C
APITAL EXPENSES AND COMMITMENTS
The following table summarizes the Regional Campus’s major capital commitments as of June 30, 2010:
Amount
Current Commitment 20,400$
Expenses 5,734
Balance Committed
14,666$
(In Thousands)
This is trial version
www.adultpdf.com
DECEMBER 2010 REPORT NO. 2011-059
10
D
EBT ADMINISTRATION
The Regional Campus’s beginning net assets was increased by $0.5 million to correct an error in reporting bonds and
revenue certificates payable for State University System Capital Improvement Trust Fund Revenue Bonds. In prior
fiscal years the liability for these bonds was reported on the Regional Campus’s statement of net assets. It has
subsequently been determined that these bonds are not debt of the Regional Campus. Although proceeds from the
bonds were provided to the Regional Campus for capital projects, the Regional Campus is not responsible for the
repayment of the bonds. Repayment of the bonds is the responsibility of the Florida Board of Governors to be paid
from capital improvement fees collected by all universities and remitted in total to the Florida Department of
Education. After the recording of this adjustment the Regional Campus has no bonds or revenue certificates payable.
ECONOMIC FACTORS THAT WILL AFFECT THE FUTURE
Chapter 2010-206, Laws of Florida, established the Florida Industrial and Phosphate Research Institute (FIPRI,
formerly Florida Institute of Phosphate Research) within the University of South Florida Polytechnic. The law
became effective June 4, 2010. In the 2010-11 fiscal year, FIPRI will receive authority for approximately $7.3 million
by the Phosphate Research Trust Fund. This appropriation is not reflected in the Regional Campus 2009-10 fiscal
year State allocated funding.
Effective July 1, 2010, Chapter 2010-155, Laws of Florida, authorized a doctor of pharmacy degree program at the
University of South Florida to be housed at the University of South Florida Polytechnic new campus facility upon
completion of facility construction. New legislative appropriations for the doctor of pharmacy degree program will be
received through Regional Campus appropriations.
The recent economic downturn has affected the level of State appropriations. The Legislature has authorized tuition
increases over the past few years, combined with increased technology and distance learning fees, intended to provide
additional resources to support a balanced budget and expansion of academic programs and services to support
students.
The budget adopted by the Florida Legislature for the State University System for the 2010-11 fiscal year reflected a
base budget reduction for the Regional Campus of $459,666. To offset the base budget adjustment, the Legislature
allocated $678,080 nonrecurring Federal stimulus funds to the Regional Campus. The 2010-11 fiscal year is the
second of two years this funding is expected to be allocated. The Regional Campus has examined their operations to
generate savings in both administrative and academic areas in anticipation that the Federal stimulus funding will not
continue.
Regional Campus management is committed to meeting its enrollment growth plan to increase full-time student
enrollment from 943 in the 2010-11 fiscal year to 2,228 in the 2015-16 fiscal year. The Regional Campus is
developing more daytime and on-line courses to meet enrollment targets. The Regional Campus expects to begin
offering lower-level courses in Spring 2011 and admit freshman and sophomore students in the Fall 2013 term.
Activities associated with Florida Industrial and Phosphate Research Institute do not directly involve student
enrollment.
At the campus facility shared with Polk State College, the Regional Campus currently occupies 69,830 square feet of
offices, classrooms, and both campus and student support space. The Regional Campus has been moving through
the planning and approval steps necessary for development of its new campus site at Interstate 4 and the Polk
Parkway. The first facility will establish an open, multipurpose design in support of the interdisciplinary and
collaborative learning environment foundational to a polytechnic experience for our students. The Legislature, in the
2010-11 fiscal year, approved a $16 million enhancement funding appropriation which provided $10 million for
This is trial version
www.adultpdf.com
DECEMBER 2010 REPORT NO. 2011-059
11
faculty and staff hires and programs in support of upper and lower level coursework and freshman and sophomore
admissions at the Regional Campus, and provided $6 million operating support for the doctor of pharmacy program
at USF to be housed at the Regional Campus upon completion of facility construction.
REQUESTS FOR INFORMATION
Questions concerning information provided in the MD&A or other required supplementary information, and
financial statements and notes thereto, or requests for additional financial information should be addressed to Linda
Peterson, University Controller, 4202 East Fowler Avenue, Tampa, Florida 33620-5800.
This is trial version
www.adultpdf.com
DECEMBER 2010 REPORT NO. 2011-059
12
BASIC FINANCIAL STATEMENTS
ASSETS
Current Assets:
Cash and Cash Equivalents 1,940,689$
Investments 11,903,109
Accounts Receivable, Net 673,634
Loans and Notes Receivable, Net 36,124
Due from State 26,628,111
Total Current Assets
41,181,667
Noncurrent Assets:
Restricted Cash and Cash Equivalents 29,806
Restricted Investments 183,070
Loans and Notes Receivable, Net 84,289
Depreciable Capital Assets, Net 12,255,006
Nondepreciable Capital Assets 23,643,707
Total Noncurrent Assets
36,195,878
TOTAL ASSETS
77,377,545$
LIABILITIES
Current Liabilities:
Accounts Payable 153,521$
Construction Contracts Payable 229,293
Salaries and Wages Payable 538,412
Deposits Payable 5,208
Deferred Revenue 128,500
Long-Term Liabilities - Current Portion:
Compensated Absences Payable 63,943
Total Current Liabilities
1,118,877
UNIVERSITY OF SOUTH FLORIDA POLYTECHNIC
STATEMENT OF NET ASSETS
June 30, 2010
A REGIONAL CAMPUS OF THE UNIVERSITY OF SOUTH FLORID
A
This is trial version
www.adultpdf.com
DECEMBER 2010 REPORT NO. 2011-059
13
LIABILITIES (Continued)
Noncurrent Liabilities:
Federal Advance Payable 96,193$
Compensated Absences Payable 715,342
Other Postemployment Benefits Payable 308,750
Total Noncurrent Liabilities
1,120,285
TOTAL LIABILITIES
2,239,162
NET ASSETS
Invested in Capital Assets 35,898,713
Restricted for Expendable:
Loans 25,697
Capital Projects 26,569,046
Other 716,574
Unrestricted 11,928,353
TOTAL NET ASSETS
75,138,383
TOTAL LIABILITIES AND NET ASSETS
77,377,545$
The accompanying notes to financial statements are an integral part of this statement.
UNIVERSITY OF SOUTH FLORIDA POLYTECHNIC
STATEMENT OF NET ASSETS
(
Continued
)
June 30, 2010
A REGIONAL CAMPUS OF THE UNIVERSITY OF SOUTH FLORID
A
This is trial version
www.adultpdf.com
DECEMBER 2010 REPORT NO. 2011-059
14
REVENUES
Operating Revenues:
Student Tuition and Fees, Net of Scholarship
Allowances of $705,601 4,421,562$
Federal Grants and Contracts 323,952
State and Local Grants and Contracts 13,931
Nongovernmental Grants and Contracts 18,152
Sales and Services of Auxiliary Enterprises 23,753
Interest on Loans and Notes Receivable 1,235
Total Operating Revenues
4,802,585
EXPENSES
Operating Expenses:
Compensation and Employee Benefits 11,599,663
Services and Supplies 2,078,066
Utilities and Communications 86,619
Scholarships, Fellowships, and Waivers 1,483,525
Depreciation 718,882
Total Operating Expenses
15,966,755
Operating Loss
(11,164,170)
NONOPERATING REVENUES (EXPENSES)
State Appropriations 12,995,407
Federal and State Student Financial Aid 1,979,830
State Appropriated American Recovery and Reinvestment
Act Funds 708,656
Investment Income 248,911
Other Nonoperating Revenues 1,695
Other Nonoperating Expenses (46,842)
Net Nonoperating Revenues
15,887,657
Income Before Other Revenues, Expenses,
Gains, or Losses
4,723,487
Capital Appropriations 10,489,797
Transfers To/From Other University Campuses, Net (296,831)
Increase in Net Assets
14,916,453
Net Assets, Beginning of Year 59,737,373
Adjustment to Beginning Net Assets 484,557
Net Assets, Beginning of Year, as Restated
60,221,930
Net Assets, End of Year
75,138,383$
The accompanying notes to financial statements are an integral part of this statement.
UNIVERSITY OF SOUTH FLORIDA POLYTECHNIC
STATEMENT OF REVENUES, EXPENSES, AND CHANGES IN NET ASSETS
For the Fiscal Year Ended June 30, 2010
A REGIONAL CAMPUS OF THE UNIVERSITY OF SOUTH FLORIDA
This is trial version
www.adultpdf.com
DECEMBER 2010 REPORT NO. 2011-059
15
CASH FLOWS FROM OPERATING ACTIVITIES
Tuition and Fees, Net 4,378,726$
Grants and Contracts 325,375
Sales and Services of Auxiliary Enterprises 22,829
Interest on Loans and Notes Receivable 2,015
Payments to Employees (11,130,357)
Payments to Suppliers for Goods and Services (2,082,940)
Payments to Students for Scholarships and Fellowships (1,483,525)
Net Loans Issued to Students 58,375
Net Cash Used by Operating Activities
(9,909,502)
CASH FLOWS FROM NONCAPITAL FINANCING ACTIVITIES
State Appropriations 12,995,407
Federal and State Student Financial Aid 1,979,830
State Appropriated American Recovery and Reinvestment
Act Funds 708,656
Operating Subsidies and Transfers (607,589)
Net Change in Funds Held for Others (2,586)
Other Receipts 1,695
Other Expenses (28,191)
Net Cash Provided by Noncapital Financing Activities
15,047,222
CASH FLOWS FROM CAPITAL AND RELATED FINANCING ACTIVITIES
Capital Appropriations 1,027,466
Purchase or Construction of Capital Assets (1,846,414)
Net Cash Used by Capital and Related Financing Activities
(818,948)
CASH FLOWS FROM INVESTING ACTIVITIES
Purchase or Sale of Investments, Net (2,356,454)
Investment Income 5,463
Net Cash Used by Investing Activities
(2,350,991)
Net Increase in Cash and Cash Equivalents
1,967,781
Cash and Cash Equivalents, Beginning of Year 2,714
Cash and Cash Equivalents, End of Year
1,970,495$
UNIVERSITY OF SOUTH FLORIDA POLYTECHNIC
STATEMENT OF CASH FLOWS
For the Fiscal Year Ended June 30, 2010
A REGIONAL CAMPUS OF THE UNIVERSITY OF SOUTH FLORIDA
This is trial version
www.adultpdf.com
DECEMBER 2010 REPORT NO. 2011-059
16
RECONCILIATION OF OPERATING LOSS
TO NET CASH USED BY OPERATING ACTIVITIES
Operating Loss (11,164,170)$
Adjustments to Reconcile Operating Loss
to Net Cash Used by Operating Activities:
Depreciation Expense 718,882
Change in Assets and Liabilities:
Receivables, Net (77,294)
Accounts Payable 81,741
Salaries and Wages Payable 173,420
Compensated Absences Payable 130,455
Deferred Revenue 62,033
Other Postemployment Benefits Payable 165,431
NET CASH USED BY OPERATING ACTIVITIES
(9,909,502)$
The accompanying notes to financial statements are an integral part of this statement.
UNIVERSITY OF SOUTH FLORIDA POLYTECHNIC
STATEMENT OF CASH FLOWS (Continued)
For the Fiscal Year Ended June 30, 2010
A REGIONAL CAMPUS OF THE UNIVERSITY OF SOUTH FLORIDA
This is trial version
www.adultpdf.com