United States General Accounting Office GAO September 1988 Report to the Congress FINANCIAL_part5 ppt
Bạn đang xem bản rút gọn của tài liệu. Xem và tải ngay bản đầy đủ của tài liệu tại đây (444.98 KB, 10 trang )
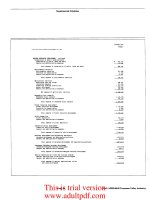
Supplemental Schedules
Schedule C-Details of Power Expense
Page 39
GAO/AFMDSHM Tennessee
Valley Authority
This is trial version
www.adultpdf.com
Supplemental Schedules
Page 40
GAO/m Tennessee Valley Authority
This is trial version
www.adultpdf.com
Supplemental Schedules
Page 41
GAO/APMLNWM Tennessee Valley Authority
This is trial version
www.adultpdf.com
Supplemental Schedules
$ 265,369 $ 56,511 $ 24,322
127,818 277
71,211
1,721,540 107,200
105,739
684,059 56,373 201,544
2.304,786 220,361
408.876
88,126 4,614
184.281
6,134
1,587,192 161,013
258.606 69,154
173.993 35,661
2,292,198 277,176
1,892.092 284,479
$6.489.076
$782,016
1.002.543 380,628
6.473 2.055
249.160
82,800
46.10 52.58
14.252
12,048
180.481
15.595
15,165
237,541
163,712
$809,629
106,255
7.620
36,000
33.98
Page 42
GAO/AFMD@MO Tennessee Valley Authority
This is trial version
www.adultpdf.com
Supplemental Schedules
s
37.017
t 66,939 t 72,528 $ 11.733 $
37.488 $ 9.331 $ 489,>08
21.119 3,868 13,soo
1,198 10,'58S 4 4 3
358,392 67,435 156,371 39.719 350,893
41.191 564.98'1
65,700 54,292 94,315 46,716 142.610
23,009 971,047
482,228 192,534 286,714 97,168 512,189
84,716 2,025,983
13,781 8,299 23,314 4,391
11.154 8.471 lO%,fJOl
35,200 2,259 99,714 3,693
23,931 1,302 136,832
405,788 308,223 249.206 245,362
28;382 8.I37 81,166
45.418 14,262 24.454 12.784
36, 346 39,993 1,301,648
25,738 15,830 46,827 10,113
71.142 3,517 189.128
525,925 3h8 813
A
443,415 276,343 120,955
61,970 1,811,>75
181,171
110,580 540,089 364,198 208,733
40,160 5,671,729
51.189,274
$651.987 $1,270,718
$737,709
$861,397
$9,509,687 $L86,846
138.6>8 161,869 92,566 34,005
62,084 26,478 (48O.O'JO)
8.577 4.028 13.772 21.694
lJ.M/S l.057 5.4',Ed
31.860 28,800 71,000 20,000
lH.000 10,700 1.530,000
49.91 64.32 50.47 19.51
39.!~8 28.48 13.00
Page 43
GAO/APMD+MO Tennessee Valley Authority
This is trial version
www.adultpdf.com
Supplemental Schedules
St 10 production
Operation
Supervision and engineering
PU.1
steam
Electric
Miscellaneous
Total operation
ll4intenmce
Supervision and maginearing
StNCtUtXS
Boiler plant
Electric plmt
Wiscells".ous plant
Total maintenance
Provision for depreciation
Tot*1
wh generated less station
us. (thousands)
Tot.1 production expense
includin& depreciation
per kvh (nill#)
1nst.ll.d capacity .t
s*pt.mb.r 30. 1987
(kilowatts)
Patio of .".F.k. aron*
&.n.ration to installed
capacity (percent)
Total Cumberhnd
Paradise Widow Cr.& Shsmee
8
X.086,168 $ 2.678,829 $ 2.813.848 $ 2.201.989 S 1.934.982
1.150.588.352 194.789.529
147.131.446 83.177.740
85.657.842
32.673,911
2.683.434
6,548.502 5.115.888
3.278.318
11.564.874 820,435
1,137.981 1.272.468
1.316.455
29.614.777 4.237.097
3.833.937 4.076.510
2.510.190
1.245.528.082 205,209.324
161,465.714 95.844.595 94,697.787
8.655.081 1.435.047
1.215.923
800,500 692,953
7.853.803 858.751
775,068 936.032 853,164
89,748.639 10.914.602
14.047.071
12,416.297 6.450.996
32.178.063 4.148.856
3.895.689 1.923.386 6.002.231
6,058,046 1.554,313
15.596
1.347,298 (813,344
144.493.632 18.971,569
19.949.347 17,423.513 13,186,OOO
125.079.829 19.295.799
26.312.115 15,823.057 9.976.432
11.515,101.543 $243.476.692 $207,727,176 $129,091,165 $117,860,219
78.631.620 14.046.154
10.854.672 5.572.794
5,732.888
19.268 17.334
19.137 23.165
20.559
17.647.360
2.600.000
2.558.200 1.968.760 1.750.000
54.25
64.58
52.30 34.56 40.49
Page 44
GAO/v Tennessee Valley Authority
This is trial version
www.adultpdf.com
Supplemental Schedules
Kingston Johnsonville Colbert
Callatin
Bull Bun
John Sevier Watts BP= Thornsn H. Allen
1 1.832.866
$
1.837.686
$
1.602,570
$
1.642.847
$
1.375,787
$
1,610.622
126.496.867
7tl,723.597 148,929,925 87.143.061 85.666.549 62.649.013
3.045.504 3.072.088 2.762.117
1.912.672 1,306.268
1,586.941
1.417.041
1.413.756
1.254.247 907.595 700,904
780,312
2.465.348
2.147.196 2,293,907 2,314,252 1,987.800
1.659.621
135.257.626 B7,194,323 156.842,766 93.920.427
91,037,308 68.286.509
697,629 644,111 413.905
649.160
565,159
1.135.000
454.505
715,769
1.068.919
328.052 457,584
717.336
7.710,760
6.190.192 6.081,292 8,081.591
6,499.520 3.753.842
2.202,613 3,331.163 1.582.662 3.843.025 1,792,101
1.660.506
222,686
699,078
446.897
809.176
811,533
299,057
11.288.193
11,640,313
9,593,675 13.111.004 10.125,897
7,565,741
8,760.678
10,753.409 9,8.0,413 7.716.090 6,472,700
4.221.462
695.015
5.212,659
$155.306.497 $109.588.045 $176,276.854 $115,347,521 $107,635,905 $80.073.712
$882.430 $71.835.327
$
44,888
3,143
18.417
58.372
124,820
10,260
6,057
41,350
421
4
so7
A
62.595
s 1.509.254
50.222.783
1.359.036
525,263
2.030.547
55.646.883
395,434
622,566
7.501.126
1.795.410
661.249
10,975,785
9,479.742 5.522.070 7.841.785 5.935.131 4.755.737
5.052.444 (1.804) 3.840.007
16.383
19.845
22.479
19.435
22.633
15.849 18.707
1.700.000 1.485,200 1,350.000 1.255.200 950,000
800,000 240,000 990,000
68.10 46.52 70.14 57.55
59.34
76.36 47.96
Page 45
GAO/AFMD@MO
Tennessee Valley Authority
This is trial version
www.adultpdf.com
Supplemental Schedules
All." Colb.rt Gallatin Johnronvi~
wt.1
CM turbine production
F-u.1 .xp.",.
Other op.r4ti"g expense
Maintenance
Provision for depreciation
Total
kwh
generated Irss ststion use
(thousands)
Tot.1 production expense including
de*reei.tion per kUh (mill*)
In&ll.d cap.& .t
September 30. 1987 (kilowatt.1
Ratio of av.r.g. Lg-0.s 8e"eration
to installed cop.eity (percent)
8ro""s Perry
Sequoyah
Total
Ihrcl.sr production
operation
Supervision and engineering.
Pu*1
Coolants and rater
Stem
Electric
Mise.lla".ous
Total op.PPtLO"
tlaintwxance
Supervision and engineering
StNCt"r.*
fl.*ctor plant
Electric plant
nise.lln".ous plant
Tot.1 nui"te"."c.
provision for depreciation
$ 78.166.586
8 84,867.579 $163.034.165
9.200,879 1.250.499
10.451.378
395.023 1.565.916 1.960.939
15.216;902
3;286;985 18;503;887
4.360,930 1.055,119
5.416.049
25,755,491
3k,815,995 60,571,486
133,095,811
126,842,093 259.937.904
25.897.399
6.039,579
11.532.969
5.346.445
5;950;155
54.766.547
42.220.066
41.961.469 67.858.868
5.718.153 11.757.732
16.815.602 28,348.571
5.895.248
11.241.693
2,815,454 8,765.609
73.205.926
127,972.473
61.379.074 103,599.140
Total
$230.082,424
$261.427.093
$491.509.517
kwh 8enerst.d less station us.
(thous.nds)
(100.394)
(112.295)
(212.689)
1"st.Ll.d cspscity at Septenbcr 30.
1987 (kilowatts)
3.456.000 2.441.160
5.897.160
Transmission
Operation
Supervision and engineering
Lad disp.tching
Stations
Overh d lines
Tr.nsmissio" of electricity by others
lisc.lla".ous
mnt*
TotaL op.r.tion
Maintenance
Supervision and engineerin
StNCtUCes
St.tion equipment
Overhead lines
Iliscell.n.ous plsnt
Tot41 auintensnce
$ 10.562.236
2.377.109
4.092.493
1.264.218
88,738
6.102.476
3.668.746
28.156.016
154.424
947.953
9.114.088
7.652.485
794,701
18.663.651
Tot.1
$ 46.819.667
8 305.379 8 544.572
77,272
45.824
382,651
590.396
423.898 171,225
2.115.423
1.744.571
82.921,972 $2 SO6 192
I
3,652
800.102
620,800
.12
12,913
194.083
476,000
37
$ 339.468
9,665
349,133
138,469
1 217 352
I
$1.704,954
5,992
284.538
325.200
.29
8 615.566 8 1.804.98S
21.314 154.075
636.880 l.PS9.060
251.291 984.883
3.472,364 8,549,710
$4.360.535 $11.493,653
~ ~
7,082
29,639
615.721 387.788
1.088.000 2.510.000
.14
.20
Page 46
GAO/AFMD-%M Tennessee Valley Authority
This is trial version
www.adultpdf.com
Supplemental Schedules
cu.toYr l ccount.
n0t.r r di~
cu.towr r.eDrd. .“d co11.ction.
Uneoll.ctibl. .ec.u"t.
Ll
rowor con-r m.rvic*.
Amwtiretion - d.f.rr.d con rv.ti.” c0.t.
Cycle md S.Y. program,
Sup.rvi.ion .“d g.n.r.1
LO." 10,. .*.n
Tot.1
8 10.429.2s2
1.464.826
194.963
3.171.617
s 15.(166.,4(1
mwn.tC~tio"
Of
9ow.r US.
Amortizetim - d.f.rr.d co" rv.tion cwt.
Su9.rvi.i.n .nd 1.n.t.1
Colurcial md indu.tri.1
Indu.tri.1 aurk.tinS
la r.imbur.aant. from p0v.r di.tributor. for
technical advieory ,.rvie
Tot.1
$ 35,876,7lS
7,332.758
1.386.060
l.lSS.775
65.781.311
(721.289)
$ 45.060.022
R rch. d.v.lopmt. ."d dwn.tr.tioru
rrn"sQil*io"
Nmon.tr.tion of 9ow.r u
Administratlv. and S.n.r.1
other
Tot.1
$ 4.139.609
5.606.870
12.6~2.813
32.125.549
1 54.914.s41
Adai"istrntiv. end S.en.r.1
DiC.CL
Dpm-~tion
sa1.rt.1
Offlc. wppli.9 ."d .xp.n
I tr.“.f.r. to c.“.tWCtLo” .“d 0th.r
.ecountr
Outride r.rvic q1oy.d
Property inaurmce
Injurl end daub
Employ*.
p.n.io”
b.".fit ."d llCA
Prop.rty l drl”l.tr.tiD”
9wehmi~ l
d
other rvie.,
nt.c.11.n*ml.
Pent.
Sl.ctrlcity
u d
by .hop. .“d 1.bor.tori.a
Tot.1 op*r.tion
llnint."."e.
c."*r.1 prop.rty
Tot.1 dir.ct
Al1oe.ti.n from
nonpar
d1vi.i.n.
TVA g.rur.1 office.
Dir.ct; .ch.dul. y
Ihrltipl u ; .ch.dul. S
Wt.1 .dmini.tr.tiv. and S.n.r.1 ch.rg.d to
9ow.r op.r.tion.
t38,419.(173
30.696.317 $ 60.976.190
(36.845.795)
32.130.395
311,597
9.566.181
1.721.14.
134.221.246
11.322.3OS
28.S28.035
13.006,231
35,576,606
(630,010)
266.058.333
928,043
266.986.376
54.692.250
194.641 54.SS6.897
332l.S73,273
Page 47
GAO/m Tennessee Valley Authority
This is trial version
www.adultpdf.com
Supplemental Schedules
Schedule D-Details of Nonpower Net Expense
Ilultiple-use
Dir.ct (sch.dule El
Tot.1
YATUML RRsDuRcEs DSYeLOPaeYT
Y.vig.tion oper.tion.
Studio. and inve.tig.tion.
Y.viS.tion enSineerinS and investiS.tions
Goner.1 snd .daini.tmtivc expenses
Operation snd mintennncs of facilities
op.r.tion
tbintanmce
Goner.1 .nd .dministr.tive expenses
Provision for depreciation
$1.486,318 8 -
: 1.486.318
36,092 -
36,092
1.522.410
1.522.410
- 4.426,933
4.426,933
- 1.201.506
1.207.506
143.619
143.619
3.526.905
1.252.391
4.779.296
Tot.1 expense of n.viS.tion operstioru
System flood eontroi oper.tions
Studio. snd investiS.tions
System studies and inv.stigstions
Goner.1 snd administrative expenses
Oper.tio” snd m.intensnee of fscilitie.
Oper.tion
M.i”t.“.ncs
Cener.1 .nd administrative axpe” s
Provision for depreciation
Tot.1 erpans. of sy,t.m flood control opemtion.
$5.049.315 0,030.449
12.079,764
~ ___
a 454.191 s -
454,191
11.317 -
11.317
465.508
465.508
- 6.057.907
6.057.907
- 1.195.577 1.495.577
- 202,572
202.572
380,409 1,410,54.3
1,790,952
-
$9.166.599 s 845,917
10.012.516
Recre.tion developnsnt
Recre.tion development
Cmer.1 and administrative exp.n.es
Operation md Rni”tm.nee of fscilitles
Operation and m.inten.nca
Goner.1 .nd administrative oxpen
Provision for depreci.tion
Tot.1 expense of recre.tion dsvclopmmt
$1,607.514 S
1.607.514
20.364 -
20.364
1.627.878
1.627.87S
- 6.603.663
6.603.663
213,916
213,916
370,517 702.819
1,081.396
$2.006,395 $7,520,45S
9.526,853
- -
Economic projects and dmon.tr.tions
SconomIc projects and d.mmstr.tionn
$4.350.446 $ -
4.350.446
Cmar.1 .nd .dministr.tive expenses
96,148 -
96.140
4
* I
4.446.594
Oper.tion 4nd m.inten.nce of fseilitie.
Operation and nuintmmc. 764,810
764.810
Gmec.1 and .dministrstive expenses 24,743 24,743
Provision for depreciation 1.852 337,009
336,861
Tot.1 expense of economic projects .nd demonstrations 14,44a,44s $1.126.562
5.575,OOS
~ -
SeSion.1 r.ter quality man.Smn.nt
ReSion.1 w.t.r quality ma”.*mcnt
Provision for d.preci.tion
Cm.r.1 .nd administrative expenses
Total oxpen*. of region.1 r*ter qu.lity mm.Scment
Pi.hertes and wildlife r ources d.velopawnt
Pilheri resource. dsvslopmmt
Uildlifc rasoureas d.vsloPmmt
Provision for depreciation
Ceneral snd administrative .xpen.ss
Tot.1 expense of fisheries and wildlife r.source. dcvalopmmt
4.145.447
29,465
100.655
4.275.567
583.700
813.214
72.090
33.919
1.503.723
Page 48 GAO/APMD&MO Tennessee Valley Authority
This is trial version
www.adultpdf.com