Novel Applications of the UWB Technologies Part 14 docx
Bạn đang xem bản rút gọn của tài liệu. Xem và tải ngay bản đầy đủ của tài liệu tại đây (658.14 KB, 30 trang )
Full-Wave Modelling of Ground-Penetrating Radars:
Antenna Mutual Coupling Phenomena and Sub-Surface Scattering Processes
377
(0) (0)
11 22
CC
0.579
p
F
(0)
21
C
14.562
f
F
(0)
n
1
(1) (1)
11 22
RR
208.073
(1) (1)
11 22
LL
0.141 H
(1) (1)
11 22
CC
1.565
p
F
(1)
21
R
1.307 k
(1)
21
L
1.507 H
(1)
21
C
0.147
p
F
(1)
n
1
(2) (2)
11 22
RR
322.581
(2) (2)
11 22
LL
0.092 H
(2) (2)
11 22
CC
0.235
p
F
(2)
21
R
1.838 k
(2)
21
L
1.084 H
(2)
21
C
0.020
p
F
(2)
n
1
Table 1. Circuital parameters relevant to the equivalent circuit of the antenna pair. Structure
characteristics:
40
d
lcm
, 5
d
Dmm
, 2.5mm
, 20
d
scm
, 3
d
hcm
.
6. Conclusion
The full-wave analysis of electromagnetic sensing of buried pipes with GPR in realistic
scenarios has been carried out. An enhanced locally conformal FDTD technique, useful to
accurately model complex electromagnetic structures as well as ground-embedded
inhomogeneities with arbitrary shape and material parameters, has been adopted. By using
this scheme, an extensive parametric analysis of the antenna scattering parameters and
radiated near-field spatial distribution has been performed for different Tx–Rx antenna
separations and elevations over the ground, taking into account the presence of buried
metallic and dielectric targets, as well as soil-embedded ellipsoidal inhomogeneities with
arbitrary size, location and electrical properties. The obtained numerical results provide a
physical insight into the underlying mechanisms of subsurface scattering and antenna
mutual coupling processes. Finally, a frequency-independent equivalent circuit, useful to be
employed in CAD tools, has been derived from the antenna scattering parameters, showing
that including the effect of just a few resonant modes yields high numerical accuracy.
Novel Applications of the UWB Technologies
378
7. Appendix
In order to validate the accuracy of the proposed locally conformal FDTD scheme a number
of test cases have been considered. Here the results obtained for the computation of the
fundamental resonant frequency of a dielectric resonator enclosed in a metallic cavity are
presented. The structure under consideration (see Fig. 13a) has been already analyzed in [5].
It consists of a perfectly conducting metallic cavity of dimensions
50ab mm and
30cmm , loaded with a cylindrical dielectric (ceramic) puck having diameter 36Dmm ,
(a)
(b)
Fig. 13. Geometry of a dielectric loaded rectangular cavity (a), and behaviour of the relevant
fundamental resonant frequency
r
f
as function of the FDTD mesh size h
(b). Shown is the
confidence region where the relative error
r
e with respect to the reference resonant
frequency
1.625
r
GHz [5] is smaller than 0.1% . Structure characteristics: 50ab mm ,
30cmm , 36Dmm , 16tmm
, 7hmm
. Relative permittivity of the dielectric puck:
37
r
.
Full-Wave Modelling of Ground-Penetrating Radars:
Antenna Mutual Coupling Phenomena and Sub-Surface Scattering Processes
379
height 16tmm and relative dielectric constant 37
r
. The puck is suspended at a
distance of
7hmm from the bottom of the cavity. Since the dielectric permittivity of the
resonator is rather high, the effect of the orthogonal Cartesian mesh being not conform to
the resonator shape is expected to be noticeable. Here the structure is analyzed by means of
a standard FDTD scheme featuring the traditional staircase approximation of the resonator’s
contour, and by means of the weighted averaging approach proposed in [7], and the locally
conformal FDTD technique detailed in Section III. The numerical results obtained from these
FDTD schemes are compared against the ones reported in [5] resulting from the use of a
commercial Transmission Line Matrix (TLM) method-based solver. To this end, a cubic
FDTD mesh having fixed spatial increment h
has been adopted to analyze the structure.
As it appears in Fig. 13b, this example clearly demonstrates the suitability of the proposed
approach to efficiently handle complex metal-dielectric structures with curved boundaries.
The proposed locally FDTD scheme introduces a significant improvement in accuracy over
the stair-casing approximation, converging very quickly to the reference value. Such feature
is thus of crucial importance to optimize the design of antennas for ground-penetrating
radar applications.
8. References
[1] Caratelli D. & Cicchetti R., (2003). A full-wave analysis of interdigital capacitors for
planar integrated circuits, IEEE Trans. Magnetics, Vol. 39(No. 3): 1598–1601.
[2]
Caratelli D., Cicchetti R., Bit-Babik G., & Faraone A., (2006). A perturbed E-shaped
patch antenna for wideband WLAN applications, IEEE Trans. Antennas Propagat.,
Vol. 54(No. 6): 1871–1874.
[3]
Caratelli D., Yarovoy A., & Ligthart L. P., (2007). Antennas for ground-penetrating
radar applications, Delft University of Technology, Tech. Rep. IRCTR–S–032–07.
[4]
Caratelli D., Yarovoy A., & Ligthart L. P., (2008). Full-wave analysis of cavity-backed
resistively-loaded bow-tie antennas for GPR applications, Proc. European Microwave
Conference, Amsterdam, the Netherlands, pp. 204-207.
[5]
Chuma J., Sim C. W., & Mirshekar-Syahkal D., (1999). Computation of resonant
frequencies of dielectric loaded rectangular cavity using TLM method, IET Electron.
Lett., Vol. 35(No. 20): 1712–1713.
[6]
Daniels D., (2004). Ground Penetrating Radar, 2nd ed., IEE Press.
[7]
Dey S. & Mittra R., (1999). A conformal finite-difference time-domain technique for
modeling cylindrical dielectric resonators, IEEE Trans. Microwave Theory Tech., Vol.
47(No. 9): 1737–1739.
[8]
Fletcher R., (1980). Practical methods of optimization, John Wiley.
[9]
Freundorfer A., Iizuka K., & Ramseier R., (1984). A method of determining electrical
properties of geophysical media, J. Appl. Phys., Vol. 55: 218–222.
[10]
Guillemin E. A., (1965). Synthesis of Passive Network: Theory and Methods Appropriate to
the Realization and Approximation Problems, John Wiley.
[11]
Gürel L. & Oguz U., (2001). Simulations of ground-penetrating radars over lossy and
heterogeneous grounds, IEEE Trans. Geosci. Remote Sensing, Vol. 39(No. 6): 1190–
1197.
Novel Applications of the UWB Technologies
380
[12] Gürel L. & Oguz U., (2003). Optimization of the transmitter–receiver separation in the
ground-penetrating radar, IEEE Trans. Antennas Propagat., Vol. 51(No. 3): 362–370.
[13]
lizuka K., Freundorfer A. P., Wu K. H., Mori H., Ogura H., & Nguyen V., (1984). Step-
frequency radar, J. Appl. Phys., Vol. 56: 2572–2583.
[14]
Kaneda N., Houshmand B., & Itoh T., (1997). FDTD analysis of dielectric resonators
with curved surfaces, IEEE Trans. Microwave Theory Tech., Vol. 45(No. 9): 1645–1649.
[15]
Maloney J. G. & Smith G. S., (1993). A study of transient radiation from the Wu-King
resistive monopole – FDTD analysis and experimental measurements, IEEE Trans.
Antennas Propagat., Vol. 41(No. 5): 668–676.
[16]
Montoya T. P. & Smith G. S., (1996). A study of pulse radiation from several broad-
band loaded monopoles, IEEE Trans. Antennas Propagat., Vol. 44(No. 8): 1172–1182.
[17]
Moray R. M., (1974). Continuous subsurface profiling by impulse radar, Proc. Eng.
Found. Conf. Amer. Soc. Civil Eng., pp. 213–232.
[18]
Peter L. Jr., Young J. D., & Daniels J., (1994). Ground penetration radar as a subsurface
environmental sensing tool, Proc. IEEE, Vol. 82: 1802–1822.
[19]
Taflove A. & Hagness S. C., (2005) Computational Electrodynamics: The Finite Difference
Time Domain Method, 3rd ed., Artech House.
[20]
Timmins I. & Wu K., (2000). An efficient systematic approach to model extraction for
passive microwave circuits, IEEE Trans. Microwave Theory Tech., Vol. 48(No. 9):
1565–1573.
[21]
Yee K. S., (1966). Numerical solution of initial boundary value problems involving
Maxwell’s equations, IEEE Trans. Antennas Propagat., Vol. 14(No. 3): 302–307.
18
Impact of Ultra Wide Band Emission on
Next Generation Weather RADAR and
the Downlink of UMTS2600
Bazil Taha Ahmed
1
and Miguel Calvo Ramon
2
1
Universidad Autonoma de Madrid,
2
Universidad Politecnica de Madrid
Spain
1. Introduction
The Federal Communications Commission (FCC) agreed in February 2002 to allocate 7.5
GHz of spectrum for unlicensed use of ultra-wideband (UWB) devices for communication
applications in the 3.1–10.6 GHz frequency band, the move represented a victory in a long
hard-fought battle that dated back decades. With its origins in the 1960s, when it was called
time-domain electromagnetic, UWB came to be known for the operation of sending and
receiving extremely short bursts of RF energy. With its outstanding ability for applications
that require precision distance or positioning measurements, as well as high-speed wireless
connectivity, the largest spectrum allocation ever granted by the FCC is unique because it
overlaps other services in the same frequency of operation. Previous spectrum allocations
for unlicensed use, such as the Unlicensed National Information Infrastructure (UNII) band
have opened up bandwidth dedicated to unlicensed devices based on the assumption that
“operation is subject to the following two conditions:
1. This device may not cause harmful interference. Harmful interference is defined as
interference that seriously degrades, obstructs or repeatedly interrupts a radio
communication service.
2. This device must accept any interference received, including interference that may
cause undesired operation. This means that devices using unlicensed spectrum must be
designed to coexist in an uncontrolled environment.
Devices utilizing UWB spectrum operate according to similar rules, but they are subject to
more stringent requirements because UWB spectrum underlays other existing licensed and
unlicensed spectrum allocations. In order to optimize spectrum use and reduce interference
to existing services, the FCC’s regulations are very conservative and require very low
emitted power.
UWB has a number of advantages which make it attractive for consumer communications
applications. In particular, UWB systems
- Have potentially low complexity and low cost;
- Have noise-like signal characteristics;
- Are resistant to severe multipath and jamming;
- Have very good time domain resolution.
Novel Applications of the UWB Technologies
382
In 1988, the NEXRAD Agencies established the WSR-88D (Weather Surveillance Radar 88
Doppler) Radar Operations Centre (ROC) in Norman, Oklahoma. The ROC employees come
from the National Weather Service, Air Force, Navy, FAA, and support contractors. The
ROC provides centralized meteorological, software, maintenance, and engineering support
for all WSR-88D systems. WSR-88D systems will be modified and enhanced during their
operational life to meet changing requirements, technology advances, and improved
understanding of the application of these systems to real-time weather operations. The ROC
also operates WSR-88D test systems for the development of hardware and software
upgrades to enhance maintenance, operation, and provide new functionality.
NEXRAD is used to warn the people of the United States about dangerous weather and its
location. Meteorologists can now warn the public to take shelter with more notice than any
previous radar. There are 158 operational NEXRAD radar systems deployed throughout the
United States and at selected overseas locations. The maximum range of the NEXRAD radar is
250 nautical miles. The NEXRAD network provides significant improvements in severe
weather and flash flood warnings, air traffic safety, flow control for air traffic, resource
protection at military bases, and management of water, agriculture, forest, and snow removal.
The spectrum for UMTS lies between 1900 MHz to 2025 MHz and 2110 MHz to 2200 MHz.
For the satellite service an own sub-band in the UMTS spectrum is reserved (uplink 1980
MHz to 2010 MHz, downlink 2170 MHz to 2200 MHz). The remaining spectrum for
terrestrial use is divided between two modes of operation. In the FDD (Frequency Division
Duplex) mode there are two equal bands for the uplink (1920 MHz to 1980 MHz) and for the
downlink (2110 MHz to 2170 MHz). In the operation mode TDD (Time division duplex)
uplink and downlink are not divided by use of different frequency carriers but by using
different timeslots on the same carrier. So there is no need for a symmetrical spectrum but
the remaining unpaired spectrum can be used.
The European Conference of Postal and Telecommunications administrations (CEPT) have
recommended that the 2500-2690 MHz band should be reserved for the use by licensed
UMTS services. It has been recommended that the 2500-2570 and 2620-2690 MHz bands
should be paired for UMTS FDD deployment with frequency blocks in multiples of 5 MHz.
Here after we will dominate this system by UMTS2600.
In (Hamalainen et al., 2002) the coexistence of the UWB system with GSM900,
UMTS/WCDMA, and GPS has been investigated. They have evaluated the level of the
interference caused by different UWB signal to the three up mentioned systems. Also they
have evaluated the performance degradation of UWB systems in the presence of narrow
bandwidth interference and pulsed jamming. They have given the bit error rate (BER) of the
above mentioned systems for different pulse length.
In (Hamalainen et al., 2004) the coexistence of the UWB system with IEEE802.11a and UMTS
in Modified Saleh-Valenzuela Channel has been studied. The UWB system performance has
been studied in the presence of multiband interference. The interference sources considered
are IEEE802.11a and UMTS which are operating simultaneously with their maximum
system bandwidths. The system under consideration is single band and single user UWB
link operating at data rate of 100 Mbps without error correction coding. They have given the
bit error rate (BER) of the UWB system for different types of modulation (Direct sequence
and Time Hopping).
The interference between the UMTS and the UWB system has been studied in (Giuliano et
al, 2003). The free space propagation model has been used to calculate the UWB signal
propagation loss. It has been concluded that, a carrier frequency of 3.5 GHz is the minimum
Impact of Ultra Wide Band Emission on
Next Generation Weather RADAR and the Downlink of UMTS2600
383
allowable value for UWB device transmitting at 100 Mbps in order to avoid harmful
interference between UMTS and UWB. In (Hamalainen et al., 2001a), the effect of the in
band interference power caused by different kinds of UWB signal at UMTS/WCDMA
uplink and downlink frequency bands has been investigated. UWB frequency spectra have
been produced by using several types of narrow pulse waveforms. They have concluded
that one can reduce interfering UWB power by using different waveforms and pulse widths
to avoid UMTS frequencies without any additional filtering. In (Hamalainen et al., 2001 b)
the effect of the in band interference power caused by three different kinds of UWB signal
on GPS L1 and GSM-900 uplink band has been studied. UWB frequency spectra have been
generated by using several types of narrow pulse waveforms based on Gaussian pulse. In
band interference power has been calculated over the IF bandwidth of the two victim
receiver as a function of the UWB pulse width. Also the signal attenuation with distance has
been presented.
In (Ahmed et al., 2004), the effect of the UWB on the DCS-1800 and GSM-900 macrocell
downlink absolute range using the (Line of Sight) propagation model between the UWB
transmitter and the mobile receiver has been studied without taking into account the
shadowing factor within the propagation loss model.
In (ITU, 2003), the effect of UWB system on fixed service system (point to point and Fixed
Wireless Access (FWA) systems in bands from 1 to 6 GHz has been investigated. It has been
concluded that, when the UWB transmitter is in LOS with the two systems antennas, the
effect is very high when the UWB power density is -41.3 dBm/MHz.
2. UWB effect on the NEXRAD
RADAR systems performance (detection) is almost the optimum when the Signal to Noise
Ratio (SNR) is 16 dB or more. Any extra interference due to communications systems
degrades the performance (probability of detection with constant range or the range with
constant probability of detection) of the radar system. Thus, the extra interference should
not exceed a given value. In practice, extra interference should be within the following
range:
0.1
extra n RADAR
IP
(1)
where
I
extra
is the extra interference due to other communications systems,
P
n-RADAR
is the RADAR receiver noise calculated as:
10( ) 114 10 lo
g
()()
n RADAR MHZ
PdB BWNFdB
(2)
where
BW
MHz
is the radar system IF bandwidth measured by MHz .
NF(dB) is the RADAR receiver noise figure measured in dB.
The UWB interference power I
UWB
is calculated by:
()
UWB UWB UWB exra Ant
IPLdLG (3)
where
P
UWB
is the UWB EIRP in dBm in the radar band,
Novel Applications of the UWB Technologies
384
L
UWB
(d) is the propagation loss between the UWB device and the RADAR system as a
function of the distance between the UWB source and the radar,
L
extra
is the extra propagation loss due to tree or building insertion loss when is
applicable,
G
Ant
is the RADAR antenna gain in the direction of the UWB transmitter.
is the second propagation exponent of the UWB signal with a typical value of 4 to 5
depending on the surrounding environment.
Using the Two-Slope Propagation Model, the UWB signal propagation loss L
UWB
in dB at a
distance d can be given as (Ciccoganini et al., 2005):
10
10 10
4
20log
()
4
20log 10 log
b
UWB
b
b
b
d
dR
Ld
R
d
Rd
R
(4)
where λ is the wavelength and R
b
is the break point distance given by (Ahmed et al., 2002):
4
UWB RADAR
b
hh
R
(5)
where
h
UWB
is the UWB antenna height,
h
RADAR
is the RADAR antenna height.
3. UWB effect on the UMTS2600 downlink performance
To account for UWB interference, an extra source of interference is added linearly to the
UMTS2600 intracellular interference I
UMTS
. The interference power is calculated by assuming
the UWB source to be at different distances from the UMTS2600 receiver (the mobile
station). Therefore, the interference power generated by a device UWB, I
UWB
, is given by (in
dBm) (Ahmed, Ramon, 2008):
()
UWB UWB UWB UMTS
IPLdG (6)
where
P
UWB
is the UWB EIRP in dBm in the UMTS2600 band.
L
UWB
(d) is the path-loss between the UWB device and the UMTS2600 receiver which
varies with the separation distance, d in m, and
G
UMTS
is the UMTS2600 antenna gain.
Given that UWB devices are typically low power, short range devices, then the line-of-sight
path-loss model is often most appropriate for distances less than 5m. Thus the UWB signal
propagation loss in dB is calculated as (Ahmed, Ramon, 2008):
10 10 10
4
() 20lo
g
20 lo
g
( ) 40.92 20lo
g
()
UWB
Ld d d
(7)
where λ is the wavelength at an operating frequency of 2.655 GHz.
Impact of Ultra Wide Band Emission on
Next Generation Weather RADAR and the Downlink of UMTS2600
385
The effect of the UWB interference is to reduce the UMTS2600 macrocell range or/and the
macrocell capacity.
The macrocell downlink range R
UMTS
with the existence of the UWB interference is given as
(Ahmed, Ramon, 2008):
,
UMTS
s
UMTS UMTS o
UMTS UWB
I
RR
II
(8)
where RUMTS,o is the UMTS2600 downlink range without UWB interference.
The UMTS2600 normalized macrocell range R
n
is given as:
,
UMTS UMTS
s
n
UMYTS o UMTS UWB
RI
R
RII
(9)
where s is the UMTS2600 outdoor signal propagation exponent (3.5 to 4.5).
The UMTS2600 normalized downlink capacity C
n
is given as (Ahmed, Ramon, 2008):
,
UMTS UMTS
n
UMTS o UMTS UWB
CI
C
CII
(10)
where C
UMTS
is the UMTS2600 downlink capacity with the UWB interference, and C
UMTS,o
is
the UMTS2600 downlink capacity without the UWB interference.
4. Results
For an outdoor environment (UWB transmitter out side of any building), the FCC
maximum permitted UWB EIRP power density for the frequency range 2.7 to 3.0 GHz is -
61.3 dBm/MHz while it is -51.3 dBm/MHz for indoor environment (UWB transmitter is
within a given building).
We study the effect of the UWB system on the NEXRAD system assuming that the RADAR
receiver noise is – 114 dBm, its operating frequency is 2.9 GHz, the second propagation
exponent α is 4 and that its antenna height is 30 m. Here we have assumed that, the UWB
maximum allowed interference is -124 dBm (10 dB protection) which give a rise to about
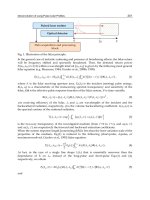
2.5% reduction of the NEXRAD range. Fig. 1 shows the NEXRAD vertical pattern.
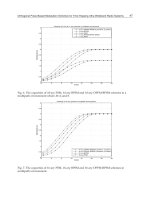
Fig. 2 shows the acceptable UWB power density for three different UWB antenna heights. It
can be noticed that the coordinate distance (minimum distance between the UWB
transmitter and the Radar) is almost 0 km when the UWB antenna height is 3 m. The
coordinate distance will be 1.12 and 1.50 km when the UWB antenna height is 15 and 30 m
respectively. Second and third cases (UWB antenna height of 15 to 30 m) should be avoided
as far as possible. At an UWB antenna height of 30m, the UWB interference will be injected
to the NEXRAD receiver through the NEXRAD antenna main-lobe. Thus, the UWB effect
will be the maximum.
Fig. 3 shows the acceptable UWB power density for three different UWB antenna heights
assuming that some trees are between the UWB antenna and the RADAR antenna and that
the tree absorption loss is 10 dB. It can be noticed that the coordinate distance is 0 km when
the UWB antenna height is 3 m. The coordinate distance will be 0 and 0.48 km when the
UWB antenna height is 15 and 30 m respectively.
Novel Applications of the UWB Technologies
386
Fig. 4 shows the acceptable UWB power density for three different UWB antenna heights
assuming that the UWB transmitter is within a high building and that the wall absorption
loss is 10 dB. It can be noticed that the coordinate distance is 0 km when the UWB antenna
height is 3 m. The coordinate distance will be 1.12 and 1.50 km when the UWB antenna
height is 15 and 30 m respectively.
For the above three mentioned cases, it has been assumed that, the RADAR main beam is in
the direction of the UWB transmitter and that the RADAR antenna has a tilt of 0.0
o
.
Fig. 5 shows the acceptable UWB power density for three different UWB antennas tilting
assuming that the UWB antenna height is 3 m. It can be noticed that the coordinate distance
is 0 km when the UWB antenna tilt is 0
o
. Also, the coordinate distance will be 0 km when the
UWB antenna tilt is 3
o
or 6
o
. Thus, the effect of the UWB is null with any positive RADAR
antenna tilt of 3 degrees or more assuming that the UWB antenna height is 3 m.
Fig. 6 shows the acceptable UWB power density for three different UWB antennas tilting
assuming that the UWB antenna height is 30 m. It can be noticed that the coordinate
distance is 1.5 km when the UWB antenna tilt is 0
o
. The coordinate distance will be 0 km for
UWB antenna tilt angle of 3
o
and 6
o
.
The same results are applicable for an operating frequency of 3 GHz. For a distance of 100m
between the UWB transmitter and the Radar, the UWB EIRP power density at 3 GHz should
be -84 dBm/MHz or lower.
-80 -60 -40 -20 0 20 40 60 80
-20
-10
0
10
20
30
40
50
Elevation angle (deg.)
Gain (dB)
Fig. 1. NEXRAD Vertical Antenna Pattern.
Impact of Ultra Wide Band Emission on
Next Generation Weather RADAR and the Downlink of UMTS2600
387
2 4 6 8 10 12 14 16 18 20
-85
-80
-75
-70
-65
-60
-55
-50
-45
-40
-35
-30
Distance from the UWB transmitter (km)
Accepted UWB power density (dBm/MHz)
h
UWB
= 03m
h
UWB
= 15m
h
UWB
= 30m
Fig. 2. Maximum permitted UWB EIRP for an outdoor environment for three different UWB
antenna height (RADAR antenna height = 30m).
2 4 6 8 10 12 14 16 18 20
-85
-80
-75
-70
-65
-60
-55
-50
-45
-40
-35
-30
Distance from the UWB transmitter (km)
Acce pte d UWB pow er de nsity (dBm/ MHz)
h
UWB
= 03m
h
UWB
= 15m
h
UWB
= 30m
Fig. 3. Maximum permitted UWB EIRP for an outdoor environment for three different UWB
antenna height (RADAR antenna height = 30m and 10 dB tree absorption loss).
Novel Applications of the UWB Technologies
388
2 4 6 8 10 12 14 16 18 20
-70
-65
-60
-55
-50
-45
-40
-35
-30
Distance from the UWB transmitter (km)
Accepted UW B pow er density (dBm/MHz)
h
UWB
= 03m
h
UWB
= 15m
h
UWB
= 30m
Fig. 4. Maximum permitted UWB EIRP for an indoor environment for three different UWB
antenna height (RADAR antenna height = 30m and 10 dB wall absorption loss).
2 4 6 8 10 12 14 16 18 20
-80
-70
-60
-50
-40
-30
-20
-10
0
Distance from the UWB transmitter (km)
Accepted UWB pow er density (dBm/MHz)
Tilt = 0 deg.
Tilt = 3 deg.
Tilt = 6 deg.
Fig. 5. Maximum permitted UWB EIRP for an outdoor environment for three RADAR
antenna tilt (UWB antenna height = 3m and RADAR antenna height = 30m).
Impact of Ultra Wide Band Emission on
Next Generation Weather RADAR and the Downlink of UMTS2600
389
2 4 6 8 10 12 14 16 18 20
-80
-70
-60
-50
-40
-30
-20
-10
0
Distance from the UWB tra nsmitte r (km)
Accepte d UWB powe r de nsity (dBm/MHz)
Tilt = 0 deg.
Tilt = 3 deg.
Tilt = 6 deg.
Fig. 6. Maximum permitted UWB EIRP for an outdoor environment for three RADAR
antenna tilt (UWB antenna height = 30m and RADAR antenna height = 30m).
Here we address the effect of the UWB system on the downlink of the UMTS2600 system. In
the analysis we assume that the UWB data rate is higher than the UMTS2600 chip rate, i.e.,
the UWB bit rate is higher than 4 Mbps. In Fig. 7, the UWB interference power on the
UMTS2600 downlink (i.e. interference as seen at the mobile) is plotted assuming an average
P
UWB
of -51.3 dBm/MHz within the UMTS2600 bandwidth.
0 0.5 1 1.5 2 2.5 3 3.5 4 4.5 5
-100
-95
-90
-85
-80
-75
-70
-65
-60
-55
-50
Seperation between the UMTS 2600 mobile and the UWB source (m)
UWB Interference (dBm)
Fig. 7. UWB interference as a function of the separation between the UWB transmitter and
the UMTS2600 mobile (P
UWB
= -51.3 dBm/MHz).
Novel Applications of the UWB Technologies
390
We study the case of voice service (G
p
= 25 dB and (E
b
/N
o
)
req
= 6 dB) (Ahmed, Ramon, 2008)
assuming an UMTS2600 interference of -88 dBm (14 dB noise rise) and UWB power density of
-51.3 dBm/MHz. Fig. 8 shows the downlink macrocell normalized range as a function of the
separation between the UMTS2600 mobile and the UWB transmitter for three different values
of the propagation exponent s. It can be noticed that the UWB signal creates a high interference
which reflects a macrocell normalized range reduction of 26% when the separation is 1m. For
larger separation, the interference is lower and thus the range reduction is also lower.
Fig. 9 shows the downlink macrocell normalized capacity as a function of the separation
between the UMTS2600 mobile and the UWB transmitter for the same UWB power density. It
can be noticed that the UWB signal creates a high interference which gives arise a macrocell
normalized capacity reduction of 66 % when the separation is 1m. For larger separation, the
interference is lower and thus the normalized capacity reduction is also lower.
Thus, it can concluded that, the UWB recommended power density of -51.3 dBm
recommended by FCC is very high and its effect on the UMTS2600 system is dramatic i.e., a
reduction of 26% of the macrocell range or a reduction of 66% of the cell capacity. For this
reason lower UWB power density should be studied.
Let us now study the case data service (G
p
= 14.25 dB and (E
b
/N
o
)
req
= 4.25 dB) assuming an
UMTS2600 total interference of -92.0 dBm (10 dB noise rise and thus highly loaded
macrocell). Fig. 10 shows the downlink macrocell normalized range as a function of the
UWB power density. It can be noticed that for a distance of 1m, the macrocell normalized
range increases with the reduction of the UWB power density. If we consider that the UWB
system is un harmful when the UMTS range reduction is 1% or less then, the recommended
UWB power density should be -74 dBm/MHz or lower. This power density is well below
the FCC and the ETSI recommendations.
0 0.5 1 1.5 2 2.5 3 3.5 4 4.5 5
0.6
0.65
0.7
0.75
0.8
0.85
0.9
0.95
1
Seperation between the UMTS 2600 mobile and the UWB source (m)
Downlink macrocell normalized range
Voice Service
s = 3.5
s = 4.0
s = 4.5
Fig. 8. Effect of the UWB interference on the macrocell range as a function of the separation
between the UWB transmitter and the UMTS2600 mobile (P
UWB
= -51.3 dBm/MHz).
Impact of Ultra Wide Band Emission on
Next Generation Weather RADAR and the Downlink of UMTS2600
391
0 0.5 1 1.5 2 2.5 3 3.5 4 4.5 5
30
40
50
60
70
80
90
100
Seperation between the UMTS 2600 mobile and the UWB source (m)
Downlink capacity (%)
Voice Service
Fig. 9. Effect of the UWB interference on the macrocell normalized capacity as a function of the
separation between the UWB transmitter and the UMTS2600 mobile (P
UWB
= -51.3 dBm/MHz).
-85 -80 -75 -70 -65
94
95
96
97
98
99
100
UWB power density dBm/MHz
Macrocell normalized range %
Fig. 10. Effect of the UWB interference on the macrocell normalized range as a function of
the UWB power density.
Novel Applications of the UWB Technologies
392
Fig. 11 shows the downlink macrocell normalized capacity as a function of the UWB power
density. It can be noticed that for a distance of 1m, the macrocell normalized capacity
increases with the reduction of the UWB power density. If we consider that the UWB system
is un harmful when the UMTS capacity reduction is 1% or less then, the recommended UWB
power density should be -79 dBm/MHz or lower. Also, this power density is well below the
FCC and the ETSI recommendations.
Then we study the case of multiple UWB transmitters with one UWB transmitter at each
44 m
2
area of the indoor environment assuming P
UWB
of -82 dBm/MHz, 18 UWB
transmitters and noise rise of 10 dB. Fig. 12 shows the downlink macrocell normalized range
as a function of the UMTS2600 mobile location for three different values of s. It can be
noticed that the UWB signal creates a high interference which will drastically reduce the
macrocell normalized range when the UMTS receiver is located at 0 to 0.15m. At a distance
higher than 0.4 m from the nearest UWB transmitter, the macrocell range reduction is less
than 1%.
-85 -80 -75 -70 -65
80
82
84
86
88
90
92
94
96
98
100
UWB power density dBm/MHz
Macrocell normalized capacity %
Fig. 11. Effect of the UWB interference on the macrocell normalized capacity as a function
the UWB power density.
Impact of Ultra Wide Band Emission on
Next Generation Weather RADAR and the Downlink of UMTS2600
393
0 0.2 0.4 0.6 0.8 1 1.2 1.4 1.6 1.8 2
0.9
0.92
0.94
0.96
0.98
1
1.02
Location of the UMTS 2600 mobile (m)
Downlink macrocell normalized range
Data Service
s = 3. 5
s = 4. 0
s = 4. 5
Fig. 12. Effect of the UWB interference on the macrocell range as a function of the UMTS2600
mobile location (P
UWB
= -82 dBm/MHz) for multi UWB transmitters and 9.5 dB noise rise.
Fig. 13 shows the downlink macrocell capacity as a function of the UMTS2600 mobile
location. It can be noticed that the UWB signal creates a high interference which produces a
high macrocell normalized capacity reduction when the UMTS2600 receiver is located at a
distance less than 0.2m from the nearest UWB transmitter. For a distance greater than 1m
from the nearest UWB transmitter, the effect of the UWB transmitters is almost null (less
than 1% capacity reduction).
It can be concluded that, for the case of single UWB transmitter, the UMTS2600 can easily
tolerate the UWB interference when the UWB EIRP is -79 dBm/MHz for a distance between
the UWB transmitter and the UMTS mobile of 1m or higher. For the case of multi UWB
transmitter, the UMTS can easily tolerate the UWB interference when the UWB EIRP is -82
dBm/MHz. The above mentioned numbers are valid for highly loaded macrocells, i.e., 90%
loaded macrocell. For lower loaded macrocells (50-70)%, the UMTS2600 system can tolerate
(1.2-3) dB lower UWB power density. If we reduce the critical distance to 0.5m, we have to
lower the maximum accepted UWB power density by 6 dB.
For the common UMTS systems that functions within the band (1.92-2.17) GHz, the tolerable
UWB power density is 2 dB lower than the tolerable UWB power density of UMTS2600, i.e.,
for single UWB transmitter, the common UMTS system can tolerate UWB power density of -
81 dBm/MHz. For multi UWB transmitters, the common UMTS can tolerate UWB power
density of -84 dBm/MHz.
Fig. 14 shows the FCC, ETSI and our recommended UWB power density masks. It can be
noticed that, for a frequency lower than 3.1 GHz, our recommended mask has always lower
accepted UWB power density than the FCC mask. For a frequency of 950 MHz to 3.1 GHz,
our mask has lower accepted UWB power density than the ETSI mask.
Novel Applications of the UWB Technologies
394
0 0.2 0.4 0.6 0.8 1 1.2 1.4 1.6 1.8 2
95
96
97
98
99
100
101
Location of the UMTS 2600 mobile (m)
Downlink capacity (%)
Data Service
Fig. 13. Effect of the UWB interference on the macrocell normalized capacity as a function of
the UMTS2600 mobile location (P
UWB
= -82 dBm/MHz) for multi UWB transmitters and 9.5
dB noise rise.
10
3
10
4
-90
-80
-70
-60
-50
-40
Frequency (MHz)
UWB EIRP level (dBm/MHz)
Our mask
FCC mask
ETSI mask
Fig. 14. FCC, ETSI and our recommended accepted UWB power density.
Impact of Ultra Wide Band Emission on
Next Generation Weather RADAR and the Downlink of UMTS2600
395
5. Conclusions
The effect of the UWB interference on the on Next Generation Weather RADAR (NEXRAD)
has been presented. The coordination distance has been given for different scenarios, i.e., for
different UWB antenna heights, different NEXRAD antenna tilt and when a group of trees
exist between the UWB antenna and the NEXRAD antenna. Also the case of UWB
transmitter in indoor environment has been studied. It has been noticed that, for high
antenna tilt of NEXRAD antenna, the effect of the UWB system is null. When the antenna
heights of both UWB and NEXRAD are the same the effect of the UWB will be the
maximum. Also, it has been noticed that, when a group of trees or a given obstacle exist
between the UWB and NEXRAD antennas, the effect of the UWB system will be lower than
the case of clear path between the antennas of both systems.
The effect of the UWB transmitters on the UMTS2600 downlink for different configuration
and environments has been studied. It has been noticed that, for the case of low UWB power
density (-79 dBm/MHz), the effect of the UWB signals is low when the distance between the
UWB transmitter and the UMTS2600 receiver is greater than 1m. For the case of multi UWB
transmitters, the accepted UWB power density is 1 to 5 dB lower than the accepted UWB
power density of the UWB single transmitter case. The UWB power density reduction
depends on the number of the UWB transmitters and their spatial density, i.e., the higher is
the number of UWB transmitters and their spatial density, higher should be the reduction of
the UWB power density. If we reduce the critical distance to 0.5m, we have to lower the
maximum accepted UWB power density by 6 dB. It has been noticed that, the effect of the
UMTS2600 signal propagation exponent (s) is very little when it has a value of 3.5 to 4.5.
6. References
Ahmed B. T., Ramon M. C. & Ariet L. H., 2002,” Capacity and Interference Statistics of
Highways W-CDMA Cigar-Shaped Microcells (Uplink Analysis), IEEE
Communications Letters, Vol. 6, No. 5, pp. 172-174.
Ahmed B. T., Ramon M. C. & Ariet L. H., 2004, “Impact of Ultra Band (UWB) on Macrocell
Downlink of DCS-1800 and GSM-900 Systems”, Radioenginnering, Vol. 14, No.1,
pp. 51-55.
Ahmed B. T., Ramón M. C.,2008, “On the Impact of Ultra-Wideband (UWB) on Macrocell
Downlink of UMTS and CDMA-450 Systems”, IEEE Electromagnetic Compatibility,
Vol. 5, No. 2, pp. 406-412.
Ciccoganini W., Durantini A., and Cassioli D., 2005, “Time domain propagation
measurements of the UWB Indoor Channel Using PN-Sequence in the FCC-
Compliant Band 3.6-6 GHz”, IEEE trans. Antennas and Propagation, Vol. 53, No. 4,
pp. 1542-1549.
Giuliano R., Mazzenga F., Vatalaro F., “On the interference between UMTS and UWB
systems”, pp: 339 – 343, IEEE Conference on Ultra Wideband Systems and
Technologies, 2003 , 16-19 Nov. 2003.
Hamalinen M., Hovinen V., Iinatti J., Latva-aho M., 2001: "In band Interference Power
Caused by Different Kinds of UWB Signals at UMTS/WCDMA Frequency Bands", ,
the 2001 IEEE Radio and Wireless Conference, RAWCON 2001, pp. 97-100,
Waltham-Boston, Massachusetts, USA, Aug. , 2001.
Novel Applications of the UWB Technologies
396
Hamalinen M., Iinatti J., Hovinen V., Latva-aho M., 2001," In band Interference of Three
Kind of UWB Signals in GPS L1 Band and GSM900 Uplink Band", the 12th
International Symposium on Personal, Indoor and Mobile Radio Communications,
PIMRC2001, pp. D 76-80, USA, Sep - Oct , 2001.
Hamalainen M. , Hovinrn V. , Tesi R., Iinatti J. & Latava-aho M., 2002, “ On the UWB System
Coexistance with GSM900, UMTS/WCDMA, and GPS”, IEEE Journal on Selected
Areas in Communications, Vol. 20, No. 9, pp. 1712-1721.
Hamalinen M., Tesi R., Iinatti J.,” UWB co-existence with IEEE802.11a and UMTS in
modified Saleh-Valenzuela channel”, Ultra Wideband Systems, 2004, pp. 45 – 49,
May 2004.
Holma H. , Toskala A., 2000, “WCDMA for UMTS”, John Wiley & Sons.
ITU Document 1-8/29-E, 2003, “Updating of Preleminary Study on Coexistance Betwwen
UWB and the Fixed Service in Band from 1 to 6 GHz”.
0
High-Precision Time-of-Arrival Estimation for
UWB Localizers in Indoor Multipath Channels
Marzieh Dashti
1
, Mir Ghoraishi
1
, Katsuyuki Haneda
2
and Jun-ichi Takada
1
1
Tokyo Institute of Technology
2
Aalto University School of Science and Technology
1
Japan
2
Finland
1. Introduction
The global positioning system (GPS) has found application in many different fields, in
areas where there is a good line-of-sight (LoS) to GPS satellites, this technique provides a
good estimate of the location of user terminal (UT). However, in indoor and dense urban
environments, localization has always been a more challenging problem for several reasons.
Typically the GPS signal is not strong enough to penetrate through most materials. As soon
as an object obscures the GPS satellite from the UT’s view, the signal is corrupted. This
constrains the usefulness of GPS to open environments, and limits its performance in forests
or in dense urban environments, as retaining a lock on the GPS signals becomes more difficult.
GPS typically becomes completely useless inside buildings. However there is an increasing
need for accurate localization in cluttered e nvironments, in addition to open spaces. In
commercial applications for example, the tracking of inventory in warehouses or cargo ships
is an emerging need. In military applications the problem of blue force tracking, i.e., knowing
where friendly forces are, is of vital importance. This is not a problem in open environments
where systems can rely on GPS, but in dense urban or indoor environment, no satisfactory
solution exists. Navigation in GPS-denied environment is also a pressing military need. For
example untethered robots operating in enclosed environments such as urban canyons or
inside buildings need accurate positioning to safely navigate. Indoor localization is of great
importance for the applications that a person or a vehicle enter a building and accurately
tracking its position over time is needed and the position estimate should have a precision of
under one meter, i.e. on the order of some of the building feature dimensions, such as hallway
width.
1.1 Indoor localization
To address the problem of localization in cluttered environments, deploying a wireless sensor
network (WSN) composed of fixed sensors emitting radio signals is considered in (Jourdan,
2006). Once sensors are deployed, the location of them is known. For example the sensors
can be placed outside and rely on GPS, or UTs can place them inside and determine their
locations by survey or other means (e.g. an accurate map). The UT can then extract range
estimates to the sensors from the received signals (for instance by time-of-arrival (ToA)
estimation), and then use the range estimates in a triangulation technique to determine its own
19
2 Will-be-set-by-IN-TECH
Fig. 1. Indoor localization architecture
position. Among various approaches (Falsi et a l., 2006; Gezici et a l., 2005; Lee & Scholtz, 2002;
Low et al., 2005), use of u ltra-wideband (UWB) signal is a promising technology in particular
for indoor application. The sensors transmit UWB signals in the case, which own inherent
delay resolution and ability to penetrate obstacles (Jourdan, 2006; Win & Scholtz, 1998; 2002).
Further information on the fundamentals of UWB can be found in (Jourdan, 2006) and the
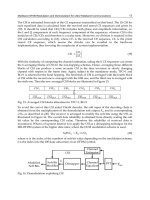
references therein. The indoor localization architecture is illustrated on Fig. 1. Assume an
emergency scenario as an example application of localization, in response to an emergency
in a high rise building, a network of UWB sensors is deployed. These sensors provide a
localization network to responders (or UTs) moving inside the building. The role of the
sensors is to provide the UT with ranges. The UT would broadcast a UWB signal, so that
the sensors each measure the range to the UT, share the information and infer the location of
the UT. The quality of range measurements will degrade with distance, so that the distance
between sensors is of concern. The ranging algorithm can also easily accommodate range
constraints between sensors and UTs (Jourdan, 2006). The described localization architecture
is called user terminal based localization technique, i.e. the localization task is performed
by the UT itself and the sensors do not need to interact with one another to perform the
localization task. The UT-based technology requires the installation of client software on
the UT to determine its location. On the other hand, network-based techniques utilize the
service provider’s network infrastructure to identify the location of the UT. The advantage of
network-based techniques is that they can be implemented non-intrusively, without af fecting
the UTs. One of the key challenges of network-based techniques is the requirement to work
closely with the service provider, as it entails the installation of hardware and software within
the operator’s infrastructure. Often, a legislative framework, such as E911, would need to
be in place to compel the cooperation of the service provider as well as to safeguard the
privacy of the information. The focus of this chapter is exclusively on the range estimation
between UT and AP sensors, and the network architecture is not discussed in remainder of this
chapter. This implies that issues related to the communication connectivity between sensors,
etc., are not presented. Without lost of generality of ranging analysis, any of UT-based or
network-based localization systems can be assumed.
398
Novel Applications of the UWB Technologies
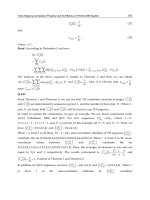
High-Precision Time-of-Arrival Estimation for UWB Localizers in Indoor Multipath Channels 3
Fig. 2. Time-of-arrival triangulation of ranges to determine location
1.2 ToA-based ranging
An appropriate method for the indoor ranging problem is based on timing. Assuming
the sensors and the UT are synchronized in time, the UT can calculate the time of arrival
(time-of-flight) of a signal by comparing its time stamp at transmission to its ToA. This
can then be converted to a d istance by multiplying the time-of-flight by the speed of light.
Since the accuracy of ToA estimation increases with the signal-to-noise ratio (SNR) and the
bandwidth (BW) (Gezici et al., 2005), UWB (for a given SNR) will typically achieve great ToA
accuracy compared to narrower band signals. Note that in general the sensors and the UT will
not have a common time reference, in which case variants of this method must be used. In the
round-trip method, the UT transmits a UWB signal to a certain sensor (IEEE Std, 2007). Once
it is received at the sensor, it is retransmitted and in turn received by the UT. By comparing
the time of original transmission to the ToA (and accounting for the processing time required
for the sensor to retransmit the signal), a time-of-flight can be determined (Lee & Scholtz,
2002). In 2D, three sensors are sufficient to generate a position estimate. Fig. 2 shows t he ToA
triangulation of ranges to determine location. The technique assumes that three (or more)
ranges c
×t
1
, c × t
2
and c × t
3
(where c is speed of light) are gathered from APs i = 1, 2, and
3, respectively, with known locations
(x
i
, y
i
), as in Fig. 2. Solving the set of equations of
⎧
⎪
⎪
⎪
⎨
⎪
⎪
⎪
⎩
c
×t
1
=
(x
1
−x
ut
)
2
+(y
1
−y
ut
)
2
c ×t
2
=
(x
2
−x
ut
)
2
+(y
2
−y
ut
)
2
c ×t
3
=
(x
3
−x
ut
)
2
+(y
3
−y
ut
)
2
(1)
translates to finding the intersection of the three circles (or spheres in three dimensions),
yielding the unknown coordinates of the UT. Time of arrival is appealing due to its application
to the general network architecture, however, the associate asynchronous ranging requires
two or more messages per ranging session. This requirement may potentially increase the
network traffic considerably (Jourdan, 2006). If the AP sensors are synchronized, but not the
UT, t hen the time-of-difference-of-arrival (TDoA) method can be used. In this case the UT
transmits a UWB signal, and the TDoA is computed a t two sensors. The UT is then located on
a h yperbola with foci at the sensors.
399
High-Precision Time-of-Arrival Estimation for UWB Localizers in Indoor Multipath Channels
4 Will-be-set-by-IN-TECH
In the remainder of the chapter, for simplicity and without loss of generality, we assume that
the sensors and the UT have a common time-reference.
1.3 Challenges to UWB ranging
Let’s refer to a range measurement between a transmitter (Tx) and a receiver (Rx) as a direct
path (DP) m easurement if the range is obtained from the signal traveling along a straight line
between the two points. Range measurements are typically corrupted by multipath fading,
thermal noise, DP blockage, and DP excess delay. Multipath fading is due to destructive and
constructive interference of signals at the receiver arriving via different propagation paths.
This makes the detection of DP , if present, challenging. When the received signals are from
reflections, resulting in measured ranges larger than the true distances. The difficulty is due
to DP excess delay incurred by propagation of the partially obstructed DP through different
materials, such as walls. When such a partially obstructed DP signal is observed as first
arrival, the propagation time depends not only upon the traveled distance, but also upon
the materials it encountered. Because the propagation of electro-magnetic signals is slower
in some materials than in the air, the signal arrives with excess delay, again yielding a range
estimate larger than the true one. The effect of DP b lockage and DP excess delay is the same:
they both add a positive bias to the true range between UT and sensor, so that the measured
range is larger than the true value. This positive error has been identified as a limiting factor
in UWB ranging performance (Falsi et al., 2006; Lee & Scholtz, 2002), so it must be accounted.
1.4 Contribution of the chapter
This chapter reviews the ToA estimation algorithms and then employs a threshold-based ToA
estimation algorithm to calculate the range between Tx and Rx nodes in an indoor multipath
environment. A practical threshold setting technique is introduced. For the purpose of this
study, a set of empirical data obtained to create a baseline for comparative performance
evaluation of ranging algorithms. The measured ranging error is used as a c riteria to evaluate
the ToA estimation algorithm.
2. UWB ToA estimation
As described in previous section, ToA estimation technique used with UWB transmission
can be used for accurate indoor ranging. The transmitter sends out a UWB ranging signal
√
E
tx
p
tx
(t) where p
tx
is the monocycle pulse waveform with normalized energy after passing
through a root-raised cosine bandpass filter with bandwidth, BW, adopted from (IEEE Std,
2007), and E
tx
is the pulse energy. Standard UWB pulse with BW=0.5GHz is shown in Fig. 3.
The received UWB signal in multipath channel is represented as
r
(t)=
I
∑
i=0
E
tx
α
i
p
i
(t)+w(t) (2)
where α
i
is the complex path-gain of the ith path assuming I + 1
effective multipaths
in the channel, and w
(t) is zero mean Gaussian random noise with variance σ
2
w
.Inthe
LoS scenario the first arriving multipath is the direct path and the remaining I multipaths
arrive to the receiver after one or more interactions (scattering, reflection, diffraction) in
the channel. It is known that the UWB waveform is distorted during interactions to the
wireless channel. A simplifying assumption is to consider this distortion negligible, i.e.
p
i
(t)=p
tx
(t − τ
i
) with τ
i
= l
i
/c representing the delay of the ith multipath, c is the
400
Novel Applications of the UWB Technologies
High-Precision Time-of-Arrival Estimation for UWB Localizers in Indoor Multipath Channels 5
−10 −5 0 5 10
−0.2
0
0.2
0.4
0.6
0.8
Delay[ns]
Amplitude
Fig. 3. Standard UWB pulse, BW=0.5GHz.
propagation velocity of electromagnetic wave and l
i
is the path length, i.e. the distance ith
path travels from transmitter to receiver. A comparative study of different UWB t ransceivers
employed for ToA estimation is presented in (Guvenc et al., 2006). Matched-filter (MF)
receiver is known to obtain better decision for ToA estimation than the energy-detector (ED)
however it requires the knowledge of the received pulse shape which may not be available
in practice (Sahinoglu et a l., 2003). Another disadvantage of the MF is the requirement of
Nyquist rate sampling for accurate ranging, hence complex analogue-to-digital converters are
required. On the other hand ED based estimator is preferable due to its low complexity, e.g.
implementation at sub-Nyquist sampling rates (Sahinoglu et al., 2003). A disadvantage for
the ED is the squared noise component at its output which makes a poor performance in low
SNR scenarios. The ED output samples can be represented as
z
(n)=
(n+1)T
nT
|r(t)|
2
dt (3)
where T is sampling period, n
∈ 1, , N is sample index and N represents the total number of
received samples. The integrator performs the sampling operation by successively integrating
the squared received signal. First arriving sample is presented by n
0
which in the LoS scenario
corresponds to the direct path with the propagation delay τ
0
. If the transmitter and receiver
are by some means synchronized their range d
0
can then be obtained from the relation d
0
=
cτ
0
.
2.1 Review of UWB ToA estimation algorithms
Several methods for ToA estimation of UWB signals can be found in (Falsi et al., 2006;
Gezici et al., 2005; Low et al., 2005), i.e., examples of maximum likelihood based ranging,
low-complexity estimators include a maximum peak detection method and a threshold
detection method. In the latter a threshold is chosen a priori, and the ToA is defined as
the instant when the received amplitude goes above this threshold (Falsi et al., 2006). In
spite of its simplicity, this method works quite well for UWB signals, especially in high SNR
environments. In this chapter the performance of method is further analyzed by details.
401
High-Precision Time-of-Arrival Estimation for UWB Localizers in Indoor Multipath Channels