Novel Applications of the UWB Technologies Part 15 docx
Bạn đang xem bản rút gọn của tài liệu. Xem và tải ngay bản đầy đủ của tài liệu tại đây (1.96 MB, 30 trang )
High-Precision Time-of-Arrival Estimation for UWB Localizers in Indoor Multipath Channels 11
Fig. 7. Layout of the measurement environment
Frequency band 3.1-10.6 GHz
Band-width (B) 500 MHz
Measurement equipment
Vector network analyzer
Room-wide spatial scanner
Low-noise amplifier (30 dB)
No. of frequency sweeps 1501
Antenna UWB monopole
Transmitted power
−17 dBm
Coverage area dimensions 5.1
×7.6 m
2
Wireless nodes range 0.6m to 9.3 m
Wireless nodes height 1.3 m above the floor
Table 1. Experiment parameters
function. The root-raised cosine pulse is denoted in the time domain as
r
(t)=
4β
π
T
p
cos
(1+β)πt
T
p
+
T
p
4βt
sin
(1−β)πt
T
p
1 −
4βt
T
p
2
(8)
where β and T
p
is a roll-off factor and pulse length specified in the standard (see (Molisch et al,
2004), pp.82-83). CIR is calculated for all the Tx locations.
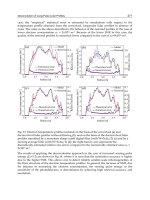
Power of the direct and strongest paths is shown in Fig. 8 against Tx-Rx distances. Results
from channels 2 and 4, which are in the low band, and 11, which is in the high band, are
shown. The figures revealed the following findings. Channels with wider bandwidth show
less gain variation of the direct and strongest paths. Comparison of results from channels 2
and 4 revealed that the variation of path gain values is less in channel 4. The two channels have
407
High-Precision Time-of-Arrival Estimation for UWB Localizers in Indoor Multipath Channels
12 Will-be-set-by-IN-TECH
0 2 4 6 8 10
−85
−80
−75
−70
−65
−60
−55
−50
−45
−40
−35
d
0
Path gain [dB]
0 2 4 6 8 10
−85
−80
−75
−70
−65
−60
−55
−50
−45
−40
−35
d
0
Path gain [dB]
0 2 4 6 8 10
−85
−80
−75
−70
−65
−60
−55
−50
−45
−40
−35
d
0
Path gain [dB]
Fig. 8. distribution of measured direct path gain (blue stars) and strongest path (red dots) in
channels (a) 2 (b) 4 (c) 11
the same center frequency, but channel 4 has about three t imes larger bandwidth than channel
2. The narrower bandwidth leads to poorer delay resolution, which causes the fluctuation of
power in direct and strongest paths due to the fading with non-resolvable signal components
around the paths. As a result, the gain of the first and strongest paths is slightly higher in those
channels. The same trend was observed in other channels with the same center frequency and
different bandwidths, such as channels 5 and 7, 9 and 11, and 13 and 15. This is the same
observation as reported in the work of Alsindi et al. (Alsindi et al., 2007).
Difference of the path gain between the high and low bands are 5 to 15 dB. The path gain in
the high band was smaller value than the low band as expected. The largest and smallest gain
was observed in channels 1 and 11, respectively. The level of path gain is almost the same
in the low band, while 5 dB gain difference was observed within the high band. C hannels 5
and 11 showed the largest and smallest gain in the high band, respectively. The channel with
the highest frequency did not show the smallest path gain, probably because of the frequency
characteristics of antenna gain.
Fig. 9 shows the example of a measured received signal. It depicted that due to the effect of
multipath interference the strongest path is not necessarily the direct path even under the LoS
condition. Multipath interference leads to fading and causes the strongest path spread over
the delay axis. In ranging analysis, direct path should be detected rather than strongest path.
In this example the To A of direct path is estimated wrongly from expected ToA. The ranging
error is modeled in (Dashti et al., 2010).
408
Novel Applications of the UWB Technologies
High-Precision Time-of-Arrival Estimation for UWB Localizers in Indoor Multipath Channels 13
10 15 20 25 30
−100
−95
−90
−85
−80
−75
−70
−65
−60
−55
Path gain[dB]
Delay[ns]
Expected ToA
Estimated ToA
Strongest path delay
Fig. 9. An example of r eceived signal where the strongest path is in a delay from LoS as a
result of destructive multipath interference (Dashti et al., 2010).
3.2 Ranging with fix ed threshold value
The fixed threshold value can be optimized based on noise level or peak signal level. Two
threshold-based methods are introduced to detect the signal component corresponding to the
first path: the leading edge detection, which set the threshold based on noise level, and the
search back method, which the detection threshold level is given by the power of strongest
path (SP). Coherent detection is assumed in both ranging methods. Schematic r epresentation
of these two methods is shown in Fig. 10.
3.2.1 Search-back method
Search-back method utilizes the strongest path of CIRs to detect the direct path. It has been
commonly reported that the first path is not always the strongest path, particularly in NLoS
scenarios due to LoS blockage. As it was discussed earlier, this could happen even in LoS
situations due to multipath propagation. Specially, power of delayed paths could be greater
than the first path because of overlapping multipaths arriving at the same delay time. In
other cases, the first path suffers from destructive fading due to surrounding non-resolvable
multipaths. The search back method first finds the strongest path, and then looks for a peak
arriving before the strongest path which has greater power than a detection threshold level.
We proposed an iterative search-back algorithm to calculate the noise floor (NF) to be used in
the detection of first path. In the first iteration, the algorithm detects the strongest path, and
then calculates the noise floor by averaging over the interval
[0, (t
sp
− t
c
)],wheret
c
is delay
resolution. The interval is t
c
less than the SP delay to exclude the effect of SP signal. To remove
the effect of side lobes, t
c
was chosen 1 ns. In next iterations this process is repeated for new
time interval
[0, (t
i
−t
c
)], and it will continue to find the new peak value and the new NF. Here
t
i
is the time delay of the peak detected in the i −th iteration. The algorithm will be continue
until finding the first peak higher than the NF by predefined search-back threshold value,
γ
S
, which is dependent on system bandwidth. Fig. 11 shows the flowchart of the proposed
iterative algorithm. P
i
and NF
i
in the flowchart are peak value and NF in the i −th iteration.
Obviously the value of NF is erroneous in the first iteration but it will give the real NF and
first detected path after enough iterations. γ
S
level which the algorithm used for detecting of
first path is chosen different for each subband. To obtain the optimum γ
S
which gives lowest
error, we calculated the ranging error using several γ
S
, such as 5, 10,15 and 20 dB. Concerning
409
High-Precision Time-of-Arrival Estimation for UWB Localizers in Indoor Multipath Channels
14 Will-be-set-by-IN-TECH
(a)
(b)
Fig. 10. (a) Search-back detection method vs. (b) leading edge detection method
the difference of SP signal level in different sub bands, these optimum γ
S
values are different
for channels with different bandwidth. For instance, γ
S
was chosen 15 dB for Channel 4. Same
analysis was done for the other subbands, however we hesitate to show the ranging results
of all of them for the sake of conciseness. For higher BW the algorithm search for the first
peak above 15dB from NF, γ
S
is chosen 10dB for channels with lower BW. It is observed that
the NF decreases for higher bands and also decrease by increasing the bandwidth. The peak
value decreases in higher bands and also decreases by increasing the bandwidth. Since path
loss increases as the frequency increases. This algorithm has the advantage of obtaining the
result after a few number of iterations for the far points. Also for the close points (Tx and Rx
close together) in the lower frequency bands, the averaging over longer intervals in the first
iteration seems to be reliable by using this algorithm. For instance for an arbitrary position in
the room in channel 3, by applying the mentioned iterative algorithm, after only 2 iterations,
we could detect the correct first path. The ranging error for this position is 0.2 m, which is
a relatively small error while the real distance between Tx and Rx is 4.6 m. However the
required ranging accuracy depends on the application. The calculated NF for this position
410
Novel Applications of the UWB Technologies
High-Precision Time-of-Arrival Estimation for UWB Localizers in Indoor Multipath Channels 15
Fig. 11. Flowchart of search-back algorithm
is -72 dB. The power level of first path is 14.2 dB more than the calculated NF. Evaluation of
ranging accuracy were assessed in a ll channels. The ranging result shows the algorithm works
well for almost all of the positions, however ranging errors are observed in some cases. We
categorized the ranging errors to two main categories, relatively small positive/minus errors
and large positive/minus errors. When the peak of channel response gets a little shifted from
the expected ToA to shorter/longer ToA, resulting small errors in ToA estimations. In some
far positions from the Tx antenna large ranging errors are observed. These large errors may
be produced by the occurrences of undetected path conditions, or false estimation of NF by
proposed algorithm. For instance in an arbitrary position where large minus error happened,
the calculated NF for that point is -104 dB, and the first detected path level is 14dB higher than
this NF, however this peak is not the real first arrival path, so causes relatively large minus
ranging error. In the proposed first path detection, the detecting of first peak started from SP ,
going to the origin, and it continues till finding the first peak higher than calculated NF by γ
S
value. This algorithm has the advantage of detecting the peak after a few iteration numbers
in many cases. However for some cases the algorithm cannot detect the first path, and SP is
detected as first path. Detection algorithm started from origin and going to SP may eliminate
the error of such these cases. In following leading edge algorithm is described.
3.2.2 Leading edge method
In leading edge method, the fixed threshold value can be optimized based on noise level. We
refer this method as noise level based threshold. Leading edge detection is the most primitive
method to detect the first path. The device monitors a time series of correlator outputs in a
coherent detector. Provided that the power monitor, like a received signal strength indicator
in a general receiver, knows the noise level of the receiver in advance, it can detect the first
path when a signal level exceeds a certain level. The first output sample exceeding noise level
by a predefined threshold value will be detected as ToA, i.e. ToA is the delay time of the
411
High-Precision Time-of-Arrival Estimation for UWB Localizers in Indoor Multipath Channels
16 Will-be-set-by-IN-TECH
0 10 20 30 40 50 60 70 80
−120
−115
−110
−105
−100
−95
−90
−85
−80
−75
−70
−65
Delay [ns]
Path−gain [dB]
γ
Noise level
Direct path
Strongest path
Fig. 12. Noise level based threshold for ToA estimation
earliest received sample that fulfills the condition of:
τ
D
= n
D
T (9)
n
D
= argmin
n
(
z[n] > l
N
+ γ
)
(10)
where γ is the presumed fixed threshold value and l
N
is the noise level. γ can be optimized for
individual UWB subbands in order to have the minimal ranging errors. The principle of noise
level based ToA estimation algorithms is summarized in Figure 12. However, there are two
cases the method fails to detect the first path: miss and noise detection. The miss detection
(late false alarm) occurs if the level of the detection threshold is greater than the power of the
fist path, while the noise detection refers to the case where a noise peak is wrongly detected
as the first path. The noise detection is regarded as a early false alarm.
The Fig. 13 shows the superior performance of leading edge against search-back method for
channel 3. The ranging results in all channels revealed that the leading edge detection always
outperforms the search back method. This is because the search back method uses strongest
path. As reported in the channel modeling result, strongest paths fluctuate in power, resulting
in larger fluctuation of the level difference between the first and strongest paths. Therefore,
the search back method needs to increase the search back level in order to capture the first
path perfectly. The larger search back level, however, results in increasing probability of noise
detection, resulting in the degradation of the mean detection probability. On the other hand,
the leading edge detection suffers from the power fluctuation less. According to the channel
modeling result, smaller power fluctuation was observed in channels with wider bandwidth.
In such channels, the first path detection probability of the search back method is comparable
with that of the leading edge method. The search back method achieves perfect detection
probability on the diagonal line of the room, but miss and noise detection starts to occur once
the Tx location is getting off from the diagonal line. This means that the performance is largely
dependent on spatial multipath characteristics. While it was not found in the leading edge
detection because of its robustness to the varying multipath structure. The miss detection is
most visible in near-wall Tx locations. It is generally seen that in leading edge method, smaller
path gain leads to lower threshold values in order to capture first paths correctly. Hence the
threshold value indicates larger values when it is optimized in the limited areas to rule out
412
Novel Applications of the UWB Technologies
High-Precision Time-of-Arrival Estimation for UWB Localizers in Indoor Multipath Channels 17
−1 −0.5 0 0.5 1 1.5 2
0
0.2
0.4
0.6
0.8
1
Ranging error [m]
CDF
Search−back
Leading edge
Fig. 13. Comparison of leading edge a nd search-back methods
0 2 4 6 8 10
−80
−75
−70
−65
−60
−55
−50
−45
−40
d
0
[m]
Path−gain [dB]
f
c
=3.49 GHz
f
c
=3.99 GHz
f
c
=6.48 GHz
f
c
=9.48 GHz
Fig. 14. Direct path-gain in different subbands with different center frequencies
Tx locations with low signal levels. The same trend is observed in the search back level, but
the fluctuation of the value is small over different center frequencies and bandwidths In the
leading edge method named noise level based threshold approach, noise level can be assumed
initially as a fixed value or can be calculated based on initial part of the signal. We categorized
noise level based threshold ToA estimation concerning presumption or estimation of noise
level. In following section more description is given.
• Presumed noise level A prior knowledge about the noise can be assumed to set the l
N
as a
single value, i.e. in equation (10), l
N
is presumed single noise level. We assumed thermal
noise level given by l
N
= k
B
T
k
B where k
B
is the Boltzmann constant, B is the system
bandwidth and T
k
is the absolute temperature in kelvin.
Fig. 14 shows t he best fit for the measured FAP path gain as a function of Tx-Rx distances
for different channels. It is observed that the FAP path gain decreases in higher subbands
since the path loss increases, Hence γ in equation (10) was optimized for each channel
individually in order to have minimal ranging errors. Fig. 15 shows the optimum value of
threshold for all different channels. γ
opt
varies from 30 dB for channel No.1 with lowest
413
High-Precision Time-of-Arrival Estimation for UWB Localizers in Indoor Multipath Channels
18 Will-be-set-by-IN-TECH
3 4 5 6 7 8 9 10
0
5
10
15
20
25
30
subband center frequency [GHz]
Optimized fixed value of threshold [dB]
Fig. 15. Optimized fixed value of threshold for different subbands with different center
frequencies
0 2 4 6 8 10
−105
−100
−95
−90
−85
−80
−75
−70
−65
−60
−55
Distance[m]
Path gain [dB]
Presumed noise level
Estimated noise level
Direct path gain
Fig. 16. Measured direct path gain against presumed and estimated noise level
center frequency, f
c
= 3.49 GHz, to 15 dB for channel No.15 with highest center frequency,
f
c
= 9.98 GHz,. Fig. 15 shows direct path gain compared with presumed fixed l
N
.The
direct path gain decreases with longer Tx-Rx distance while noise level is a single value,
therefore the differences of direct path gain and noise level are not a single value for all
Tx-Rx distances. As Fig. 16 shows, the difference between direct path gain and l
N
,vary
in a wide range. Due to this wide variation, presetting a single value for γ,whichgives
minimal ranging errors for all possible Tx-Rx distances, is a challenge.
• Estimated noise level In this approach instead of presuming a single noise level, we
estimate the noise level based on the initial part of the received signal, i.e. in equation
(10), l
N
is not a single value but it is calculated for each channel realization. Fig. 15 shows
direct path gain compared with estimated l
N
for different Tx-Rx distances. In (Dashti et al.,
2008) the variance of ranging error of estimated noise level approach with those obtained
by presuming the l
N
are compared. It was shown that by estimating l
N
,varianceof
ranging error dramatically decreases in all channels, However still the algorithm fails
in some cases. Setting a fixed threshold value is not reliable due to variation of direct
414
Novel Applications of the UWB Technologies
High-Precision Time-of-Arrival Estimation for UWB Localizers in Indoor Multipath Channels 19
path gain on different Tx-Rx distances. Since direct path gain decreases with longer Tx-Rx
distance, threshold value also can be set to decrease with Tx-Rx distance. We proposed a
delay-dependent threshold selection method in next section.
3.3 Ranging with delay-dependent threshold setting
In previous section two fixed threshold based methods (leading edge vs. search-back)
are introduced and the ranging performance of them are compared. The performance
degradation in the search back method is due to the gain fluctuation of the first and strongest
paths, which is most remarkable in the high band. The selection of the optimum threshold
level for these two ranging methods still remains an important issue.
As it was described in previous section, we introduce a technique to set the threshold as
a function of Tx-Rx distance instead of a fixed value as in conventional noise level based
threshold methods. In this method, we preset a delay-dependent threshold function ξ
(n).
The received samples are then compared to the r espective threshold values, ξ
(n). The arrival
time of the first sample crossing the respective threshold value within time interval
[0, t
SP
]
is estimated as ToA, where t
SP
is the delay time of the SP. Fig. 17 (a) shows the basic of the
proposed method. In this method estimation or assumption of noise level is not needed. As
described, algorithm searches for a first received sample crossing its respective threshold. In
some cases there is no peak located in the detected sample, n
D
th sample, as shown in Fig. 17
(b), due to resolution of system and algorithm. The algorithm then search for a nearest peak
value in the interval of
[n
D
T − t
c
, n
D
T + t
c
],wheret
c
is set according to the resolution of
system.
As a reliable delay-dependent threshold the standard path-gain model is employed, which
is to predict the expectation of E
n
0
at any indoor position, according to the IEEE802.15.4a
standard channel model (Molisch et al, 2004). T his model is generic and widely used for
the indoor UWB channel modeling applications. In following IEEE802.15.4a standard path
gain model is briefly explained. The parameters of the model are also extracted by fitting
measurement data to the described path gain model.
In the IEEE802.15.4a standard, path gain in a UWB channel is defined as:
G
( f , d)=G(f )G(d) (11)
Path gain is a function of the distance and frequency. In this model, it is assumed that
the distance and frequency dependent effects are spreadable. The separation reduces the
complex two-dimensional path gain modeling to one-dimensional problem. The frequency
dependency of the channel path gain is modeled as:
G
( f )∝
f
−k
(12)
In IEEE802.15.4a model the distance dependence o f the path gain is described by the
conventional power law for simplicity as:
G
(d)=G
R
×(
d
d
R
)
q
(13)
Combining (11), (12) and (13) yields the following equation in dB for total path gain.
G
(d)=G
R
−20klog
f
f
R
−10ql o g
d
d
R
(14)
415
High-Precision Time-of-Arrival Estimation for UWB Localizers in Indoor Multipath Channels
20 Will-be-set-by-IN-TECH
0 10 20 30 40 50 60
−120
−110
−100
−90
−80
−70
−60
−50
Delay [ns]
Path−gain [dB]
First time sample crossing the respective threshold
≡ Direct path
Delay−dependent threshold
(a)
0 10 20 30 40 50 60
−110
−100
−90
−80
−70
−60
−50
Path−gain [dB]
Delay [ns]
First time sample crossing
the respective threshold
Direct path
Delay−dependent
threshold
(b)
Fig. 17. An example of Delay-dependent threshold against a measured channel impulse
response a) a peak located in n
D
sample b) n
D
sample is not a peak hence algorithm search
for nearest peak in the interval of
[n
D
T − t
c
, n
D
T + t
c
]
which in essence states that the path-gain is influenced by attenuation due to the frequency f
and the transmitter to receiver separation d. The decaying exponent due the frequency and the
distance are expressed as k and q, respectively while G
R
, f
R
and d
R
are the reference path-gain,
frequency and distance respectively (Molisch et al, 2004).
Fig. 18 shows the distribution of measured path gain within the scanned area in the room.
X-axix and Y-axix represent the coordinate of the transmitter in X-Y plane in the area covered.
Measured direct path gain distribution for lowest and highest subbands , which are channel 2
and 14 respectively, are shown in the Fig. 18 (a) and (b) . Figure depicts the dependency of the
path gain to the distance and frequency. The parameters of the model were extracted by fi tting
measurement data to the described path loss model. Following procedure was performed for
determination of model parameters similar to method presented in (Haneda et al., 2007):
416
Novel Applications of the UWB Technologies
High-Precision Time-of-Arrival Estimation for UWB Localizers in Indoor Multipath Channels 21
0 2 4 6 8
0
1
2
3
4
5
6
x[m]
y[m]
−75
−70
−65
−60
−55
−50
−45
−40
0 2 4 6 8
0
1
2
3
4
5
6
x[m]
y[m]
−80
−75
−70
−65
−60
−55
−50
−45
Fig. 18. distribution of measured direct path gain within the scanned area in the room in
channels (a) 2 (b) 14
0 2 4 6 8 10
0
0.5
1
1.5
2
2.5
3
d
[
m
]
k
3 4 5 6 7 8 9 10
0
0.5
1
1.5
2
f
c
[GHz]
q
Fig. 19. Path loss model parameters (a) Dependency of k to Rx-Tx distance (b) Dependency of
q to frequency
• Frequency decaying factor determination: Frequency decaying factor, k,wasderivedusing
equation (12). To observe the variation of k on the Tx-Rx distance, derivation was done
for all the possible Tx-Rx distances. It was assured that the frequency decaying factor is
almost constant for all possible distances. The variation range was between 0.96 to 1.22
and the mean value is 1.12. Dependency of k to Rx-Tx distance is shown in Fig. 19(a).
• Distance decaying factor determination: the distance decaying factor, q,wasderivedusing
(13). To observe the variation of the distance decaying factor, derivation was done for
all possible frequency samples. It was assured that the variation of n is negligible for
different frequency samples. The variation of q was between 1.15 to 1.32. The mean value
of all samples, 1.22, could be represented the distance decaying factor. Dependency of q to
frequency is shown in Fig. 19(b).
• Initial path gain determination: initial path loss value, G
R
, was calculated using (14) by
replacing the obtained frequency and distance decaying factor from the above two steps.
Obtained G
R
from our measured data was 39.07 [dB].
417
High-Precision Time-of-Arrival Estimation for UWB Localizers in Indoor Multipath Channels
22 Will-be-set-by-IN-TECH
The specific values for these parameters for the indoor LoS scenario are reported as f
R
=5
GHz, d
R
=1m,G
R
= -35.4 dB, k =0.03andq = 1.6 for the indoor office and G
R
= -43.9 dB, k
=1.12andq = 1.8 for the residential environment (Molisch et al, 2004). Following the same
approach, corresponding parameters for the measured values were derived as G
R
= -39 dB, k =
1.12 and q = 1.22. These parameters are slightly different from those proposed by the standard
model due to specific environment. Good fit, typical for all subchannels, is observed which
indicates the appropriateness of the model to be used for the threshold setting.
The standard path-gain formula was applied as the proposed delay-dependent threshold to
get the range of the measured data d
m
. Standard deviation of the ranging error σ
e
obtained
from the path-gain threshold and the best fixed threshold are presented in (Dashti et al., 2009).
It is observed that the path-gain threshold gives a lower ranging error in all subchannels with a
stable performance over all frequency bands. The performance of the fixed threshold ranging
however is frequency dependent due to different path-loss and interference (Dashti et al.,
2008).
3.4 Effect of center frequency and band width
An important finding from F ig. 8 is that given the wide dynamic range of signal levels over
varying distance, it is hard to find one optimum threshold which achieves the perfect direct
path detection everywhere in one office room. The inherent problem here is that the limited
transmit power hinders the signals from reaching more than several meters away.
Another finding is that channel 4 is able to provide reliable ranging in almost all the locations
of the room. The result from channel 7 indicated that the noise detection is the main source
of error in many Tx locations. In wall-side Tx locations, however, the miss detection becomes
a dominant source of error. The miss detection is attributed to the weak direct paths close to
the noise level, making its detection difficult. The results of channel 11, which showed the
smallest path gain among the channels, is dominated both by the noise and miss detection. In
that channel, even the strongest paths are as weak as, or weaker than the noise level. Systems
operated in the high band often faces this issue. It is therefore very essential to introduce a
technique to improve the signal to noise ratio, such as channel averaging functionality for
noise reduction and beam forming for increased signal level, in the receiver. Accurate ranging
in the low band is promising even under the transmit power restrictions, while the use of high
band necessitates a fundamental countermeasure against the low signal level at the receiver.
It turned out that the gain of direct and strongest paths quickly decreases with increasing
frequency. The restriction of the transmit spectral density further limits the service coverage.
Still, ranging in the low band reveals promising performance, while accurate ranging can only
be performed in a very limited areas in the high band. For example the ranging method in the
highest frequency band allows accurate ranging only within 1 m range relative to the device.
This fact implies that accurate ranging in NLoS scenario is even less promising due to excess
path loss due to whatever path obstruction. It is important to note that the most influential
factor in the accurate ranging in NLoS scenarios would be the limited transmit power, rather
than the LoS blockage and multipath propagation.
It is also found that the detection probability has obvious dependency on the bandwidth.
There are four combinations of bands with the same center frequencies and different
bandwidths. It was found that channels with wider bandwidths give rise to lower detection
probability. The trend becomes remarkable as the frequency increases. This is a natural
consequence of the observation in the channel modeling that the wider bandwidth gives
the lower power of the direct and strongest path, which resulted in increased probability
418
Novel Applications of the UWB Technologies
High-Precision Time-of-Arrival Estimation for UWB Localizers in Indoor Multipath Channels 23
−1 0 1 2 3
0
50
100
150
200
250
Ranging error [m]
Number of occurance
−1 0 1 2 3
0
200
400
600
800
1000
1200
1400
Ranging error [m]
Number of occurance
Fig. 20. Histogram of the ranging error (a) channel 5 with bandwidth of 500 MHz (b) channel
7withbandwidthof1.0GHz
of noise detection. From the obtained ranging results in different subbands, it is observed
that wider bandwidth provides better estimation accuracy of the distance because of the finer
delay resolution, as is commonly reported. In Fig. 20 the histogram of ranging errors in
channel 5 and 7 with the bandwidth of 500 MHz and 1.0 GHz is shown. It can be concluded
that wider bandwidth always gives better detection and estimation accuracy of the direct
paths in the low band, while the superiority of the wider bandwidth is becoming less visible
as the center frequency goes h igher. Use of wider bandwidth does not always provide better
ranging performance, particularly in the high band. In contrast to the well-known observation
that wider system bandwidth gives rise to better accuracy of range estimation, performance
of the range detection revealed the opposite trend, particularly in the high band. This is
because wider bandwidth leads to lower gain of direct and strongest paths. Systems with
wider bandwidth clearly outperforms those with narrower bandwidth in the low band, but
that would not be necessarily the case in the high band.
4. Summary and future trends
In this chapter the mo tivations for research on indoor ranging/localization using
ultra-wideband systems is described and a literature review is given. UWB time-based
ranging and ToA estimation algorithms are reviewed and threshold-based ToA estimation
algorithm is provided. A measurement campaign for the indoor ranging is introduced and
the obtained results are inspected. A practical method is proposed for setting the threshold
value. This method is based on the path-loss of the signal which can be predicted by the
standard channel model. The applicability is checked experimentally. The effect of bandwidth
on distribution of the ranging error is discussed. There are a few directions that one might take
to extend this research:
• A practical threshold setting technique is introduced based on the standard channel model
for the indoor environments (Dashti et al., 2011). Proposed threshold setting technique
is validated using a set of channel measurement data acquired in a typical office room.
More channel measurement should be performed in different indoor environments in
order to validate the applicability of the proposed threshold-setting technique in different
environments to evaluate the generality of the method.
419
High-Precision Time-of-Arrival Estimation for UWB Localizers in Indoor Multipath Channels
24 Will-be-set-by-IN-TECH
• Some practical issues remain unresolved. In particular perfect clock synchronization
between transmitter and receiver is assumed. This assumption is unlikely in practice.
Solutions to this problem like round-trip measurement have been mentioned, but they
need to be implemented and validated i n practice. At a deeper level, understanding and
quantifying how the synchronization error impacts the accuracy will help in designing a
practical system.
• In the system model explained, it is assumed that the transmitter sends out a UWB
waveform. It is known that the UWB waveform is distorted during interactions to the
wireless channel. For the simplicity of the simulation it is assumed that this distortion is
negligible, one might take a more practical received signal to extend this research.
• More practical scenario should be considered, the case that UT antenna pattern is distorted
by near objects and the UT orientation is random. Ranging results with the antenna
proximity to the human head are presented in (Dashti et al., 2010). It should be noted
that the human body is just one of the sources of d istortion. Even it is quite possible
that the antenna pattern is distorted by the antenna itself and the chassis of UT. Deep
understanding of antenna pattern distortion and its effect on ToA estimation can be
considered.
• Since this research area is fairly new, there are many different and important ways
to contribute to indoor localization technology. There is a need for comprehensive
measurements and modeling for indoor localization specific applications. As such the
emerging UWB technology promises a solution for combating the indoor multipath
condition. As a result the implementation of UWB measurement system and indoor
channel modeling for localization is an important area for further research. In addition,
analyzing the effect of bandwidth on the ranging error could be accomplished by
examining bandwidths in excess of 60 GHz. The following can also be conducted as a
continuation of the research work, namely, comparing the performance of super resolution
algorithms t o the UWB system for indoor localization.
5. References
Alsindi, N., Alavi, B. & Pahlavan, K. (2007). Measurement and modeling of ultra wideband
TOA- based ranging in indoor multipath environments, In: IEEE Trans. Veh. Tech.
Dardari, D. & Win. M. (2006). Threshold-based time-of-arrival estimators in UWB dense
multipath channels, In: Proc. IEEE Int. Conf. Commun. (ICC), pp. (4723-4728), vol.
10, Istanbul, Turkey
Dashti, M., Ghoraishi, M., Haneda, K., Takizawa, K. & Takada, J. (2008). Distance
dependent threshold ToA estimation, In: Proceedings of IEICE WBS Technical Meeting,
WBS2008-53
Dashti, M., Ghoraishi & Takada, J.(2009). Optimum Threshold for Ranging Based on ToA
Estimation Error Analysis, In: 20th Personal, Indoor and Mobile Radio Communications
Symposium 2009(PIMRC09)
Dashti, M., Khatun, A., Laitinen,T., Al-Hadi, A.A., Haneda, K., Ghoraishi, M. & Takada, J.
(2010). UWB Ranging with Antenna Proximity to the Human Head, In: APMC 2010
Dashti, M., Ghoraishi, M., Haneda, K., Takizawa, K. & Takada, J. (2010). Sources of ToA
Estimation Error in LoS Scenario, In: ICUWB
420
Novel Applications of the UWB Technologies
High-Precision Time-of-Arrival Estimation for UWB Localizers in Indoor Multipath Channels 25
Dashti, M., Ghoraishi, M., Haneda, K., Takizawa, K. & Takada, J. (2011). S tatistical Analysis of
Ranging Error and Optimum Threshold for Indoor UWB Positioning, Submitted to:
EURASIP
Dizdarevic, V. & Witrisal, K. (2007). Statistical UWB Range Error Model for the Threshold
Leading Edge Detector, In: International Conference on Information, Communications
and Signal Processing, ICICS
Ellis, J. & Rouzet, P. (2004). P802.15.4a Alt PHY selection criter ia, In: doc.
IEEE802.15-04-0232-16-004a.
Falsi, C., Dardari,D., Mucchi,L. & Win,M. Z. (2006). Time of arrival estimation for UWB
localizers in realistic environments, In: EURASIP J. Appl. Signal Processing (Special
Issue on Wireless Location Technologies and Applications)
Gezici,S., Sahinoglu, Z., Molisch, A., Kobayashi, h. & Poor, H. (2008). Two -step time of arrival
estimation for pulse based ultra-wideband systems, In: EURASIP Journal on Advances
in Signal Processing, vol. 2008, Article ID 529134, 11 pages
Gezici, S., Tian, Z, Giannakis, G., Kobayashi, H., Molisch, A.F., Poor, H. & Sahinoglu, Z. (2005).
localization via ultra-wideband radios: a look at positioning aspects for future sensor
networks, In: IEEE signal processing Magazine, pp. (22:70-84)
Guvenc, I. & Sahinoglu, Z. (2005). TOA estimation with different IR-UWB transceiver types,
In: Proc. IEEE Int. Conf. UWB, pp. (426-431), Zurich, Switzerland
Guvenc,I.; Sahinoglu, Z.; Molisch,A. & Orlik, P. (2005). Non-coherent TOA estimation in
IR-UWB systems with different signal waveforms, In: Proc. IEEE Int. Workshop on
Ultrawideband Networks (UWBNETS), pp. (245-251)
Guvenc, I. & Sahingolu, Z. (2005). Threshold-based TOA estimation for impulse radio UWB
systems, In: Proc. IEEE Int. Conf. UWB, pp. (420-425), Zurich, Switzerland
Guvenc, I. & Sahinoglu, Z. (2005). Threshold selection for UWB ToA estimation based on
kurtosis analysis, In: IEEE Commun. Lett., pp. (1025-1027), Vol. 9, No. 12
Guvenc, I., Shahinoglu, Z. & Orlik, P. (2006). TOA Estimation for IR-UWB Systems with
Difference transceiver Types, In: IEEE Trans. on Microwave Theory and Techniques,Vol.
54, No. 4
Guvenc, I., Gezici, S. & Sahinoglu, Z. (2008). Ultra-wideband range estimation: Theoretical
limits and practical algorithms, In: Proc. IEEE International Conference on
Ultra-Wideband (ICUWB 2008), pp. (93-96), Hannover, Germany
Haneda, H., Takizawa, K., Takada, J., Dashti, M. & Vainikainen, P. (2009). Performance
Evaluation of Threshold-Based UWB Ranging Methods-Leading Edge vs. Search
Back-, In: 3rd European Conference on Antennas and Propagation, pp. (3673-3677)
Haneda, K., Takada, J., Takizawa K. (2007). Ultra Wideband Path Loss Modelling in
a Line-of-Sight Office Environment. 2nd European Conference on Antennas and
Propagation (EuCAP 2007), Nov. 2007 (Edinburgh, UK).
IEEE Std. (2007). Wireless Medium Access Control (MAC) and Physical Layer (PHY)
Specifications for Low-Rate Wireless Personal Area Networks(WPANs), In: IEEE Std
802.15.4a-2007, pp. (81-83)
Jourdan, D. (2006). Wireless Sensor Network Planning with Application to UWB Localization
in GPS-Denied Environments, In: Doctoral Thesis at Massachusetts Institute of
Technology
Lee, J. & Scholtz, R. (2002). Ranging in a dense multipath environment using an UWB radio
link, In: IEEE Journal on selected Areas in Communications, pp. (20(9):1677-1683)
421
High-Precision Time-of-Arrival Estimation for UWB Localizers in Indoor Multipath Channels
26 Will-be-set-by-IN-TECH
Low, Z., Cheong, J., Law, C., Ng, W., & Lee, Y. (2005). Pulse detection algorithm for
Line-of-Sight (LoS) UWB ranging application, I n: IEEE Antennas and Wireless
Propagation Letters, pp. (4:63-67)
Molisch, A.F., Balakrishnan, v, Cassioli, D., Chong, C.C., Emami, S., Fort, A., Karedal, J.,
Kunisch, J., Schantz, H., Schuster, U. & Siwiak, K. (2004). IEEE 802.15.4a channel
model - final report, IEEE 802.15 WPAN Low Rate Alternative PHY Task Group
4a(TG4a), In: Tech. Rep.
Sahinoglu, Z., Gezici, S. & Guvenc, I. (2003). Ultra-wideband Positioning Systems: Theoretical
Limits, Ranging Algorithms, and Protocols, In: Cambridge university press
Scholtz , R. & Lee, J. (2002). Problems in modeling UWB channels, In: Proc. IEEE Asilomar Conf.
Signals, Syst. Computers, pp. (706-711), , vol. 1, Pacific Grove, CA
Win, M. & Scholtz, R. (1998). On the robustness of ultra-wide bandwidth signals in dense
multipath environments, In: IEEE Commun. Lett., pp. (2(2):51-53)
Win, M. & Scholtz, R. (2002). Characterization of ultra-wide bandwidth wireless indoor
communications channel: A communication theoretic view, In: IEEE J. Select. Areas
Commun., pp. (20(9):1613-1627)
Xu, C. & Law, C. (2008). Delay-dependent threshold selection for UWB ToA estimation, In:
IEEE Communication letters, pp. (380-382), Vol. 12, No.5
Yang, L. & Giannakis, G. (2004). Ultra-wideband communications: An idea whose time has
come, In: IEEE Sig. Processing Mag., pp. (26-54), vol. 21, no. 6
Yang, L. & Giannakis, G. (2005). Timing ultra-wideband signals with dirty templates, In: IEEE
Trans. Commun., pp. (1952-1963), vol. 53, no. 11
422
Novel Applications of the UWB Technologies
0
Novel Mechanisms for Location-Tracking
Systems
Giuseppe Destino and Giuseppe Abreu
University of Oulu, Centre for Wireless Communications
Finland
1. Introduction
The need of location information is rapidly emerging in many wireless application scenarios
Hightower & Borriello (2001); Poslad (2009); Vossiek et al. (2003). For instance, in home
and office environments, location-based services are developed to improve the efficiency of
the working environment, to localize printers, mobile-phones, people, etc. In warehouse,
industrial and hospital application scenarios, location information can be used to track assets
and persons. In military and rescuing applications, positioning technologies can be utilized
for real-time monitoring of soldiers in the troop, track machines and cars Destino & Abreu
(2009a); Destino et al. (2007).
Location-information, however, is also emerging as a requirement for the next generation
of wireless communication technologies. For instance, for mobile networks, the 23rd of
September 2010, the Federal Communications Commission (FCC) unanimously approved
new rules for the use of unlicensed TV white space spectrum. It was stated that devices
will be able to access to the TV white space spectrum if they will able to determine their
locations and to identify the unused channels at that location. Yet another emerging area
where positioning will play a major role is the Internet-of-things (IoT) Scott & Benlamri (2010).
In this case, context and location-awareness will be fundamental for the development of smart
technologies that will allow “Things” (computer, mobile-phones, objects, sensors, actuators,
etc.) to be autonomous and energy-efficient.
Motivated from all the above, a lot of researches are devoted to the development of accurate
positioning technologies based on satellite radios like the Global Positioning System (GPS), or
short- and medium-range radio technologies such as Wi-Fi, Bluetooth and Ultra-wide band
(UWB). In particular, UWB technology has seen a strong surge of interests because of its high
accurate ranging capabilities and energy efficiency Dardari et al. (2008.); Gezici et al. (2005);
Yihong et al. (2004).
This chapter is intended as a survey on current state-of-the-art localization techniques for
large-scale and single-hop networks, and for the latter case, a dedicated section will be
also devoted for Non-Line-of-Sight (NLOS) mitigation mechanisms. Finally, considering
a low-data-rate impulse radio (LDR-IR) UWB ranging model Denis et al. (2007), the
performance of the described algorithms will be shown for Line-of-Sight (LOS) and mixed
LOS/NLOS channel conditions in both single-hop and multi-hop network topologies.
20
2 Will-be-set-by-IN-TECH
2. Modeling of the localization problem
Consider a network of N nodes deployed in the η-dimensional space. We shall assume that
N
A
nodes are anchors and N
T
nodes are targets, where an anchor is a node whose location is
known a priori, while a target is a node whose position is yet to be determined.
Denote by p
i
∈ R
η
the position (Euclidean coordinates) of the i-th node such that p
i
a
i
and
p
i
z
j
for 1 ≤ i ≤ N
A
and N
A
+ 1 ≤ i ≤ N, respectively.
The Euclidean distance between the i-th and the j-th node is defined as
d
ij
p
i
−p
j
F
, (1)
where
·
F
is the Frobenius norm, while a measurement (ranging) of d
ij
is given by
˜
d
ij
=
d
ij
+ b
ij
+ n
ij
, if either p
i
= z
i
or p
j
= z
j
,
d
ij
, if both p
i
= a
i
and p
j
= a
j
(2)
where n
ij
and b
ij
indicates small(noise) and large(bias) errors.
Extensive measurement campaigns can be found in the literature in order to characterize
the statistics of n
ij
and b
ij
for different radio-technologies Gentile & Kik (2006); Joon-Yong
& Scholtz (2002); Mao et al. (2007); Patwari et al. (2003). In the case of Low-Data-Rate
Ultra-Wideband (LDR-UWB) we adopt the model proposed in Denis et al. (2007), which
summarizes as follows.
Define the biased distance d
ij
as d
ij
d
ij
+ b
ij
and consider such a variable as a random
variate conditioned upon the true Euclidean distance d
ij
and governed by the probability
density functions p
C
p
C
(d
ij
|d
ij
, C)=
G
C
d
ij
√
2πσ
C
exp
⎛
⎜
⎜
⎝
d
ij
d
ij
−1
2
2σ
2
C
⎞
⎟
⎟
⎠
+ λ
C
E
C
1
d
ij
>d
ij
d
ij
exp
−λ
C
(d
ij
−d
ij
)
d
ij
, (3)
where 1
d
ij
>d
ij
= 1ifd
ij
> d
ij
and 0 otherwise, {G
C
, σ
C
} and {E
C
, λ
C
} are the weights and
parameters of Gaussian and Exponential mixture components and C
{LOS, NLOS, NLOS
2
}
refers to a ranging error model without bias (LOS), with small bias (NLOS) and large bias
(NLOS
2
). Furthermore, consider that the channel C is also a function of the distance d
ij
, and
the probability of LOS, NLOS or NLOS
2
can be computed as
W
C
(d
ij
)=
ξ
√
2πς
C
exp
⎛
⎜
⎝
−
d
ij
−d
0
2
2ς
2
0
⎞
⎟
⎠
, (4)
where d
0
and ς
0
are reference values (typical d
0
= 10 and ς
0
= 4.6) and ξ ensures that
W
LOS
(d
ij
)+W
NLOS
(d
ij
)+W
NLOS
2
(d
ij
)=1 (for instance ξ is 10 when d
0
= 10 and ς
0
= 4.6).
Once, the biased distance in computed, then the distance measurement
˜
d
ij
is obtained as in
equation (2), where n
ij
is a zero-mean Gaussian random variable with variance σ
2
ij
.
424
Novel Applications of the UWB Technologies
Novel Mechanisms for Location-Tracking Systems 3
In figure 1 we exemplify the LDR-UWB ranging model and we show the histograms and pdfs
of
˜
d
ij
obtained for d
ij
= 10, σ
ij
= 0.7 and bias-distance parameters {G
C
, σ
C
} and {E
C
, λ
C
}
given by
G
C
σ
C
E
C
λ
C
LOS 0 0.0068 0 0
NLOS 0.31 0.0102 0.69 47.013
NLOS
2
0.26 0.0129 0.74 8.4331
Table 1. Setting of the parameters for the UWB-LDR ranging model given in equation (3)
6 8
1
0
12 14 1
6
0
0.1
0.2
0.3
0.4
0.5
0.6
LOS
(a) LDR-UWB LOS model
6 8
1
0
12 14 1
6
0
0.1
0.2
0.3
0.4
0.5
0.6
NLOS
(b) LDR-UWB NLOS model
6 8
1
0
12 14 1
6
0
0.05
0.1
0.15
0.2
0.25
0.3
0.35
0.4
0.45
0.5
NLOS2
(c) LDR-UWB strong NLOS model
Fig. 1. Example of the biased distance d
ij
in different channel conditions.
In many application scenarios, however, it is assumed that the ranging model is unknown and
it cannot be accurately estimated because of scarcity of information. Therefore, we consider
non-parametric localization methods such as the minimization of a Weighted Least Square
(WLS) objective function,
min
ˆ
Z
∈R
N
T
×η
f
R
(
ˆ
Z
), (5)
425
Novel Mechanisms for Location-Tracking Systems
4 Will-be-set-by-IN-TECH
with
f
R
(
ˆ
Z
)
∑
ij∈H
w
ij
˜
d
ij
−
ˆ
d
ij
2
=
∑
ij∈H
w
ij
˜
d
ij
−a
i
−ˆz
j
F
2
+
∑
ij∈H
w
ij
˜
d
ij
−ˆz
i
−ˆz
j
F
2
, (6)
where
H is the set of indexes related to connected links,
ˆ
d
ij
ˆ
p
i
−
ˆ
p
j
F
is the distance
obtained from the estimates of the i-th and j-th nodes, and w
ij
is a weight Costa et al. (2006);
Destino & G. (2009) related to the “concern” Boyd & Vandenberghe (2004) over the term
(
˜
d
ij
−
ˆ
d
ij
).
In the localization problem posed as in equation (5), several challenges are met and the
one that has attracted a large research community is the design of efficient minimization
techniques Costa et al. (2006),Biswas, Liang, Toh & Wang (2006),Ding et al. (2008),Destino
& Abreu (2009c),Wymeersch et al. (2009). In the sequel, this issue will be addressed and the
most effective state-of-the-art solutions will be described in details.
2.1 WLS localization methods in large scale networks
Rewrite the objective function given in equation (6) as
f
R
(
ˆ
Z
)=
W
◦
D
−D(
ˆ
P
)
2
F
, (7)
where the ij-th element of W is the weight w
ij
, ◦ is the Hadamard product and
ˆ
D
= D(
ˆ
P
)
1
N
·diag
ˆ
P ·
ˆ
P
T
T
+ diag
ˆ
P ·
ˆ
P
T
·1
T
N
−2 ·
ˆ
P
·
ˆ
P
T
, (8)
where
T
indicates transpose, 1
N
is a column vector of N elements equal to 1, and diag(·)
indicates a column vector containing the diagonal elements of its argument Dattorro (2005).
The localization problem given in equation (5) can then be approached in two different
manners Dattorro (2005); Destino & Abreu (2009c); So & Ye (2005). The first one, which
is the basis for the later described Classical Multidimensional Scaling (CMDS) Cox & Cox
(2000) and Semidefinite Programming (SDP) methods, is to consider
D as the observation
of a multidimensional variable
ˆ
D. Therefore, the optimization problem can be formulated
as matrix proximity optimization problem, in which the objective is to estimate the closest
Euclidean Distance Matrix (EDM)
ˆ
D to the observed EDM-sample
˜
D. In so doing, the
optimization problem benefits from the fact that the space of the EDM, denoted by EDM
N
,
is related to the space of symmetric positive semidefinite matrixes, denoted by S
N
+
with the
linear relationship
K
K(D)=−
1
2
J
·(D)
◦2
·J
T
, (9)
where
◦2
indicates the element-wise square and
J
I
N
−(1
N
·1
T
N
)/N. (10)
The search of the optimum matrix can therefore be constrained either to S
N
+
or to EDM
N
, such
that two different methods can be formulated. The first method is to solve the optimization
426
Novel Applications of the UWB Technologies
Novel Mechanisms for Location-Tracking Systems 5
problem as
min
ˆ
K
K(W ◦(
˜
D
−
ˆ
D
))
2
F
, (11)
s.t.
K(
ˆ
D
) ∈ S
N
+
,
and the second method is to formulate the problem as
min
ˆ
D
W
◦(
˜
D
−
ˆ
D
)
2
F
. (12)
s.t.
ˆ
D
2
∈ EDM
For the sake of illustration, in figure 2 we show the logic of the two approaches with an
Euler diagram. The black and red arrows indicate the linear mapping from S
N
+
to EDM
N
given by equations (8) and (9) and viceversa, respectively. The yellow cicle describes the
method 1 (optimization in S
N
+
) and the blue arrow method 2 (optimization in EDM
N
). In
the following subsections we describe two state-of-the-art solutions based on method 1 and
2, namely the algebraic Classical Multidimensional Scaling (CMDS) technique and the Semi
Definite Programming (SDP) method.
S
N
+
R
N ×N
+
S
N
˜
D
˜
K
ˆ
K
D
◦2
ˆ
D
◦2
2
ˆ
D
◦2
1
K
R
N ×N
Method 1
Method
2
EDM
N
K(D
◦2
)D(K)
K
S
S
S
S
N
N
+
+
+
+
ˆ
ˆ
K
K
K
K
K
K
K
K
K
K
K
K
K
K
Fig. 2. Illustration of the matrix proximity problem with and Euler diagram. The notations
R
N×N
, R
N×N
+
S
N
, S
N
+
and EDM
N
indicate the real, real-positive, real-symmetric,
real-positive semidefinite and Euclidean Distance Matrix spaces.
As mentioned above, however, the WLS-based localization problem can also be approached
in a different manner than a matrix proximity problem. The alternative indeed is
to solve equation (5) directly over the unknown variables z
i
’s Gezici (2008). In this
approach, the major difficulty is to handle the multiple minima with robust optimization
methods. To this end, indeed, several techniques can be found in the literature which
are proposed either as distributed or centralized algorithms. Amongst all, we will
427
Novel Mechanisms for Location-Tracking Systems
6 Will-be-set-by-IN-TECH
describe two algorithms that can benefit of a very low-computational cost, namely the
Stress-of-a-MAjorizing-Complex-Objective-Function (SMACOF) Cox & Cox (2000) and the
Range-Global Distance Continuation (R-GDC) Destino & Abreu (2009c); More & Wu (1997).
2.2 Classical Multidimensional Scaling (CMDS)
The CMDS is an algebraic technique to solve the localization problem posed as in equation
(11). Specifically, the CMDS algorithm relies on the EDM
N
− S
N
+
relationship given in
equation (9) Schoenberg (1935) and it can be concisely summarized as
ˆ
P
o
=
[U]
UL:N×η
·[(Λ)
1
2
]
UL:η×η
T
, (13)
where
ˆ
P
o
is a representation of the desired estimates coordinates
ˆ
P up to rigid motions
(rotation, mirroring and shifting) and scaling,
[·]
UL:n×q
denotes the n-by-q upper-left partition
and the matrices U and Λ are the eigenvector and eigenvalue matrices (both in decreasing
order) of
˜
K
K(
D
).
Notice however, that the CMDS performs optimally only if all pairwise links are observed and
all weights are unitary. In the other cases, the accuracy of the solution computed via CMDS
can be very poor and not sufficient for any location-based application. Furthermore, it is
imperative to remind that the real nodes’ location estimates
ˆ
P are computed from
ˆ
P
o
applying
a procrustes operation, which calculates the scaling, rotation, mirroring and shifting factors
based on the location of the anchors.
2.3 Semi-definite Programming (SDP)
The SDP method is one of the most powerful algorithms for network localization and it is
able to handle incomplete and imperfect data Biswas, Liang, Toh, Wang & Ye (2006). The
fundamental idea of the SDP method is to find the EDM-estimate
ˆ
D
[
ˆ
d
ij
] of rank at most
η
+ 2 closest to the observed EDM-sample
˜
D, in the Frobenius norm sense. Because of the
rank-constraint, the optimization problem is not convex, nevertheless, a rank-relaxation can
be adopted such that the final optimization problem is
min
ˆ
K,
{
ˆ
B
ij
}
∑
ij∈H
w
ij
ε
ij
(14)
s.t.
[−
˜
d
ij
1]
ˆ
B
ij
[−
˜
d
ij
1]
T
= ε
ij
, ∀ij
[0
η
e
i
−e
j
]
ˆ
K
[0
η
e
i
−e
j
]
T
= ν
ij
, i, j ≥ N
A
[a
i
−e
j
]
ˆ
K
[a
i
−e
j
]
T
= ν
ij
, i ≤ N
A
, ∀j
ˆ
B
ij
⎡
⎣
1 b
ij
b
ij
ν
ij
⎤
⎦
0
ˆ
K
I
η
ˆ
Z
T
ˆ
Z
ˆ
Y
0
428
Novel Applications of the UWB Technologies
Novel Mechanisms for Location-Tracking Systems 7
where 0
η
is a vector of zeros and e
i
∈ R
N
T
the only non-zero element isa1atthei-th element.
The SDP formulation can be optimally solved using standard convex SDP optimization
software, such as SDPA, CSDP, SDPT3, SeDuMi
1
, however, the computational complexity
grows quickly with the number of variables and constraints.
2.3.1 SMACOF
The SMACOF technique is another optimization method, that in contrast to the SDP and
C-MDS algorithm, operates on the space of the variables ˆz
i
’s. The fundamental idea
in SMACOF is to find the minimum of a non-convex function by tracking the global
minima of the so-called majored convex functions
T (
ˆ
P, Y
). As illustrate in figure 3 the
majorinzing function is computed from from the original objective and a given point
ˆ
P
=
ˆ
X.
Mathematically, such a function is given by
T (
ˆ
P, Y
)=
∑
w
2
ij
·
˜
d
2
ij
+ tr
ˆ
P
T
·H·
ˆ
P
−2 ·tr
ˆ
P
T
·A(Y)·Y
, (15)
where tr
(·) denotes the trace, Y ∈ R
N×η
is an auxiliary variable and the entries of H and A(Y)
are given by
h
ij
=
⎧
⎪
⎨
⎪
⎩
N
∑
i=1
i
=j
h
ij
, i = j,
−w
2
ij
, i = j,
(16a)
a
ij
=
⎧
⎪
⎪
⎪
⎪
⎨
⎪
⎪
⎪
⎪
⎩
N
∑
i=1
i
=j
a
ij
, i = j,
w
2
ij
·
˜
d
ij
y
i
−y
j
2
, i = j.
(16b)
The SMACOF algorithm, therefore, consists of an iterative method that converges to a solution
ˆ
P that depends on the initial estimate
ˆ
P
(0)
. The main advantage is that at the n-th iteration the
global minimum
ˆ
P
(n)
min
of the majored function T (
ˆ
P, Y
) with Y =
ˆ
P
(n−1)
min
, can be computed in
closed form via the Guttman transform,
ˆ
P
(n)
min
= H
†
·A
ˆ
P
(n−1)
min
·
ˆ
P
(n−1)
min
, (17)
where
†
denotes the pseudoinverse and A
ˆ
P
(n−1)
min
is the matrix with elements a
ij
.
2.3.2 Nearly optimum WLS minimization
Recently, in Destino & Abreu (2009c) a novel low-complexity algorithm was proposed to
solve the WLS optimization problem with nearly optimal performance. The minimization
method, hereafter referred to as the R-GDC algorithm, is based on the global continuation
method proposed in More & Wu (1997), which can be summarized as the iteration of three
fundamental steps: smoothing, minimization and continuation. In the smoothing step the entire
1
SeDuMi runs in Matlab©and uses the Self-Dual method for solving general convex optimization
problems, etc.
429
Novel Mechanisms for Location-Tracking Systems
8 Will-be-set-by-IN-TECH
−
0
.
5 0 0
.
5
1 1.
5
2
0
0.5
1
1.5
2
2.5
3
3.5
4
T (
ˆ
X, Y|
˜
D), −∞ ≤ Y ≤ 0.1
T (
ˆ
X, Y|
˜
D), 0.1 ≤ Y ≤ 0.4
T (
ˆ
X, Y|
˜
D), 0.4 ≤ Y ≤ +∞
ln L(
ˆ
X|
˜
D)
Fig. 3. Illustration of the majorizing functions T (
ˆ
P
=
ˆ
X
|Y, D) in the optimization of
WLS-objective function related to a source-localization problem in η
= 1 dimension. The
function ln L
(
ˆ
X
|D) is the WLS-objective with
˜
d = d. On the x-axis, we have plotted the
network, where the anchors and the target are indicated with a black square and a white
circle, respectively.
objective is approximated by function with a higher degree of differentiability (smoothed),
obtained by means of a convolution of the original function with a Gaussian kernel g
(x; λ )
g(x; λ)=exp
−
x
2
λ
2
, (18)
where the parameter λ controls the smoothing degree.
In the minimization step each of these smoothed functions is minimized using a conventional
Newtonian algorithm Nocedal & Wright (2006). Finally, the continuation refers to the process
of tracing the global minimum, which in practice is typically performed by initializing the
minimization of the next smoothed objective with the latest solution.
In figure 4, for instance, an illustrative example of the GDC method is shown, where the
non-convex objective function s
(x) is given by the sum of Gaussian functions. The dark and
the thin lines indicate the original and the smoothed objective functions, respectively. The
smoothed functions are obtained via the convolution of the original objective s
(x) with the
Gaussian kernel g
(x; λ ) given in equation (18). The algorithm starts with the minimization
of the most smoothed function (largest λ), from which a new iteration will be initiated. This
process is then repeated until λ
= 0, from which the solution of the optimization problem is
obtained.
In the context of network localization, this technique consists of
ˆ
Z
(k)
= min
ˆ
Z
∈R
N
T
×η
f
R
λ
(k)
(
ˆ
Z
),1≤ k ≤ K, (19)
430
Novel Applications of the UWB Technologies
Novel Mechanisms for Location-Tracking Systems 9
−5 0 5 10
−4
−3.5
−3
−2.5
−2
−1.5
−1
−0.5
0
Optimization via GDC Technique
(Sum of Gaussian functions)
x: variable
s(x) objecitve function
Estimated minimum
Smoothed objective
Original objective
λ → 0
Fig. 4. Illustration of the GDC method. Starting from the original objective (dark line) and
give a set of smoothing parameters λ, smoothed versions (thin line) of the original objective
are computed. Iterating the process smooth-minimize-continue, the global optimum of the
original objective can be found with high probability when the last minimization with λ
= 0
is performed.
where
f
R
λ
(k)
(
ˆ
Z
) is the smoothed variation of f
R
(
ˆ
Z
) and it is given by
f
R
λ
(
ˆ
Z
)=
1
π
R
η
∑
ij∈H
w
ij
˜
d
ij
−
ˆ
p
i
−
ˆ
p
j
+λu
F
2
exp( −u
2
F
) du (20)
=
∑
ij∈H
w
ij
·
λ
2
+
˜
d
2
ij
+
ˆ
d
2
ij
−λ
√
π
˜
d
ij
1
F
1
3
2
;1;
ˆ
d
2
ij
λ
2
exp
−
ˆ
d
2
ij
λ
2
, (21)
where Γ
(a) is the gamma function and
1
F
1
(a; b; c) is the confluent hypergeometric function
Abramowitz & Stegun (1965)., which can be efficiently evaluated as
1
F
1
3
2
;1;s
= 1 +
+∞
∑
m=1
s
m
·
m
∏
t=1
1
2t
2
+
1
t
, (22)
and (Abramowitz & Stegun, 1965, Eq. 13.5.1, pp. 508)
1
F
1
3
2
;1;s
=
2e
s
√
π
P
−1
∑
p=0
s
1
2
−p
p!
p
−1
∏
t=0
t
−
1
2
2
−
s
−3/2
2
√
π
M
−1
∑
m=0
(−s)
−m
m!
m
−1
∏
t=0
3
2
+ t
2
+O(|s|
−M
)+O(|s|
−P
).(23)
The minimization step is then performed with a very low-complexity mechanism, namely the
Broyden-Fletcher-Goldfarb-Shanno (BFGS), in which the gradient of the smoothed objective
431
Novel Mechanisms for Location-Tracking Systems