Nuclear Power Operation Safety and Environment Part 11 pptx
Bạn đang xem bản rút gọn của tài liệu. Xem và tải ngay bản đầy đủ của tài liệu tại đây (1.17 MB, 30 trang )
Power Uprate Effect on Thermal Effluent of Nuclear Power Plants in Taiwan
289
Taiwan the 15th largest user of nuclear power in the world. TPC was planned to perform the
1.7% MURPU for all TPC’s three operating nuclear power stations by schedule before the
end of 2009 (Table 2). Therefore, the impact from the increasing power density and thermal
release of a nuclear reactor to the environment from the heated effluent of NPP could
enlarge simultaneously. Due to Taiwan's climate is marine tropical, the entire island is hot
and humid from June to September. Moreover, the western side of the Pacific Ocean is
warmer than the east as a result of the ocean current (WTT, 2011).
The marine water temperature around Taiwan could be more than 30°C during summer
time. Therefore the impact from the waste heat of NPP could be severe and is needed to be
evaluated when performing the power uprate of NPPs. Furthermore, to comply with the
Effluent Standards of Taiwan’s Environmental Law, especially in summer, the thermal
effluent’s problem will cause the reactor must be operated at a reduced power and
consequently influence the electricity supply. This paper studies the power uprate effect
due to waste heat release from the thermal effluent of Taiwan NPPs. The investigations
were based on the thermal equilibrium of 100%, 105%, and 110% rated power, respectively.
The long term monitor data of marine water temperature were also used to evaluate the
impact level from waste heat during normal operation of NPPs. Moreover, the assessments
of some helpful methods to mitigate thermal impact on thermal effluent from NPPs and the
feasibility of these methods are also discussed correspondingly.
Parameter NPP1 NPP2 NPP3
Thermal efficiency 35% 33% 34%
Rated thermal power 1817 MW 2985 MW 2785 MW
Net electric power 636 MW 985 MW 951 MW
Waste thermal power 1181 MW 2000 MW 1834 MW
Cooling water flow rate 34570 kg/sec 43906 kg/sec 47442 kg/sec
Table 1. The operational parameters of each NPP reactor unit in Taiwan
Reactor Unit NPP1 NPP2 NPP3
Unit 1 2009.02.24 2007.11.30 2009.07.07
Unit 2 2008.07.09 2007.07.07 2008.12.02
Table 2. The MURPU completed date of NPPs in Taiwan
2. Impact of waste heat in Taiwan
In accordance with the second law of thermodynamics of Derive Kelvin Statement which
is also called heat engine formulation, it is impossible to convert heat completely into
work in a cyclic process (Hyperphysics, 2011). Hence, it is unattainable to extract energy
Nuclear Power – Operation, Safety and Environment
290
by heat from a high-temperature energy source and then transfer all of the energy into
work. At least some of the energy must be passed on to heat a low-temperature energy
sink. Therefore, there is no heat engine with 100% efficiency is possible. Waste heat is
always an unavoidably by-product of NPPs. Generally the electrical efficiency of NPP,
defined as the ratio between the input and output energy, most of the time amounts up to
33%. So the 67% heat is waste heat and must be released to the environment.
Economically the most convenient way is to exchange such heat to water and then
discharge them to sea, lake or river. If no sufficient cooling water available, most of the
NPPs will equip with cooling towers to reject the waste heat into the atmosphere. In
Taiwan, all NPPs are using marine water as the coolant and discharge the thermal water
to the nearby sea. Therefore, waste heat impact to the marine environment is very
sensitive and monitor by the public rigorously. Much more attention has been paid to
workplace ecology for quite a time.
In northern Taiwan, a number of deformed thornfishes (Fig. 2. (a)) were first found since
1993 near the thermal outlet of NPP2. Although there is no clear links between the deformed
fishes and the NPP, people directly think that the radiation is from nuclear power plant and
therefore resulted in the deformed fishes. Through research studies, high temperature of
ocean water had been proved to be the main factor of deformed Terapon jarbua and Liza
macrolepis (Hung et al., 1998; Fang et al., 2004). In southern Taiwan, coral bleaching (Fig. 2.
(b)), the whitening of diverse invertebrate taxa, was reported in July 1987 and July 1988 in
adjacent marine water of the NPP3 (Fang et al., 2004). High sea surface temperature with
high irradiance is assumed to be the primary factor in summer coral bleaching (Huang et al.,
1992; Fang et al., 2004; Shiah et al., 2006). The increasing use of marine water for industrial
cooling and the global warming might present a potential threat to the ecological
environment in the ocean.
(a) (b)
Fig. 2. (a) Deformed thornfishes in northern Taiwan ; (b) Coral bleaching in southern Taiwan
(Ching-wai Yuen, 2011)
normaldeformed 1
deformed 2
deformed 3
Power Uprate Effect on Thermal Effluent of Nuclear Power Plants in Taiwan
291
3. Effluent temperature evaluation
Because the events mentioned above were related to thermal discharge from NPPs, which
elevated the marine water temperature and caused the damage, so the Effluent Standards
of Taiwan’s Environmental Law: for effluents discharged directly into marine waters, the
temperature at the discharge point shall not exceed 42 °C; and the temperature difference
should not exceed 4 °C for surface water at 500 meters from the discharge point, are
Fig. 3. The schematic diagram of (a) a PWR; (b) a BWR. The heat transfer routes are also
depicted, respectively. (background images are taken from USNRC, 2011 b)
Nuclear Power – Operation, Safety and Environment
292
formulated to protect the ecological environment in adjacent marine water of NPPs. To
assure the feasible of power uprate in Taiwan’s NPPs, based on the Effluent Standards,
we conservatively evaluate the temperature difference between the outlet and inlet of
condenser at 100%, 105%, and 110% rated power, respectively, by simply using specific
heat capacity equation and the basic data in Table 1. Moreover, inlet and outlet
temperatures of condenser, the marine water temperatures of 500 from the effluent
discharge points, and the background marine water temperatures of 1000~1500 meters
from the effluent discharge points, which were all taken from long term temperature
monitor setup by TPC’s NPPS, are used to assess the impact level of thermal water from
June to September, respectively.
Fig. 3 (a) shows the schematic diagram of a PWR system and Fig. 3 (b) is the schematic
diagram of a BWR system. As can been seen the cooling cycle from the figure, an amount of
heat QH, which can be derived from the thermal power of NPP, is transferred from the
reactor, the net work W is delivered to the electric generator as it is driven by turbine, and
the waste heat Q
C
is rejected to the cooling water in the condenser and then discharged to
the sea which could lead to the thermal pollution problem. To evaluate the elevated
temperature of the effluent from NPPs, the waste heat Q
C
of the is simply got by the
following equation:
Coutin
QmC(T T)mCT
=
⋅⋅ − = ⋅⋅Δ
(1)
where
m
is the mass flow rate of cooling water (kg/sec), C is the specific heat of water
(4186 joule/kg/°C),
out
T is the outlet temperature of condenser (°C),
in
T is the inlet
temperature of condenser (°C), and
T
Δ
is the difference between the outlet temperature and
of the inlet temperature condenser (°C). Moreover, the waste heat Q
C
can also be expressed
by
CH
QQ(1-)
η
=
(2)
whereηis the thermal efficiency and is defined as:
HC
HH
WQ-Q
η
== (3)
Using (1), (2), and the data listed in Table 1, the elevated temperature can be simply
calculated. Furthermore, the
T
Δ
at 100% power is used to predict the average elevated
temperature of cooling water at 105%, and 110% power, respectively.
4. Effluent temperature and the reduction of seawater temperature
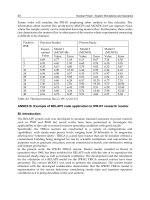
Table 3 lists the results of calculated temperature difference between inlet and outlet of
condenser at 100%, 105%, and 110% rated power of NPP1, NPP2, and NPP3, respectively.
The differential temperature from on-line monitor, at 100% normal operation power, and the
predicted temperature differences at 105% and 110% rated power, are also shown in the
table, correspondingly.
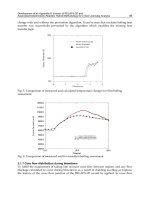
Fig. 4 displays the average water temperature of each NPP at the condenser inlet and outlet
from June to September in 2006. Apart from, the corresponding data of 2007 are shown in
Fig. 5. The elevated temperatures of cooling water after passing through condenser can also
Power Uprate Effect on Thermal Effluent of Nuclear Power Plants in Taiwan
293
be seen in the figures. As can be seen, the average inlet temperatures are 27.0, 27.9, and 28.9
°C for NPP1, NPP2, and NPP3; whereas the corresponding outlet temperatures are 36.2,
39.9, and 36.8 °C for NPP1, NPP2, and NPP3 by averaging the values of 2006 and 2007,
respectively. Also shown in the figures of the elevated temperatures are calculated to be 8.2,
10.9, and 9.2 °C for NPP1, NPP2, and NPP3; whereas the corresponding monitoring data are
9.2, 12.0, and 7.9 °C for NPP1, NPP2, and NPP3 by averaging the values of 2006 and 2007,
respectively. Therefore, the temperature difference between calculated and monitor data are
1.0, 1.1, and -1.3 °C. The different trend between them might be caused by more heat loss
into atmosphere during heat exchanging at steam generator of PWR. Notably, the highest
elevated temperature of NPP2 is 12 °C. According to the ocean observation of Taiwan, the
marine water temperature could be near 30 °C in summer (CWBS 2011), thus the outlet
temperature of condenser could be possible over 42 °C. From Fig. 4 and Fig. 5, we can also
observe the outlet temperature of condenser is just around 42 °C especially in July. To avoid
the effluent temperature exceeding 42 °C which is the limitation temperature of the
Environmental Law, TPC cautiously operates NPP in the condition that the outlet
temperature of condenser could be under 42 °C. Otherwise the operators of NPPs will
operate the reactor from full power to a lower power. This will make TPC in a dilemma
especially when the electricity demands are often urgent in summer. Thus for NPP2’s power
uprate it is better to take feasible engineering actions to lower 0.6~1.1 °C of the elevated
temperature.
%
Power
Calculated elevated
temperature (°C )
Average elevated
temperature of cooling
water (°C)
NPP1
100 8.2 9.2
105 8.6 9.6*
110 9.0 10.0*
NPP2
100 10.9 12.0
105 11.5 12.6*
110 12.0 13.1*
NPP3
100 9.2 7.9
105 9.6 8.3*
110 10.1 8.8*
*Predicted value
Table 3. Average water temperature differences between condenser inlet and outlet of
NPP1, NPP2, and NPP3, respectively
Nuclear Power – Operation, Safety and Environment
294
06/01/2006 07/01/2006 07/31/2006 08/30/2006 09/29/2006
0
10
20
30
40
50
ΔT
ave
(
o
C) T
inlet
(
o
C) T
outlet
(
o
C)
NPP1 9.2 26.7 35.9
NPP2 12.1 27.7 39.8
NPP3 7.8 28.2 36.0
ΔT
Inlet
Outlet
42
0
C
Water temperature (
0
C)
Fig. 4. The average temperature of NPP1, NPP2, and NPP3 at the condenser inlet and outlet
from June to September in 2006. ΔT is the elevated temperature of cooling water between
the condenser inlet and outlet. NPP3 was not operated in full power before June 15
06/01/2007 07/01/2007 07/31/2007 08/30/2007 09/29/2007
0
10
20
30
40
50
ΔT
ave
(
o
C) T
inlet
(
o
C) T
outlet
(
o
C)
NPP1 9.2 27.3 36.5
NPP2 11.9 28.1 40.0
NPP3 8.0 29.6 37.6
ΔT
ave
Inlet
Outlet
42
0
C
Water temperature (
0
C)
Fig. 5. The average temperature of NPP1, NPP2, and NPP3 at the condenser inlet and outlet
from June to September in 2007. ΔT is the elevated temperature of cooling water between
the condenser inlet and outlet
Power Uprate Effect on Thermal Effluent of Nuclear Power Plants in Taiwan
295
To reduce the effect of thermal effluent to the marine water ecology adjacent NPP, some
effective methods: for example, prolong the discharge point by extending the path distance
of effluent, lower the influent temperature by pumping deep level (deeper than 300 m)
marine water, enlarge the transfer area of condenser, increase the flow rate of coolant by
using higher power pumps, and improve the heat transfer efficiency by cleaning the pipes
or replacing high efficiency pipes, can be used. However, these methods could be difficult to
perform because of the huge engineering cost or the induction of side effects, such as water
hammer, to the reactor system. Therefore, they are economically impractical or infeasible in
solving the thermal effluent problem of NPPs.
Recently, a possible technical solution for increasing the thermoelectrical plant efficiency has
been proposed by reducing the cold source temperature (Şerban et al., 2010). The method is
originated from the concept of lowering the cooling water temperature by pumping deep
level marine water. Approximate 10~20 °C reduction of influent temperature can be
achieved by pumping from the 150~500 m ocean depth where the temperature is
independent on the season and ranges between 5 ~15 °C. It can effectively reduce the cold
source’s temperature for open circuit and may increase the rated power of a thermal power
plant with 2~4 % without increasing fuel consumption. The method can obviously
overcome the problem of large variations of temperature function of the weather conditions
and season. Moreover, the surface sea water often contains a lot of microorganisms that can
nourish and deposit on the heat transfer pipes. Thus can more or less affect the heat
exchange ability and lower the power efficiency. This innovative installation can provide a
cold influent to NPPs and circumvent the pumping of polluted sea water. It will be very
helpful to the power uprate of NPPs.
In Taiwan, dilution pump, which is currently being used at NPP3 (Fig. 6), of the same level
as circulation pump can be employed to pump the background marine water (~30 °C) to
mix with thermal effluent (~38 °C) before it is discharged into the ocean. Moreover, there are
at least two obvious advantages to install the dilution pump at NPP although additional
electricity consumption needed to operate the pump: firstly, it can regulate the thermal
effluent temperature of NPP especially in summer time; secondly, it can be also a
redundancy of circulation pump.
The idea of dilution pump is originated with the thermal equilibrium concept:
Heat rate lost by thermal water = Heat rate gained by cool water
tw cw
QQ−=
(4)
and then the following equation can be utilized to calculate the reduced temperature diluted
by the marine water,
tw tw cw cw
Cm T Cm T
−
Δ= Δ
(5)
where
tw
Q
is the thermal water heat loss rate (W/sec),
cw
Q
the cool water heat gain rate
(W/sec),
tw
m
the thermal water flow mass (kg/sec),
cw
m
the cool water flow mass (kg/sec),
C the specific heat of water (4186 joule/kg/°C),
tw
TΔ the temperature difference of thermal
water (°C),
cw
TΔ the temperature difference of cool water (°C), respectively.
In NPP3, there are four circulation pumps for each unit; the power of dilution pump is 1.07
larger than the circulation pump. Thus 2.1 °C reduction of the outlet coolant for one unit can
Nuclear Power – Operation, Safety and Environment
296
be got from equation (5). Similarly, the reduced temperature of the outlet coolant can be 2.4
°C if one dilution pump installed on one unit at NPP2. It is sufficient to compensate the
thermal impact causing by the power uprate and make sure that the effluent temperature
can be less than 42 °C.
Fig. 6. The schematic flow diagram of dilution pump at NPP3
On the other hand, the Effluent Standards also require that the temperature difference (
ΔT)
should not exceed 4°C for surface water at 500 meters from the discharge point. Therefore,
TPC arranges temperature monitors around the outfall point at each NPP to biweekly
inspect the water temperature (Peir et al., 2009). Fig. 7, Fig. 8, and Fig. 9 show the monitor
locations of NPP1, NPP2, and NPP3, respectively. As can be seen, there are two monitor
groups, group A which is 500 m away from the discharge point, and corresponding group
B, which is 1000~1500 m away from the discharge point and is set as the background
temperature of marine water. The monitor results showed that the average temperature
differences between group A and corresponding group B should less than 4 °C. The most
probable zone for
ΔT exceeding 4°C is an area in the range of thermal effluent outfall and
group A monitors. Intuitively, the
ΔT greater than 4°C should be more frequently observed
at the points N1A1, N2A2, N2A3, N3A2, and N3A3 than other points. But the discharged
effluent travels in a canal and then mixes with sea water at a distance of 50-500 meters from
the discharge point. The travelled distance of the effluent is dependent on the coastal
current and littoral drift. Therefore, we observe some of the prompt values of
ΔT could not
be as expected under the limitation of 4°C (RRTC, 2006, 2007).
Power Uprate Effect on Thermal Effluent of Nuclear Power Plants in Taiwan
297
121.57E 121.58E 121.59E 121.60E 121.61E
25.27N
25.28N
25.29N
25.30N
25.31N
Latitude
Longitude
the Most Probable Zone for ΔT > 4
o
C
Influent
Effluent
N1B3
N1B2
N1B1
N1A3
N1A2
N1A1
Chinshan
Fig. 7. The locations of water temperature monitors group A, N1A1, N1A2, and N1A3 and
corresponding group B, N1B1, N1B2, and N1B3 at NPP1. Group A is 500 m away from the
effluent discharge point. Group B is set as the background temperature of marine water
121.65E 121.66E 121.67E 121.68E 121.69E
25.19N
25.20N
25.21N
25.22N
25.23N
Latitude
Longitude
Influent
the Most Probable Zone for ΔT > 4
o
C
Effluent
N2B3
N2B2
N2B1
N2A3
N2A2
N2A1
Kuosheng
Fig. 8. The locations of water temperature monitors group A, N2A1, N2A2, and N2A3 and
corresponding group B, N2B1, N2B2, and N2B3 at NPP2. Group A is 500 m away from the
effluent discharge point. Group B is set as the background temperature of marine water
Nuclear Power – Operation, Safety and Environment
298
120.73E 120.74E 120.75E 120.76E 120.77E
21.92N
21.93N
21.94N
21.95N
21.96N
Latitude
Longitude
Influent
Maanshan
N3B3
N3A3
N3A2
N3A1
N3B2
N3B1
the Most Probable Zone
for
ΔT > 4
o
C
Effluent
Fig. 9. The locations of water temperature monitors group A, N3A1, N3A2, and N3A3 and
corresponding group B, N3B1, N3B2, and N3B3 at NPP3. Group A is 500 m away from the
effluent discharge point. Group B is set as the background temperature of marine water
ID No. 2006 2007
NPP1
N1A1 0 0.49
N1A2 0 0
N1A3 0 0
NPP2
N2A1 0 1.61
N2A2 0.18 0.62
N2A3 0.85 0.13
NPP3
N3A1 0.03 0
N3A2 0 0
N3A3 0 0
Table 4. The prompt probability that the temperature difference greater than 4°C between
monitor group A and corresponding group B in 2006 and 2007
Table 4 lists the prompt probability of exceeding temperature, which is the data number
ratio between exceeding temperature and all measured data, that the temperature difference
Power Uprate Effect on Thermal Effluent of Nuclear Power Plants in Taiwan
299
is greater than 4 °C between group A and corresponding group B in 2006 and 2007,
respectively. As shown, the probability is highest at NPP2; while NPP1 is the second and
then is the NPP3. The temperature differences were all less than 4.8 °C and all events were
happening in summer (RRTC, 2006, 2007). The probability is apparently dependent on the
elevated temperature of effluent and probably on its flow rate, its discharge type, the wind’s
direction, and coastal current. Current stagnation near the coast, where forming the most
probable zone for the temperature difference greater than 4 °C, could also be another
possible reason. As shown in Table 5 (the seawater temperatures measured at Longdong
buoy which is also set up by Central Weather Bureau located at 120.82280E, 21.90220N near
NPP1 and NPP2) and Table 6 (the seawater temperatures measured at Erluanbi buoy which
is set up by Central Weather Bureau located at 121.93073E, 25.09348N near NPP3), the
average seawater temperatures in adjacent to NPP3 can be 1.0~2.1 °C higher than those of
NPP1 and NPP2 during summer, while the prompt probability of exceeding temperature is
not correspondingly high. Obviously, by using the dilution pump the heated effluent can be
effectively diluted with the background marine water and the discharge flow rate can be
increased. The former will directly reduce elevated temperature of effluent; while the latter
makes the thermal water be pushed longer away from the seashore. Thus makes the power
uprate of NPPs not violating the Environmental Law. Besides, according to the observation
data of the seawater temperatures in Table 5 and Table 6, the average seawater temperatures
were in the range of 26.1 ~ 27.9
℃near NPP1 and NPP2, and of 28.2 ~ 29.1 ℃near NPP3 from
Month
Maximum
Seawater
Temperature(
℃)
Observation
Year
Average
Seawater
Temperature(℃)
Minimum
Seawater
Temperature(
℃)
Observation
Year
1 22.8 2001 19.1 15.6 2003
2 23.2 2007 18.7 15.1 2005
3 25.0 2007 19.4 13.8 2000
4 27.9 2002 21.6 14.5 2000
5 28.9 2007 23.9 18.2 2009
6 29.7 2001 26.1 20.0 1999
7 31.5 2001 27.6 16.6 2008
8 31.7 2001 27.9 16.1 2009
9 31.1 2001 26.7 18.6 2008
10 27.4 2000 24.0 19.2 2005
11 26.3 2001 22.2 17.5 2009
12 24.2 2006 20.2 16.8 2004
Table 5. The seawater temperatures measured at Longdong buoy which is set up by the
Central Weather Bureau located in the northern Taiwan near NPP1 and NPP2 (CWBS, 2011)
Nuclear Power – Operation, Safety and Environment
300
June to September, respectively. In the northern Taiwan near NPP1 and NPP2, the
maximum seawater temperature 31.7
℃ was observed in August, 2001, and in the southern
Taiwan near NPP3, the maximum seawater temperature 36
℃ was observed in July, 2005.
Notably TPC has performed the 1.7% MURPU for all TPC’s operating NPPs during 2007
and 2009. The increasing release of waste heat should directly causing the maximum
seawater temperature is observed immediately after 2007. However, based on the
observation data of CWBS, the elevation of seawater temperature does not increase
correspondingly after the MURPU of NPPs in Taiwan. Although the additional influence of
the ecology due to the thermal effluent of MURPU is insignificant at present, TPC has better
monitor the seawater temperatures near NPPs continually for further power uprate (SPU or
EPU) in the future. Moreover, the installation of dilution pump or innovation of pumping
deep level water to effectively reduce the influent temperature could be two feasible options
for prevailing over the difficulty of waste heat problem in power uprate.
Month
Maximum
Seawater
Temperature(
℃)
Observation
Year
Average
Seawater
Temperature(℃)
Minimum
Seawater
Temperature(
℃)
Observation
Year
1 28.9 2001 24.8 18.7 2006
2 28.4 2001 24.9 20.1 2005
3 30.6 2001 25.5 20.7 2005
4 31.2 2001 27.1 22.4 2005
5 32.5 2001 27.8 19.8 2002
6 32.1 2007 28.2 21.2 2002
7 36.0 2005 29.1 20.8 2002
8 33.7 2007 29.0 23.0 2004
9 32.7 2007 28.9 22.5 2005
10 30.4 2009 28.1 21.0 2001
11 29.4 2002 26.4 21.1 2003
12 29.2 2002 25.1 16.1 2003
Table 6. The seawater temperatures measured at Erluanbi buoy which is set up by the
Central Weather Bureau located in the southern Taiwan near NPP3 (CWBS, 2011)
5. Conclusion
In conclusion, the 100%, 105%, and 110% rated power of Taiwan’s NPPs are performed to
assess the power uprate effect on thermal effluent under normal operation. Based on the
long term monitor data of marine water temperature from June to September in 2006 and
2007, the results show that the effluent temperatures of NPP2 could have the opportunity to
exceed the limitation 42 °C at the discharge point and the prompt probability of temperature
Power Uprate Effect on Thermal Effluent of Nuclear Power Plants in Taiwan
301
difference exceeding 4 °C for surface seawater at 500 meters from the discharge point could
be higher for each NPP in summer. Feasible engineering actions, such as prolonging the
discharge point by extending the path distance of effluent, increasing the flow rate of
effluent, or using dilution pump to mix the thermal effluent with the background marine
water, could be considered to mitigate the NPP’s power uprate effect to the environment.
Among others, adding the dilution pump at reactor unit is a very useful method to reduce
the elevated temperature of effluent in summer. It can economically and efficiently
compensate the power uprate influence of thermal waste heat discharging from NPPs. TPC
has accomplished the 1.7% MURPU for its three operating NPPs during 2007 and 2009. The
elevation of seawater temperature is currently not significant after the MURPU of NPPs.
Long term observation of the additional influence on the ecology due to the thermal effluent
of MURPU is needed in the future.
6. Acknowledgment
The author is grateful to Taiwan Power Company for the financial supports. Also the
author would like to express his sincere thanks to Prof. Shih C.K. for his encouragement and
valuable discussions in this work.
7. References
Ching-wai Yuen (2011), available on the Internet at
CWBS (Central Weather Bureau Statistics), Taiwan (2011). >Home>Statistics>Marine
Statistics>Water Surface Temperature Statistics, available on the Internet at
Fang, T.H., Chen, J.F., Tu, Y.Y., Hwang, J.S., and Lo, W.T. (2004). Hydrographical Studies of
Waters Adjacent to Nuclear Power Plant I and II in Northern Taiwan,
J. Mar. Sci.
Technol.,
Vol. 12, No. 5, pp. 364-371
Hung, T.C., Huang, C.C., and Shao, K.T. (1998). Ecological Survey of Coastal Water
Adjacent to Nuclear Power Plants in Taiwan,
Chem. Ecol., Vol. 15, pp. 129-142
Huang, C.C., Hung, T.C., and Fan, K.L. (1992). Nonbiological Factors Associated with
Coral bleaching in Shallow Water near the Outlet of the Third Nuclear Power
Plant, Southern Taiwan,
UNEP Reg. Seas Rep. Stud., Vol. 147, pp. 205-224, Taipei,
Taiwan
Hyperphysics (2011), available on the Internet at
Peir, J.J., Shih, C.K., Pei, B.S., Ferng, Y.M., and Hsu, W.S. (2009). Power Uprate Impact
Evaluations on Waste Heat of Nuclear Power Plants in Taiwan, Brussels, Belgium
ICONE17: Proceedings of the 17
th
International Conference on Nuclear
Engineering, Vol. 1, pp. 201-207
RRTC (Research Report of Taipower Company), Taipower Company (2006, 2007). The
Survey of Thermal Effluent of the Nuclear Power Plants
Şerban V., Panait A., Ţenescu M., Mingiuc C., Niţă I., Androne M., Ciocan G.A., and Zamfir
A.M. (2010). Possible Solutions for Increasing the Thermoelectrical Plant Efficiency
Nuclear Power – Operation, Safety and Environment
302
and for Pollution Decreasing, Neptun, Romanian, Proceedings of the WEC
Regional Energy Forum – FOREN 2010
Shiah, F.K., Wu, T.H., Li, K.Y., Kao, S.J., Tseng, Y.F., Chung, J.L., and Jan, S. (2006). Thermal
effects on heterotrophic processes in a coastal ecosystem adjacent to a nuclear
power plant,
Mar. Ecol. Prog. Ser., Vol. 309, pp. 55–65
USNRC (2011 a). >Home>Nuclear Reactors>Operating Reactors>Licensing>Power
Uprates> Types of Power Uprates, available on the Internet at
/>power.html
USNRC (2011 b). >Home>Nuclear Reactors>Operating Reactors>Licensing>Power
Uprates> Types of Power Uprates, available on the Internet at
WTT (Windows to Universe), (2011). Available on the Internet at
Part 3
Radiation Effects
14
Long-Term Effects of Exposure to Low-Levels
of Radioactivity: a Retrospective Study of
239
Pu and
90
Sr from Nuclear Bomb Tests on the
Swiss Population
Pascal Froidevaux
1
, Max Haldimann
2
and François Bochud
1
1
Institute of Radiation Physics, University Hospital Center and University of Lausanne
2
Consumer Protection, Chemical Risks, Federal Office of Public Health
Switzerland
1. Introduction
The production of nuclear energy may be a source of exposure to ionizing radiations, either
for nuclear workers or the general population. Ionizing radiations are one of the most
studied and ubiquitous carcinogens in our environment. The main basis for estimating the
carcinogenic risk to humans are studies conducted on survivors of the Japanese atomic
bomb, a population essentially exposed to acute high dose rates (Cardis et al., 2005b).
Epidemiological studies of nuclear workers, who have been chronically exposed to much
lower radiation doses show evidences that the classic approach of radiation protection based
on the linear non threshold (LNT) model is valid: an excess relative risk (ERR) of cancers
other than leukemia of 0.97 per Sv was found among a cohort of more than 400,000 nuclear
workers in 15 different countries, all individually monitored for external exposure.
Additionally, the study showed an ERR of 1.93 per Sv for leukemia, a disease that may be
associated with radiation exposure (Cardis et al., 2005b). Nevertheless, these findings were
not confirmed in a later study of workers from the French National Electricity Company
(Rogel et al., 2005), and neither in the study of the United Kingdom Atomic Energy
Authority (Atkinson et al., 2004). Conversely, both studies showed a strong healthy worker
effect (HWE). Higher cancer rates are related to a significant cumulative radiation dose
(Hunter and Muirhead, 2009). Besides, an adverse effect on the pulmonary function when
exposed to
137
Cs has also been recently demonstrated for children living near the Chernobyl
exclusion zone (Svendsen et al., 2010). Currently, there is a tremendous interest in the study
of the Techa River cohort (TRC), a population which was exposed to low to moderate
radiation doses at low-dose rates from radioactive releases from the Mayak plutonium
production facilities into the Techa river between 1950 and 1956 (Degteva et al., 2000;
Tolstykh et al., 2001; Krestinina et al., 2010). At total body doses as high as 10 Gy, 30% of
cancer deaths have been attributed to plutonium exposure among the Mayak workers
(Sokolnikov et al., 2008). In that particular case of worker exposure to high doses of
radiation, the ERR due to plutonium exposure was 7.1 per Gy for males at age 60.
While numerous studies of the effect of ionizing radiation on nuclear workers exist, there
are only a few studies which extend their research to the general population. Among any
Nuclear Power – Operation, Safety and Environment
306
given population, children are considered at higher risk (BEIR7, 2006) and several studies
have focused on the risk of leukemia for children living in the proximity of a nuclear power
plant (NPP)(Roman et al., 1999; Doyle et al., 2000; Cardis et al., 2005a; Kaatsch et al., 2008;
Nussbaum, 2009). Laurier et al. (Laurier et al., 2008) have reviewed studies dealing with as
much as 198 nuclear installations, three of them showing a significant excess of leukemia
among children under 18 years of age (on the order of 5 cases detected for less than one
expected). While the statistics tend to support the excess risk, the radioecological studies
carried out on these sites failed to correlate the ERR with a significant increase of
radioactivity burden in the environment or in food (Heasman et al., 1986; Black et al. 1994;
Bithell et al., 1994; Hoffmann et al., 1997). The most recent study concerning the adverse
effects of living in the proximity of a NPP revealed an odd ratio (OR) of 2.19 (with lower
one-sided 95% confidence limit of 1.51) for leukemia in young children living in the vicinity
of German NPP (Kaatsch et al., 2008). This study gave rise to new questions about the
relationship existing between ERR and the distance to a NPP and the way to demonstrate
the role, if any, of ionizing radiation in the observed ERR.
Most epidemiological studies on the effect of NPP on a general population, especially
children, link leukemia statistics with the proximity to a NPP. No clear evidence came out of
these studies and by their nature, these studies are subject to bias. There have been very few
attempts to correlate leukemia cases with radiation dose because this latter is mostly
unknown with respect to the general population, or considered much lower than the natural
radiation background. In this respect, some authors have introduced a measure of doubt
regarding the validity of the dose factors used for the fetus and newborn (Nussbaum, 2009;
Shore, 2009); ERR of leukemia among children under 5 years of age living in the vicinity of
a NPP may be the consequence of the father’s exposure to radiation or direct fetus exposure,
with a possibility that dose factors have been largely underestimated. While this assumption
may be valid, Doyle et al. (Doyle et al., 2000) found no evidence of a link between exposure
to low-level ionizing radiation before conception and an increased risk of adverse
reproductive outcomes in men working in the nuclear industry. Nevertheless, the authors
state that a possible link between a woman’s exposure to radiation before conception and an
increased risk of fetal death requires further investigation.
In addition to the lack of knowledge about the exposure dose to the population, dose rates
due to in-vivo alpha-emitters, particularly transuranic elements, have been totally
overlooked, mainly because of measuring difficulties (Schmitz-Feuerhake et al., 2005). Our
opinion is that there is a lack of data on the radioactivity body burden of the general
population, and in particular children. This information would facilitate the interpretation
of leukemia statistics in terms of radiation dose rather than in terms of the distance to a
radiation emission source (e.g. a NPP).
The determination of the external radiation dose in the vicinity of a NPP is obviously
mandatory but may be of little use in the case of the risk related to very low doses of
ingested or inhaled radionuclides. In this respect, the main challenge of national authorities
is to survey diet and, possibly, the population body burden. While radioactivity surveys of
food and the environment are a dedicated task of every laboratory dealing with
environmental radioactivity surveys (Froidevaux et al., 2006a), the determination of very
low-levels of radioactivity in the body is another challenge; whole body counting may
provide data on
137
Cs (or other γ-emitters) contamination (Hodgson et al., 2004), but
previous studies show that
90
Sr and plutonium could be the most radiotoxic isotopes that
Long-Term Effects of Exposure to Low-Levels of Radioactivity:
a Retrospective Study of
239
Pu and
90
Sr from Nuclear Bomb Tests on the Swiss Population
307
should be searched for (Atkinson et al., 2004). Over the last ten years, mass-spectrometry
has been applied as an alternative detection method for measuring actinides, especially
plutonium. Using ICP-MS, the detection limit is lowered by a factor of ten compared to
alpha-spectrometry. The detection limits at the femtogram-level needed for some particular
environmental samples, are typically obtained by double focusing sector-field ICP-MS
instruments or TIMS (Kim et al., 2000; Becker, 2003; Boulyga et al., 2003; Agarande et al.,
2004; Baglan et al., 2004; Lindahl et al., 2010; Qiao et al., 2010). Using sf-ICP-MS, we were
recently able to determine
239
Pu and
239
Pu/
240
Pu ratio in the milk teeth of children born in
Switzerland between 1951 and 1995 (Froidevaux and Haldimann, 2008) and in the vertebrae
of individuals who died between 1962 and 2004 (Froidevaux et al., 2010).
Bones and teeth are both the main targets of plutonium and
90
Sr entering the blood stream.
Approximately 100% of
90
Sr and 50% of the plutonium incorporated in humans is located in
the skeleton. Another 30% of the plutonium burden is located in the liver (ICRP
(International Commission on Radiological Protection), 1986). In this respect, the analysis of
teeth and bones may be of great help to investigate low dose and low dose-rate exposure to
radionuclides potentially emitted throughout the process of nuclear energy production
(Culot et al., 1997). Among teeth, milk teeth (deciduous teeth) are very precious indicators
of bone-seeking radionuclides that can be transferred from the mother’s blood plasma to the
fetus. Because deciduous enamel forms between week 13 in utero up to 9 months
postnatally (thereafter essentially becoming inert), the analysis of milk teeth allows for the
retrospective measurement of prenatal and early postnatal trace-element uptake during a
critical period of child development (Dolphin et al., 2005). Another advantage of milk teeth
as a tool for retrospective studies of bone-seeking radionuclide contamination is the fact that
they are naturally shed at ages 6-12 years old. Conversely, there exists no other possibility of
bone sampling except for collection at autopsy. Unfortunately, due to legal difficulties in
obtaining samples for analysis, there are only limited data available worldwide, mostly
concerning
90
Sr (Hodgson et al., 2004). The USTUR (United States Transuranium and
Uranium Registries) is a source of very valuable information for human tissue studies,
including bones, biokinetics, bioeffects and the dosimetry of uranium and transuranium in
human. However, this database contains mainly tissues from workers exposed to
radionuclides. As an example, USTUR studies show that, in addition to skeleton and liver,
muscle is an appreciable reservoir for both plutonium and americium (Kathren, 1995).
We propose to use the
90
Sr and plutonium fallout of the nuclear bomb tests (NBT) of the
sixties as a proxy to determine the radioactivity body burden that the population has
received as a consequence of the tests. We used the Swiss databases on
90
Sr and
239
Pu in milk
teeth and bones because this latter is the most complete that is currently available
worldwide and covers a range of years from 1952-2002 (milk teeth) and 1960 to 2009
(vertebrae). We compared our results with other studies carried out worldwide. We
hypothesized that the level of both radionuclides incorporated in the skeleton has been very
low but significant as well as measurable using careful radiochemical and analytical
procedures. We put the incentive on the analysis of
239
Pu and
90
Sr in milk teeth of children
born from 1953 to 2005 to demonstrate the danger that these radionuclides may create if
transferred to the fetus across the placental barrier. In addition, we collected vertebrae of
deceased individuals (1960-2005) to measure the incorporation of very low-levels of bone-
seeking
239
Pu and
90
Sr in the body.
Nuclear Power – Operation, Safety and Environment
308
2. Experimental
90
Sr analysis in milk teeth and bones is a very dedicated task and must be carried out with
particular care to avoid bias due to other radionuclides that will be present in the sample,
such as uranium isotopes, radium isotopes and their daughter products. As a consequence,
a careful radiochemical separation of
90
Sr (or
90
Y) from the matrix and other radioisotopes is
compulsory, because
90
Sr is a β-emitter whose counting, either by LSC or proportional
counting, will be submitted to bias if other β-emitters are still present. In this respect, the
analytical method used by the Radiation and Public Health project (RPHP, see
www.radiation.org) for the determination of
90
Sr in milk teeth appears not satisfactory for
the purpose of the authors and the conclusions that they draw from their studies. This is
because the RPHP method does not use any chemical separation, except for a carbonate
precipitation that will hardly remove
90
Y, radium isotopes,
210
Pb isotopes and its daughter
210
Bi, as well as thorium isotopes and many others (see for instance Mangano and Sherman,
2011). Thus, we propose below a method that is an alternative to the classical method using
Eichrom Sr.spec resin in the analysis of
90
Sr, particularly for large sample sizes containing
significant amounts of Ca, such as teeth, milk and bone. For
239
Pu determination, the main
problem resides in the purification of plutonium from uranium, because the
238
UH
+
hydride
will interfere with the determination of
239
Pu; our methodological procedure is addressed in
the corresponding sub-chapter.
2.1 Sampling
The vertebrae have been collected by pathologists over the last 45 years all over Switzerland.
They were taken during autopsy from different adults (n=1200), of whom 80% were older than
60 and none younger than 8 at the date of death. 90% were older than 20 years in 1960. Thus
our database represents the impact of nuclear bomb tests fallout on a population of adults,
minimizing the problem of age-dependency in modelling. Milk teeth were collected by
dentists (mainly school dentists). Both vertebrae and milk teeth were collected as part of the
Sampling Program of the Swiss Federal Office of Public Health for environmental radioactivity
survey, from the beginning of the nuclear era. The whole program is currently ongoing for
90
Sr
determination in vertebrae and milk teeth.
90
Sr determination in vertebrae was carried out on
individual cases as early as 1960 and required at least 5 g of bone ash; this study reports on the
data set obtained during the last 50 years.
90
Sr analysis of milk teeth requires also at least 5 g of
teeth ash, which necessitates about 10 milk teeth of children born during the same year in the
same region.
239
Pu determination by mass spectrometry was carried out only after 2005, when
adequate technology became available (see below). The samples for
239
Pu analyses are sub-
samples of the vertebrae and milk teeth samples set used for
90
Sr determination that were
preserved for further analyses. In this respect, the plutonium data set represents a
retrospective study. To reach a satisfactory detection level and to minimize the effect of inter-
individual variability, we pooled the samples of several individuals deceased in the same year
to obtain at least 30 g of vertebrae ash per analysis. For milk teeth, we also used about 30 g of
teeth ash, which required pooling about 50 teeth of children born the same year in Switzerland
(Froidevaux et al., 2006b; Froidevaux and Haldimann, 2008; Froidevaux et al., 2010).
2.1 Radiochemistry
2.1.1 Plutonium analysis
Teeth ash was spiked with 10±0.5 mBq of
242
Pu and submitted to microwave digestion in a
Milestone MLS Ethos Plus digester (MLS GmbH, Leutkirch, Germany) for 40 minutes at
Long-Term Effects of Exposure to Low-Levels of Radioactivity:
a Retrospective Study of
239
Pu and
90
Sr from Nuclear Bomb Tests on the Swiss Population
309
170°C in 8 M nitric acid (100 ml). After filtration plutonium was extracted on a Bio-Rad (Bio-
Rad, Reinach, Switzerland) ionic exchanger (100-200 mesh, 25 ml in 1 cm diameter
chromatography column) and purified on a micro-column (100 mg) of Eichrom
®
TEVA resin
(Eichrom Environment, Bruz, France) while taking care to use Ultrapur
®
reagents (Merck,
VWR International, Dietikon, Switzerland) to minimize the uranium content (plutonium
was extracted in 5 ml of HNO
3
8 M, the column was washed with 10 ml of HNO
3
3M, 3 ml
of HCl 9 M and once again with 3 ml of HNO
3
3 M). Plutonium was measured in 5% HNO
3
by SF-ICP-MS (see below). The same analytical procedure was used for the vertebrae.
Calcium was measured on all samples by AA with a Perkin Elmer 4100 apparatus (Perkin
Elmer AG, Schwerzenbach, Switzerland) and results of plutonium isotopes activity are
given as Bq g Ca
-1
(Froidevaux and Haldimann, 2008).
2.1.2
90
Sr analysis
From 1963 to 1971, milk teeth and bones were analysed using the nitric acid fuming method
(Froidevaux et al., 2006b). After 1974 and until now, we used a method using two cation
exchange chromatography columns (AG 50w-x8, 50 and 8 ml) and specific complexing
agents such as EDTA and CyDTA (trans-1,2-cyclohexylen-dinitrilo tetraacetic acid) to purify
90
Sr. After ingrown into
90
Sr,
90
Y daughter product was purified using a cationic exchanger
(AG 50w-x8, 8 ml) and a malonate eluting solution. After precipitation of
90
Y as oxalate, the
micro-precipitated source was counted in a low-level (0.3 dpm) proportional counter
(Tennelec LB 4100w). For details of the procedure, see (Froidevaux et al., 2006b)
2.2 Mass spectrometry
Determining
239
Pu levels in most samples is hampered by the ubiquity and abundant
presence of uranium. Consequently, peak tailing from
238
U
+
and the formation of
238
U
1
H
+
molecular interference isobaric to
239
Pu are the limiting factors of plutonium analysis. The
hydrogen originates from the water solvent (Zoriy et al., 2004). Because the degrees of
ionization of uranium and hydrogen atoms in argon plasma are 100 % and about 0.1 %,
respectively, uranium hydride UH
+
is formed in the plasma, most probably through
reaction:
U
+
+ H → UH
+
To minimize the formation of
238
U
1
H ions, the chemical separation of uranium and
plutonium using a TEVA resin prior to analysis did not yield sufficient removal of uranium.
Therefore, it is essential to further reduce the formation of uranium hydride interference and
correct for the residual signal contribution at m/z 239 in order to obtain unbiased
plutonium measurements at ultra trace levels. The reduction of hydride formation of
uranium requires special sample introduction systems, such as a micronebulizer with a
desolvator. In this study, we equipped the instrument with an APEX Q desolvation device
(Elemental Scientific, Scientific, Omaha, NE, USA) in combination with an ACM membrane
unit (Elemental Scientific) that was effective in removing the solvent from liquid samples,
thereby greatly reducing the formation of
238
U
1
H
+
while retaining plutonium for transport to
the plasma ion source in the form of a dry aerosol. Additionally, this special configuration
improved the signal-to-noise ratio by a factor of about 10, which was necessary to reach the
very low plutonium concentrations. The
238
U
1
H
+
/
238
U ratio was determined experimentally
and a correction factor was applied to calculate the net
239
Pu response. The measured
Nuclear Power – Operation, Safety and Environment
310
238
U
1
H
+
/
238
U ratio of 1.4 x 10
-5
± 1 x 10
-6
was constant under the selected experimental
conditions and falls well into the range of 1.2 x 10
-4
- 5.0 x 10
-6
reported in the literature
(Becker et al., 1999; Kim et al., 2000; Boulyga and Becker, 2001; Taylor et al., 2001; Wyse et
al., 2001). We used a double focusing SF-ICP-MS (Element2; Thermo, Bremen, Germany) for
measuring the
239
Pu,
240
Pu, and
242
Pu isotopes. Furthermore, we monitored the
238
U isotope
to correct for residual background contributions to the
239
Pu signal as a result of variable
uranium concentrations in the actual sample solutions. Moreover,
199
Hg was measured to
check for potential
199
Hg
40
Ar interference. We performed 36 consecutive scans on each
sample. The total measurement time per sample was 94 s. We applied the low-resolution
mode (m/Δm = 300) to obtain maximum ion transmission. Optimum argon flow conditions
in the PFA-100-1036 nebulizer (Elemental Scientific) were in the range of 0.9–1.1 l/min at a
sample uptake rate of 235 μL/min. All other parameters of the ICP-MS corresponded to
normal operating conditions. We conducted quality controls of the chemical separation and
ICP-MS measurements by spiking 100 mL of 8 M HNO
3
with a reference solution of
239
Pu
and subjected it to the overall
239
Pu determination process. The measured value of 2.7 ± 0.1
mBq (n = 7) agreed well with the reference value of 2.8 ± 0.3 mBq.
3.
90
Sr in milk teeth
The level of
90
Sr in milk teeth has been recorded in several countries since the beginning of
the nuclear weapon tests. Data show that there are two peaks in the concentration of
90
Sr in
milk teeth versus the year of birth, in 1958 and in 1965, followed by an exponential decrease
after the entry into force of the Nuclear Test Ban Treaty (Rosenthal et al., 1964; Aarkrog,
1971; Rytomaa, 1972). There were several further studies on teeth, including permanent
teeth, initiated punctually to answer specific questions, such as how much radiation the
population received following the Chernobyl NPP accident (Kulev et al., 1994; Stamoulis et
al., 1999), the contamination from the Sellafield reprocessing plant (ODonnell et al., 1997)
or the contamination of the Techa river (Tolstykh et al., 2003; Tolstykh et al., 2008). In
Switzerland, a monitoring program of
90
Sr in milk teeth was initiated by the Federal Office
of Public Health in the late fifties and is still ongoing (Froidevaux et al., 2006b). Figure 1
displays the features of the
90
Sr content of milk teeth monitored in Switzerland (1951-2002,
(Froidevaux et al., 2006b)), Denmark (1953-1963, (Aarkrog, 1971), United-Kingdom (1960-
1971, (Hodgson et al., 2004)), Germany and Northern Ukraine (1982-1986, (Schmitz et al.,
2004)) and shows the maximum value determined in Norway (1965) and Finland (1963) and,
between 1976 and 1979, in French Polynesia (Badie et al., 1987). Dates must be understood
as the birth year of the children. For the United-Kingdom, the data represent activities found
in premolar roots of milk teeth from children aged 10 (Hodgson et al., 2004). In this respect,
and because the roots of teeth have a bone-like structure (Gulson and Gillings, 1997), these
data correspond better to the activities that can be found in trabecular bones, rather than in
the enamel of milk teeth. Figure 1 shows that
90
Sr (Bq/gCa) activities found in Switzerland
are situated between the maximum values found in Norway and Finland and the activities
determined in Denmark. Activities of premolar roots from the UK are significantly lower,
showing that milk teeth may actually accumulate
90
Sr to a larger extent than bones.
90
Sr
originating from the Chernobyl disaster (1986) has not significantly impacted Switzerland
and Germany, but possibly the slightly higher values found in milk teeth of children from
northern Ukraine may reflect the contamination of foodstuff with
90
Sr of Chernobyl or other
origins in this region. Current values found in Switzerland are close to 25 mBq/gCa.
Long-Term Effects of Exposure to Low-Levels of Radioactivity:
a Retrospective Study of
239
Pu and
90
Sr from Nuclear Bomb Tests on the Swiss Population
311
90
Sr is mostly incorporated through ingestion of contaminated food, a situation which may
last for decades after fallout deposition on soil. Worldwide studies on milk teeth
contamination demonstrate that NBTs fallout from the sixties has significantly increased the
90
Sr activity of food, especially milk, so that a very significant increase in
90
Sr (up to a value
of 0.3 Bq/gCa in 1963 in Switzerland) is observed in milk teeth. Figure 2 shows the results of
90
Sr analysis of milk for Switzerland (1954-2009) and Norway (1953-1972, (Christensen et al.,
1975)). Additionally, data for milk from New-Zealand are added for comparison of both
Northern and Southern hemispheres (Badie et al., 1987). While several large NBTs were
conducted in the Southern hemisphere, this latter presents an overall contamination several
times less than the Northern hemisphere. This fact is reflected by the very low activity
(average 14 mBq/gCa) determined in the milk teeth collected in French Polynesia, 4 times
less than in Switzerland for the same date of birth. For Switzerland, the data presented in
Figure 2 are issued from the analysis of milk collected in the Swiss lowlands. As a matter of
fact, milk activities considerably differ if the milk is sampled from cows who grazed in
Alpine pastures, with a ten times increase in activity for grazing land located at 2000 m
above sea level (Pourcelot et al., 2007).
Fig. 1.
90
Sr activities (Bq/gCa) in milk teeth as a function of the year of birth of the children.
Activities in milk samples display essentially the same features as milk teeth, with a
maximum activity observed in 1963, just before the entry into force of the Partial Nuclear
Test Ban Treaty that ended American, British and former Soviet Union atmospheric nuclear
weapon tests. Accordingly, we can conclude that the food (milk)-mother-fetus-milk teeth
pathway is the most important mechanism of milk teeth contamination. A very significant
correlation is observed between milk contamination and milk teeth contamination in
Switzerland (Pearson correlation coefficient of 0.92) with a milk-to-milk teeth transfer factor
of 0.2. In this respect, milk contamination by
90
Sr is a very good proxy of milk teeth
contamination.
Nuclear Power – Operation, Safety and Environment
312
3.1 Influence of the Swiss nuclear power plants on
90
Sr activities of milk teeth
The Swiss database on
90
Sr contamination of milk teeth contains information concerning
three distinct regions of Switzerland; the first region includes the canton of Zürich and a
large part of the Swiss German lowlands. The Gösgen, Beznau and Leibstadt nuclear power
plants (NPPs) are included in this region. The second region is the French-speaking part of
Switzerland, mainly the canton of Vaud. There is a potential influence of the Mühleberg
NPP in the Eastern part of this region. The third region is the Italian-speaking part of
Switzerland, which is shielded from the Swiss NPPs by the Alps and borders Italy which
has no active nuclear program (Froidevaux et al., 2006b).
Fig. 2.
90
Sr activities (Bq/gCa) in milk sampled in Switzerland, Norway and New-Zealand.
Figure 3 shows the results of an analysis of the
90
Sr activities of the cantons of Tessin and
Zürich as a function of the
90
Sr activities measured in the canton of Vaud, for the same years
of birth. Both correlations are very strong (Pearson coefficient =0.99), which means that the
contamination of milk teeth originated from the same event, e.g. the NBT fallout of
90
Sr.
Nevertheless, both slopes differ from unity (0.84 for Zürich and 0.82 for Tessin). This fact
may reflect a difference in consumption habits in the canton of Vaud compared to the
cantons of Tessin and Zürich . Additionally, the canton of Vaud includes large areas of the
Jura mountains and pre-alpine mountains that possibly contribute to a higher contamination
of milk (Pourcelot et al., 2007). The canton of Zürich , which is potentially under the
influence of 4 among the 5 nuclear reactors located in Switzerland, presents no statistical
differences compared with the canton of Tessin county, which is shielded from these same
reactors by the Alps. This indicates that the Swiss NNPs have had no significant impact on
the
90
Sr activities of milk teeth and that the
90
Sr in these human samples arises only from the
NBT fallout of the sixties that contaminated foodstuff and the mother-to-fetus
contamination across the placental barrier.
Long-Term Effects of Exposure to Low-Levels of Radioactivity:
a Retrospective Study of
239
Pu and
90
Sr from Nuclear Bomb Tests on the Swiss Population
313
4. Plutonium in milk teeth
There exist only a few studies on teeth contamination by plutonium. The lack of data on
plutonium in teeth is a result of the difficulty of the analysis, which requires a large sample
size to yield results above the detection limit. This is because the plutonium activity is so
low that a classical alpha-spectrometry technique is barely satisfactory to produce activities
and uncertainties that could be used to demonstrate the potential influence of NPP on the
plutonium body burden.
Fig. 3.
90
Sr activities (Bq/gCa) of milk teeth of the cantons of Tessin and Zürich as a function
of the
90
Sr activities of milk teeth of the canton of Vaud, for the same years of birth (1953-
1996).
Long et al. (1991) have determined the activity of
239+240
Pu in milk teeth of 35 different
geographically located child populations in the United Kingdom. The average concentration
was 5.2 mBq/kg of teeth ash. They concluded that there was no correlation with mean
annual rainfall, that can be used as a proxy for the intensity of the radionuclide deposition
(Renaud et al., 2003; Pourcelot et al., 2007), or with the distance from the Sellafield
reprocessing plant. In contrast, O’Donnel et al. (1997) found a significant correlation
between the plutonium content of milk teeth and the distance to the Sellafield plant, with
activities near the plant close to 6 mBq/kg ash. At a distance above 150 miles from Sellafield,
the activity drops to 3.0 mBq/kg ash.
The use of sf-ICP-MS allows us to analyse our set of milk teeth sampled from 1951 to 1995
for
239
Pu content and
239
Pu/
240
Pu ratio (Froidevaux and Haldimann, 2008). In fact, we used
the
239
Pu activity in milk teeth to probe for the potential of plutonium, a highly radiotoxic
nuclide, to cross the placental barrier. We hypothesized that the plutonium inhaled by the
mother will possibly cross the placental barrier, leading to a similar activity profile as
observed for
90
Sr in milk teeth. Surprisingly, results show a very different situation, with