Tribology Lubricants and Lubrication 2012 Part 10 pptx
Bạn đang xem bản rút gọn của tài liệu. Xem và tải ngay bản đầy đủ của tài liệu tại đây (8.52 MB, 25 trang )
Tribology - Lubricants and Lubrication
216
In this respect, Rheological data apparent viscosity and yield stress (Tables 6, 7 & 8), for the
selected greases show improvement and reinforcement in the order G
3D
> G
2C
> G
1G
. This is
attributed to the ability of jojoba meal to enhance the resistance to flow for G
3D
, due to the
action of the jojoba meal containing amino acids which act as chelating compounds,
columbic interactions and hydrogen bonding, with Li-soap Scheme (1& 2). Also, according
to the basic information on the composition of the jojoba meal (Verbiscar, et al., 1978;
Cardeso, et al., 1980; Wisniak, 1994), amino acids, wax ester, fatty materials, polyphenolic
compounds and fatty alcohols in jojoba meal could be acting as natural emulsifiers leading
to increase in the compatibility among the grease ingredients. There is evidence that soap
and additive have significant effects on the rheological behavior.
The flow and viscoelastic properties of a lubricating grease formed from a thickener
composed of lithium hydroxystearate and a high boiling point mineral oil are investigated
as a function of thickener concentration (Luckham & Tadros, 2004).
CH
2
CH
C
O
O
H
O C
O
Li
N
HH
Li
O
C
O
··
C
O
O
H
O Li
C=O
H
2
C
C
O
O
H
O C
O
Li
N
HH
Li
O
C
O
··
Glutamic acid
Glycine
Scheme 1. The role of amino acids as complexing agent with texture of lithium soap grease
3.5.2 Extreme-pressure properties
Extreme pressure additives (EP) improve, in general, the load-carrying ability in most
rolling contact bearing and gears. They react with the surface to form protective films which
prevent metal to metal contact and the consequent scoring or welding of the surfaces. The
EP additives are intended to improve the performance of grease. In this respect, the selected
greases are usually tested in a four ball machine where a rotating ball slides over three
stationary balls using ASTM-D 2596 procedure. The weld load data for the selected greases
G
1G
, G
2C
and G
3D
are 170, 195 and 250 Kg, respectively. These results indicate that the
selected grease containing jojoba oil and jojoba meal G
3D
exhibit remarkable improvement in
extreme pressure properties compared with grease without additives G
1G
and grease G
2C
with jojoba oil alone. This may be attributed to the synergistic effect of the complex
Lubricating Greases Based on Fatty By-Products and Jojoba Constituents
217
combination among Li-soap, amino acids, and polyphenolic compounds scheme (1 &2), in
addition to the role of anion (PO4
3-
, SO4
2-
, Cl
-
and F
-
) and cation (Li
+
, Na
+
, K
+
, Ca
2+
, Mg
2+
,
Al
3+
, Fe
2+
, Cu
2+
, Ba
2+
, Sr
2+
, Mn
2+
, Zn
2+
, Co
2+
and Ni
2+
) in jojoba meal. These chemical
elements are in such a form, that under pressure between metal surfaces they react with the
metal to produce a coating film which will either sustain the load or prevent welding of the
two metals together. This view introduces the key reasons for the improvements of the load-
carrying properties and agrees well with the data previously reported by El-Adly et al
(2004).
On other hand, it has been found that some thickening agents used in grease formulation
inhibit the action of EP additives (Silver & Stanly 1974). The additives most commonly used
as anti-seize and anti-scuffing compounds are graphite and molybdenum disulphide.
3.5.3 Oxidation stability
The oxidation stability of grease (ASTM D-942) is the ability of the lubricant to resist
oxidation. It is also used to evaluate grease stability during its storage. The base oil in grease
will oxidize in the same way as lubricating oil of a similar type. The thickener will also
oxidize but is usually less prone to oxidation than the base oil. So, anti-oxidant additive
must be selected to match the individual grease. Their primary function is to protect the
grease during storage and extend the service life, especially at high temperatures.
0.05
0.1
0.15
0.2
0.25
0.3
0.35
0.4
18 38 58 78 98 118 138
Time,hr
TAN,mg KOH
G3D
G2C
G1G
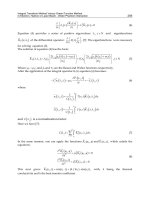
Fig. 3. Effect of deterioration time on Total Acid Number for selected greases
Oxidative deterioration for the selected greases G
1G
, G
2C
and G
3D
are determined by the total
acid number at oxidative times ranging from zero to 120 hours Figures (3). In addition,
pressure drop, in psi. at 96 hour for greases G
1G
, G
2C
and G
3D
are 4.0, 3.0 and 1.5 psi
respectively. These results give an overview on the efficiency of the jojoba meal and jojoba
oil in controlling the oxidation reactions compared with the grease without additive G
1G
.
Jojoba oil in conjunction with jojoba meal additive proves to be successful in controlling and
inhibiting the oxidation of the selected grease G
3D
. Inhibition of oxidation can be
accomplished in two main ways: firstly by removal of peroxy radicals, thus breaking the
oxidation chain, secondly, by obviating or discouraging free radical formation. A suggested
Tribology - Lubricants and Lubrication
218
mechanism for this inhibition is illustrated in the Schemes (2 & 3). The efficiency of jojoba
meal ingredients as antioxidants is here postulated due to the presence of phenolic groups
and hyper conjugated effect. Accordingly, Simmondsin derivatives and polyphenolic
compounds which are considered the main component of jojoba meal include in their
composition electron rich centers, which act as antioxidants by destroying the peroxides
without producing radicals or reactive oxygenated products.
O
OH
H
H
H
C H2
O
C
O
C
HC C
C
CHC
OH
OH
O C
O
OH
OH
OH
H
OH
OH
HO
O
OH
H
H
H
C
O
C
HC C
C
CHC
Ο
OH
O C
O
O
OH
2
OH
H
OH
OH
HO
·
·
RH or
ROH
O
OH
H
H
H
C H2
C
O
C
HC C
C
OH
O C
O
O
OH
OH
H
OH
OH
HO
·
O
·
Stable radical
Rearangment by resonance
Poly phenolic compound
(Tannic acid)
R or RO
·
·
H2C
Scheme 2. The role of Polyphenolic compounds as antioxidant for prepared lithium grease
Lubricating Greases Based on Fatty By-Products and Jojoba Constituents
219
O
O
OR
OR
RO
ROCH
2
CH
OH
OCH
3
OCH
3
CN
CH
OH
OCH
3
OCH
3
CN
O
OR
OR
RO
ROCH
2
O
C
OH
OCH
3
OCH
3
CN
O
OR
OR
RO
ROCH
2
O
O
O
OR
OR
RO
ROCH
2
C
O
OCH
3
OCH
3
Intramolecular
hydrogen bond
1,3 H
O
O
OR
OR
RO
ROCH
2
CH
O
OCH
3
OCH
3
CN
Simmondsin
Intramolecular
hydrogen bond
CN
H
R or ROO
Scheme 3. The role of the Simmondsin as antioxidant for prepared lithium grease
4. Future research
Base oils used to formulate greases are normally petroleum or synthetic oils. Due to growing
environmental awareness and stringent regulations on the petroleum products uses,
research and development in the area of eco-friendly grease is now gaining importance.
Since biodegradable synthetic ester lubricant is higher in cost, vegetable oils are drawing
attention economically as biodegradable alternates for synthetic esters. Looking forward
into the next decade, the need for more advanced science in grease technology is essential.
The design of special components is becoming increasingly complicated and machines are
becoming much smaller and lighter in weight and are required to run faster and withstand
heavier loads. To be able to develop the optimal lubricants for these new conditions, the
mechanism behind grease lubrication must be further studied and understood. There will be
an increased specialization in both products and markets and the survival of individual
lubricants companies will depend on their ability to adapt to changing conditions. Not only
machines but also new materials will affect the development of greases. Biogreases (El-Adly
et al 2010) and nanogrease have better lubricating properties such as, wear protection,
corrosion resistance, friction reduction, heat removal, etc. In this respect, anti-friction, anti-
wear and load-carrying environment friendly additives are prepared from non-traditional
vegetable oils and alkyl phenols of agricultural, forest and wasteland origin (Anand, et al,
2007).
Tribology - Lubricants and Lubrication
220
5. Conclusion
Lubricating grease is an exceptionally complex product incorporating a high degree of
technology in all the related sciences. The by-products, soapstock, bone fat, jojoba meal,
produced from processing crude vegetable oils are valuable compounds for lubricating
greases. Such byproducts have varieties of chemical compounds which show synergistic
effect in enhancing and improving the grease properties. Advantages of these byproducts
include also their low cost and large scale availability. Research in this area plays a great
role in the economic, scientific and environmental fields.
6. References
Anand, O. N; Vijay, k.; Singh, A.K. & Bisht, R.P. (2007). Anti-friction, Anti-Wear and Load-
Carrying Characteristics of Environment Friendly Additive Formulation,
Lubrication Science Vol.19, pp. 159-167.
Barnes, J.(1999). Non-Newtonian Fluid Mech. Vol.81, pp. 133-178.
Boner, C. J. (1976). Modern Lubrication Greases, Scientific Publications (GB) Ltd.
Boner, C.J. (1954). Manufacture and Application of Lubricating Greases, New York Reinhold
Publishing.
Cann, P.M. (1997). Grease Lubrication Films in Rolling Contacts, Eurogrease Nov-Dec 1997,
pp. 6-22.
Cardoso, F. A. & Price, R. L. (1980). Extraction, Charachterization and Functinal Properties
of Jojoba Proteines. In: M. Puebla (Ed.) Proceedinf of Forth International Conference
on Jojoba and its Uses, Hermosillo, pp 305-316.
Cherry, J. P, & Berardi, I.C. (1983). Cottonseed, Handbook of Processing and utilization in
Agriculture, Vol.II, edited by I.A.wolff, CRC press Inc, Boca Raton
Daugherty, P.M.; Sineath, H.H. & Wastler, T.A. (1953). Industrial Raw Material of Plant
Origin, IV.A Survey of Simmondsia Chinensis, Bull.Eng. Exp. Sta., Georgia
Inst.Technol., 15(13).
El-Adly R. A. (1999). Producing Multigrade Lubricating Greases from Animal and Vegetable
Fat By-products. J. Synthetic Lubrication. Vol.16, No.4, pp. 323-332.
El-Adly R. A.; El-Sayed S. M. & Ismail M. M. (2005). Studies on The Synthesis and
Utilization of Some Schiff’s Bases: 1. Schiff’s Bases as Antioxidants for Lubricating
Greases. J. Synthetic Lubrication Vol.22, pp. 211-223.
El-Adly, R.A & Enas A. Ismail. (2009). Study on Rheological Behavior of Lithium
Lubricating Grease Based on Jojoba Derivatives. 11
th
Lubricating Grease Conference,
Mussoorie, India. February 19-21 2009 ( NLGI India Chapter)
El-Adly, R.A.; El-Sayed, S.M. & Moustafa, Y.M. (2004). A Novel Application of Jojoba Meal
as Additives for Sodium Lubricating Grease, The 7
th
International Conference on
Petroleum & the Environment, Egyptian petroleum Research Institute In Cooperation
with EURO-Arab Cooperation Center & International Scientists Association, Cairo,
Egypt. March 27-29 2004.
El-Adly,R.A. (2004). A Comparative Study on the Preparation of Some Lithium Greases
from Virgin and Recycled Oils, Egypt J. Petrol Vol.13, No, 1. pp. 95-103.
El-Adly, R.A.; Enas, A.Ismail. & Modather, F. Houssien. (2010). A Study on Preparation and
Evaluation of Biogreases Based on Jojoba Oil and Its Derivates , The 13
th
International Conference on Petroleum & the Environment, Egyptian petroleum
Lubricating Greases Based on Fatty By-Products and Jojoba Constituents
221
Research Institute In Cooperation with EURO-Arab Cooperation Center &
International Scientists Association, Egypt, March 7-9 2010.
El-Shattory, Y. (1979). Statistical Studies on Physical and Chemical Characteristics,
Phospholipids and Fatty Acid Constitution of Different Processed Cottonseed
Soapstock, Rev. Fr. Corps Gras. Vol, 26, pp.187-190.
Erlich, M. (ed). (1984). NLGI Lubricating Grease Guide, NLGI, Kansas City.
Flaxman,M.T.( 1940). Sulfurized Lubricating Oil, U.S.Patant 2,212,899.
Greene, R.A. & Foster, E. D. (1933). The Liquid Wax of Seeds of Simmondsia Californica, Bot.
Gaz., Vol.94, pp. 826-828.
Heilweil, I.J, (1988). Review of Lubricant Properties of Jojoba Oil and Its Derivatives, Am.Oil
Chem. Soc.Vol, 9, pp 246-260.
Ismail, I.A. (2008). A Study on the Utilization of Jojoba Oil and Meal as Additives for
Lubricating Oils and Greases, Ph.D. Thesis Ain Shams University, Egypt.
Gatto, V. J. & Grina, M.A. (1999). Effect of Base Oil Type, Oxidation Test Conditions and
Phenolic Antioxidant Structure on the Detection and Magnitude of Hindered
Phenol/ Diphenylamine Synergism, Lubrication Engineering, Vol.55, pp.11-20.
Gow, G. (1997). Lubricating Greases, in Chemistry and Technology of Lubricants, 2nd edn,
(Eds R.M. Mortiers, S. T. Orszulik), Blackie Academic and Professional, London, pp
307-319.
Kieke, M. L. (1998). Microwave Assisted Digestion of Zinc, Phosphorus and Molybdenum in
Analysis of Lubricating greases, NLGI Spoksman Vol.62, pp. 29-35.
Kinnear, S. & Kranz, K. (1998). An Economic Evaluation of 12- Hydroxyl Stearic Acid and
Hydrogenated Castor Oil as Raw Materials for Lithium Soap Lubricating Grease,
NLGI Spokesman, Vol.62, No.5 pp.13-19.
Klamann, D. (1984). Lubrications and Related Products: Synthesis, Proprties, Applications,
International Standards, Verlag Chemie, Weinheim.
Kono, Y.; Tomita, K.; Katsura, H. & Ohta, S. (1981). Antioxidant in Jojoba Crude Oil, In:
Puebla, (Editor), Proceedings of the Fourth International Conference on Jojoba,
Hermosillo, pp 239-256.
Kuester, J. L. (1984). Energy Biomass Wastes vol.8,pp 1435
Kuester, J. L.; Fernandez Carmo,T.C. & Heath, G. (1985). Fundam. Thermochem .Biomass
Convers: 875.
Lansdown, A. R. (1982). Lubrication, A Practical Guide to Lubricant Selection, Pergamon
Press, Oxford
Luckham, P. F.& Tadros,Th.F. (2004). Steady Flow and Viscoelastic Properties of Lithium
Grease Containing Various Thickener Concentration, Journal of colloid and Interface
Science, vol.274, pp 285-293
Mang, T. & Dresel, W. (2001). Lubricants and Lubrication, WILEY-VCH, ISBN 3-527-295-36-
4, New York
Michael, K. Dowd. (1996). Compositional Characterization of Cottonseed Soapstock,
J.Am.Oil.Chem.Soc, Vol 73, No.1o, pp 1287-1295.
Miwa, T.K, (1980). Chemical Structure and Propreties of Jojoba Oil, In: M. Puebla (Editor),
Proceeding of the Fourth International Conference on Jojoba, Hermosillo, pp pp 227-
235.
Miwa, T.K. & Hagemann, J.W. (1978). Physical and Chemical Properties of Jojoba Liquid
and Solid Waxes, In: Proceedings of
the Second International Conference on jojoba and
Iits Uses,
Bnsenada, pp 245-252, 1976.
Tribology - Lubricants and Lubrication
222
Miwa, T.K. & Rothfus, J.A. (1978). In-depth Comparison of Sulfurized Jojoba and Sperm
Whale Oils a Extreme Pressure Extreme Temperature Lubricants, In: D.M.
Yermanos (Editor), Proceeding of the Third International Conference on Jojoba and Its
Uses, Riverside, Calif., pp 243-267
Miwa, T.K. (1971). Jojoba Oil wax Esters and Derived Fatty Acids and Alcohols, Gas
Chromatographic Analysis , J.Am.Oil Chem., Vol.48, pp 299-264
Miwa, T.K. (1973). Chemical Aspects of Jojoba Oil, a Unique Liquid Wax from Desert Shrub
Simmondsia californica, Cosmet. Perfum, Vol.88, pp 39-41
Peeler, R.F.& Hartman, L.M,(1972). Evaluation of Sulfurized Sperm Oil Replacements, NLGI
Spokesman, vol.37, No.17
Pohlen, M. J. (1998). DSC- A Valuable Tool for the Grease Laboratory, NLGI Spokesman,
Vol.62, pp 11-16.
Robison, P. D.; Salmon, S.G.; Siber, J. R. & Williams, M.C. (1993). Elemintal Analysis of
Greases, NLGI Spokesman, Vol.56, pp 157-160.
Schultze, G. R. (1962). Wesen and Eufbau Derschmierfette in Zerbe, C. Mineralole and
verwandte Produkte, 2
nd
edn, Springer Berlin, pp .405-432.
Shirahama.(1985). The Effects of Temperature and Additive Interaction on Valve Train
Wear, Proc. JSLE.Int. Trib.Conf. Tokyo,Japan, pp 331-336 8-10 July
Silver B.H.& Stanley R.I. (1974). Effect of The Thickener on The Efficiency of Load Carrying
Additives in Greases, Tribology International, Vol.7, pp 113-118.
Sinitsyn, V. V. (1974). The Choice and Application of Plastic Greases, Khimiya, Moscow.
Spencer, G.F.; Plattner, R.D.& Miwa, T. K, (1977). Jojoba Oil Analysis by High Pressure
Liquid Chromatography/Mass Spectrometry, J. Am. Oil Chem. Soc., vol.54, pp 187-
189.
Verbiscer,A. J.; Banigen,T. F. ;Weper, C. W. ; Reid, B. L.; Tlei, J. E.& Nelson, E. A. (1978).
Detoxification and Analysis of Jojoba Meal. In: D. M. Yermoanos (Ed.) Proceeding
of the Third International Conference on Jojoba and Its Uses, Riverside, Calif. pp 185-
197.
Vinogradov, G.V. (1989). Rheological and Thermophysical Properties of Grease, Gordon and
Breach Science Publications, London.
Wells, F. B. (1948). Process of Making Sulfurized Jojoba oil U.S. Patent 2,450,403.
Wills, J. G. (1985). Jojoba, New Crop for Arid Lands, New Material for Industry, National
Research Council, National Academy Press, Washington, No,6, pp,130-150.
Wisniak, J. (1987). The Chemistry and Technology of Jojoba Oil, American Oil Chemists
Society, Champaign, Illinois.
Wisniak, J. (1994). Potential Uses of Jojoba Oil and Meal-a Review, Industrial Crops and
Products Vol.3 pp, 43-68.
Wassermann, G. From Heraklit to Blair,W. S. (1991). Rheology, Vol.91 pp 32-38.
9
Characterization of Lubricant on
Ophthalmic Lenses
Nobuyuki Tadokoro
HOYA corporation/VC Company
Japan
1. Introduction
When people started wearing eye-glasses from the 13th century until the middle of 20th
century, the glass was the only material used for ophthalmic lenses. However, plastic lenses
were rapidly developed and began to be widely used when PPG Industries, Inc. developed
CR-39
®
in 1940; CR-39
®
, i.e., allyl diglycol carbonate (ADC), is a thermosetting resin that can
be used as a lens material with a refractive index of 1.5. The features of this material are as
follows: (1) it is a lightweight material (its specific gravity is half of that of glass), (2) it has
strong impact resistance (i.e., it is shatter proof, which guarantees high safety), (3) it is
stainable (i.e., has high fashionability), and (4) it can be used in a variety of frames (i.e., it
has high fashionability or high workability). The quest for thinner lenses led to an increase
in the refractive index of lenses, and current lenses have a super-high refractive index of 1.74
or 1.76.
The biggest drawback of plastic lenses was that they could be “easily scratched,” but they
were improved sufficiently for practical use, by using a hard coating (HC), i.e., an overcoat
formed on the plastic substrate. Subsequently, anti-reflection (AR) coating films were added
to increase the clearness of the lens, to reduce the reflection from the ophthalmic lens as
viewed by another person, and even to enhance measures for preventing scratches. In recent
years, further value-adds have been made to plastic lenses, with the use of lubricants in the
top layers for increasing durability, preventing contamination due to scratches on spectacle
lenses, and facilitating “easy removal” of dirt.
Research on lubricants used for the improvement of tribology characteristics has progressed
rapidly; it has been supported from the end of the 1980s by the development of surface
analysis methods (Kimachi et al., 1987; Mate et al., 1989; Novotny et al., 1989; Newman et al.,
1990; Mate et al., 1991; Toney et al., 1991; Novotny et al., 1994; Sakane et al., 1999; Tani, 1999;
Tadokoro et al., 2001; Tadokoro et al., 2003) and by the technology for high-density magnetic
disc recording used in personal computers. The main lubricant selected was
perfluoropolyether (PFPE), because it possesses thermal stability, oxidation stability, low
vapor pressure, low surface tension, and good boundary lubricity. It was effective in
reducing the frictional wear of the surfaces of the magnetic disc and magnetic head, and
thus, hundreds of thousands of stable data read-and-write operations could be conducted.
The main parameters that determine lubricant properties are the structure, thickness, and
state of the lubricant, and various methods were used to investigate them.
Tribology - Lubricants and Lubrication
224
On the other hand, the purpose of using a lubricant for ophthalmic lenses is to improve a
scratch resistance, to prevent contamination, and to facilitate “easy removal” of dirt; the
tribology characteristics of such a lubricant are similar to those of the lubricant used on
magnetic discs, and has possibilities of application. There are two differences between
lubricants used for ophthalmic lenses and those used for magnetic discs: (1) the film
thickness of the lubricant used for magnetic discs does not need to be reduced, because the
recording density achieved by using the lubricant for the magnetic disc increases
exponentially when the gap between the magnetic disc surface and magnetic head is
reduced as much as possible (to approximately 1 nm), and (2) the lubricant for ophthalmic
lenses needs to be solid, but magnetic discs can be solid or liquid if stiction, in which a
magnetic head sticks to the surface of a magnetic disc does not occur. However, in the case
of ophthalmic lenses, dirt, dust, and fingerprints frequently block the view of the user, and
the user cleans the lenses with water or rubs them with a soft cloth or paper; therefore,
liquid lubricants can cause adhesion problems and does not last for a long time. In reality,
conference presentations and papers are limited to information provided by the authors
(Tadokoro et al, 2009; Tadokoro et al, 2010; Tadokoro et al, 2011). This chapter discusses
tribology, with a focus on the characterization of lubricants, and presents analysis and
evaluation results based on the film thickness, structure, distribution, and abrasion
resistance of lubricants reported by the authors.
2. Scratches and dirt
Figure 1 shows optical microscopic pictures of ophthalmic lens returned by a consumer who
complained about the quality. The different colors in the picture demonstrate the peeling of
the AR coating films along the scratch, and thus, the small scratches become visible. Details
on how and when the lenses were used are unknown, but it must be understood that
scratches actually occur and this problem must be taken into account; this picture shows the
importance of surface reforming based on the use of lubricants. While scratch-free lenses
cannot be made only by modifying lubricants, the lubricant is one of the most important
factors that affect the formation of scratches. Figure 2 shows the results of an abrasion test
conducted by scrubbing a lens 20 times with 20 kg steel wool for different lubricants. The
results show that the formation of scratches can be controlled by changing the structure or
the distribution state of the lubricant. Finally as an example of the comparison of dirt
adhesion, figure 3 shows the adhesion of cedar pollen on the lens. In Japan, hay fever, a
seasonal allergy caused by cedar pollen, is very common (30% of the citizens have this
Fig. 1. Damaged ophthalmic lens and scratches
Characterization of Lubricant on Ophthalmic Lenses
225
allergy). The results in figure 3 show that changing the surface condition reduces the
amount of pollen adhered to the ophthalmic lens brought indoors. As in the example of
scratches, the results show the possibility that the surface condition can be controlled to
change the amount of dirt that adheres to the lenses.
Fig. 2. Scratch test results for 3types lubricants: the lens was scrubbed 20 times with 2 kg
steel wool
Fig. 3. Comparison between surface condition and cedar pollen adheres to the lens
2.1 Experimental
2.1.1 Sample preparation
Commercial ophthalmic lenses of allyl diglycole carbonate (ADC, CR-39
®
) were used in this
study. In addition, the detailed estimations of lubricants were carried out directly on silicon
wafer in order to avoid the influence of surface curvature, roughness, or amorphous states
A
B
Tribology - Lubricants and Lubrication
226
of actual ophthalmic lenses. The structures of the ophthalmic lenses were as follows: a
sol-gel based underlayer on the plastic lens substrate was deposited by dip coating or
spin coating methods. The HC material was made using a silica sol and
3-glycidoxypropyltrimethoxysilane. The thickness of HC was approximately 3500 nm. AR
coating layers, composed of a sandwich structure between low-index material (SiO
2
) and
high-index material (Ta
2
O
5
), were deposited by vacuum deposition methods after the HC
underlayer was cleaned by ultrasonic washing with detergent and de-ionized water. The
total film thickness was approximately 620nm. The PFPE lubricants, which were also
commercial products, were deposited over the AR coating layers by the vacuum deposition
methods. The main structure of lubricants A, B, C, G, and H has (-CF
2
-CF
2
-O-)m-(CF
2
-O-)n,
the main structure of lubricants D and F has (-CF (CF
3
)-CF
2
-O-)m’, the main structure of
lubricant E has (-CF
2
-CF
2
- CF
2
-O-)m’’.
2.1.2 Analysis and evaluation methods
The surface morphology and the lubricant film distribution were examined by atomic force
microscopy (AFM; Asylum Research, Molecule Force Microscope System MFP-3D). The film
thickness, morphology of the cross section, and elemental analysis were used by
transmission electron microscopy (TEM-EDS; JEOL, JEM-200FX-2). For the TEM observation, a
Cr protective layer was deposited onto the lubricants layer in order to identify a top surface
of the lubricants films. The film thickness and the coverage ratio of the lubricant were
measured by X-ray photoelectron spectroscopy (XPS; Physical Electronics, PHI ESCA5400MC).
Structure analysis was conducted by time-of-flight secondary ion mass spectrometry (TOF-
SIMS; ULVAC-PHI, PHI TRIFT-3 or PHI TRIFT-4) and XPS. The wear properties of
lubricants were evaluated by contact angle measurement (Kyowa Interface Science Co.,Ltd.;
Contact angle meter, model CA-D) and by the use of an abrasion tester (Shinto Scientific
Co., Ltd.; Heidon Tribogear, Type 30S). The abrasion test was rubbed in the Dusper K3(Ozu
corp.) to have wrapped around the eraser under the condition of 2 kg weight and 600
strokes.
2.2 Results and discussion
2.2.1 Cross-sectional structure, film thickness and coverage of lubricants
Figure 4 shows an example of TEM photograph of lubricant B on a silicon wafer. Figure 5
and figure 6 show an EDS analysis area of TEM photograph and an EDS spectrum of
lubricant B. Table 1 summarized the lubricant film thickness and coverage ratio by XPS and
TEM. The thickness of the lubricant layer was estimated to be 2.6 nm. And also, we
recognized fluorine element in this area by TEM-EDS. These data indicate that both the film
thicknesses and the coverage ratios were almost identical across all films. Here, we directly
measured the film thickness by TEM. Despite the fact that the lubricant layer was comprised
of organic materials, the existence of the lubricant film was directly observed and the film
thickness was successfully measured by TEM. Generally, the issue of TEM measurement is
sample damage by electron beam. For the reason of successful measurement by TEM, it
seems that the lubricant damage of ophthalmic lens is stronger than that of the magnetic
disk for electron beam.
It is well-known that the film thickness is proportional to a logarithmic function of the
intensity ratio of photoelectrons. According to Seah and Dench (1979), they reported the
escape depth of electrons of organic materials with electron kinetic energy by the following
Characterization of Lubricant on Ophthalmic Lenses
227
equation; they provide a set of relations for different classes of material over the energy
range 1 eV – 6keV (Briggs & Seah, 1990).
λ
m
= 49/E
k
2
+ 0.11• E
k
0.5
(1)
λ
lub F
= λ
m
/ρ (2)
where λ
lub F
is the escape depth of F
1s
photoelectron of lubricants, λ
m
is the escape depth of
monolayers for organic materials, E
k
is electron kinetic energy, and ρ is the density of material.
Fig. 4. TEM cross-sectional photograph (glue/Cr layer/lubricant/Si wafer) of lubricant B
Fig. 5. TEM photograph of lubricant B on a silicon wafer. (Blue area shows the EDS analysis
area)
Tribology - Lubricants and Lubrication
228
270
240
210
180
150
120
90
60
30
0
Counts
0.00 0.80 1.60 2.40 3.20 4.00 4.80 5.60
keV
CKa
OKa
CrLa
FKa
AlKa
SiKa
CrKa
Fig. 6. TEM-EDS spectrum for lubricant B on a silicon wafer
Lub. film thickness
(nm)
Lub. film coverage
by XPS (%)
Lub. film coverage
by TEM (%)
Sample A 1.5-1.7 98 over 100
Sample B 2.3-2.7 98 over 100
Sample C 2.3-2.7 98 over 100
Sample D 2.1-2.5 98 over
Sample E 1.7-2.2 98 over
Table 1. Film thickness and coverage ratio of lubricant by XPS and TEM
The lubricants film thickness of XPS was calculated by the following equation (3). Table-2
summarizes the parameters used. We experimentally calculated the A factor by using
equation (3) from TEM’s film thickness and the intensity ration of F
1s
and Si
2p
photoelectron
(the experimental A factor is 0.116).
T = λ
lub F
· sinθ· ln [ A· (I
lub F
/ I
Si
) + 1 ] (3)
where T is the film thickness of lubricants , θ is the detection angle of XPS measurement, I
lub
F
is the intensity of F
1s
photoelectrons, I
Si
is the intensity of Si
2p
photoelectrons, A is the
correction factor (calculated value: 0.116, i.e., lubricants films thickness by TEM).
According to Kimachi et al. (1987), they have derived an expression for the coverage ratio of
lubricants on magnetic disks using an island model. In the present study, we propose a
Characterization of Lubricant on Ophthalmic Lenses
229
modified equation (4) for the coverage of our lubricants using the F
1s
and the Si
2p
photoelectrons.
A· (I
lub F
/I
Si
) = {r· [1-exp(-T/(λ
lub F
· sinθ))]}/{(1-r)+r· exp(-T/(λ
Si
· sinθ))} (4)
where r is the coverage ratio from 0 to 1.
Figure 7 shows an example of the relationship between the logarithmic function of the
intensity ratio of photoelectron and the coverage ratio. Table 1 already summarized the
lubricant film thickness and coverage ratio by XPS and TEM. The coverage ratio of
lubricants by XPS is estimated to be over 98%. However, the coverage ratio of TEM seems to
be covered a fully 100 % on Si wafer. In case of an actual XPS measurement, a coverage ratio
of 100% is unlikely to occur due to the influence of surface roughness, the density of actual
lubricants films, and the photoelectron signal of Si
2p
. Therefore, it seems that the lubricant
layer completely covers on the Si wafer when the coverage ratio is approximately 100%. By
using this XPS technique, we can easily monitor the lubricant thickness and coverage ratio
on a production line for quality control.
B.E (eV) λ
lub F
(nm) ρ (kg/m
3
)
Lub. F
1s
689 1.45 1.8x10
3
Table 2. The escape depth and parameters used
Fig. 7. Coverage calculation results of sample B by XPS measurement
2.2.2 The distribution state of lubricants
Figure 8 illustrates the lubricant distribution of samples A, B, and C by TOF-SIMS analysis.
The image was obtained by detecting the positive ion fragments of C+, C2F4+, and Si+. The
ion signal intensity is displayed on a scale of relative brightness; bright areas indicate high
intensity of each type of fragment ion. Figure 9 shows the comparison of lubricants fragment
Tribology - Lubricants and Lubrication
230
ion for samples A, B and C. From fugure-9, we recognized that these samples have same
main structure of (-CF
2
-CF
2
-O-)m-(CF
2
-O-)n. The lubricant distribution determined by this
analysis was consistent with the actual lubricant distribution. The behavior of the lubricant
distribution obtained is attributable to suggest chemical structure and mechanical property
of lubricant. Therefore, in terms of elemental fragment ions, the distribution of the lubricant
appears to be homogenous at the 10μm scale from figure 8.
Sample-A Sample-B Sample-C
C+ C+ C+
C2F4+ C2F4+ C2F4+
Si+ Si+ Si+
1 μ m
Fig. 8. TOF-SIMS image (C+, C2F4+, and Si+ fragment ions) for each sample
Figure 10 illustrates the lubricant distribution of samples A, B, and C by AFM topographic
image and friction force image at the 10 μm scale. Figure 11 shows a frequency analysis of
phase separation for sample A and sample B. A red histogram shows the whole area, a blue
area shows the phase separation A of lubricants, and a green area shows phase separation B
of lubricants. Area distribution of sample 2 has approximately two times larger than that of
sample 1. Figure 12 shows the lubricant image of sample B by using phase image and force
modulation image. The components between the in-phase (input-i: elasticity) and the quadrature
(input-q: viscosity) divided phase image are shown in figure 13. From the TOF-SIMS
Characterization of Lubricant on Ophthalmic Lenses
231
C
CF
CFO
CF2
CF3
C2F3O
C2F4
109
C2F4O
C2F5
C3F5O2
C3F7
C3F7O
C4F7O2
C4F8O
225
300
Relative intensity (normarized CF ions)
5
4
3
2
1
0
Sample A
Sample B
Sample C
Fragment ions or mass number
Fig. 9. The comparison of lubricants fragment ion for sample A, B and C
fragment image in figure 8, we recognized the homogeneity of lubricant distribution for
sample A, sample B and sample C. However, we found that the uniformity or heterogeneity
of an image depended upon the sample and the scale, except for topographic images by
AFM measurement added some functionality from figures 10, 12, and 13. Here, in the case
of sample B, the friction images agree with the phase images and the phase images agree to
the force modulation images. Thus, the friction force image reveals the distribution of
friction behavior on the surface. Also, the force modulation image indicates the distribution
of hardness; the darker areas correspond to softer areas. Thus, the phase image suggests
friction or hardness behavior because it assumes the same image form as the friction force
and force modulation.
By friction force microscopy (FFM), the twisting angle is proportional to the tip height of the
cantilever in the case of the same cantilever shape and the same material (Matsuyama, 1997).
θ
o
= μ· F
L
· (h
t
+ t/2) · L/(r· G· w· t
3
) (5)
where θ
o
: twisting angle, L: length of cantilever, r: correction factor (calculated value 0.3 to
~0.4), G: shear modulus, w: width of cantilever, t: thickness of cantilever, μ: friction
coefficient, F
L
: load force, h
t
: height of cantilever.
In previous work (Tadokoro et al., 2001), we observed the morphology of lubricants on the
magnetic disk surface by FFM. The images of lubricants obtained by a high-response
cantilever of tip height 8.4 μm were clearer than those by a standard cantilever of tip height
3 μm in the same load force. The sensitivity of the high-response cantilever was about 2 to 3
times greater than that of the standard cantilever when compared in the same sample area.
These observations seemed to experimentally support the theoretical predictions, and the
effects of load force for the standard cantilever agree with the theoretical equation. However,
FFM has two disadvantages. If the area is too small (i.e., <1 μm) and is low-friction
material, the friction force signal is drastically reduced. Moreover, there might be
Tribology - Lubricants and Lubrication
232
damage to the lens surface because the friction force image is made by contact. On the other
hand, the disadvantage of force modulation methods is that the tip can change shape and is
a possible source of contamination because it is always pushed into the sample
(indentation). Therefore, we believe that it is more convenient to use phase images than
friction force images or force modulation images for determining the island structures of
shapes with similar surface morphologies.
Fig. 10. Topographic image (left side), FFM image (right side; bright area indicates higher
friction, darker area indicates lower friction); upper image is sample A, middle image is
sample B, lower image is sample C
Characterization of Lubricant on Ophthalmic Lenses
233
Fig. 11. Frequency analysis of phase separation by FFM (top distribution: sample A, bottom
distribution: sample B), it shows red histogram for whole area, blue area for lubricant phase
separation A, and green area for lubricant phase separation B
Fig. 12. Phase image (left side), force modulation image (right side; bright area indicates
harder area, darker area indicates softer area) of sample B
Fig. 13. In-phase image (input-i: left side) and quadrature image (input-q: right side) of
sample B divided by phase image
Tribology - Lubricants and Lubrication
234
According to Cleveland et al. (1998), if the amplitude of the cantilever is held constant, the
sine of the phase angle of the driven vibration is then proportional to changes in the tip-
sample energy dissipation. This means that images of the cantilever phase in tapping-
mode AFM are closely related to maps of dissipation. Our phase images suggest that the
bright area corresponds to a higher phase because a phase image is taken in repulsive
mode. The bright area is more energy-dissipated than the dark area, which means the
bright area is softer or more adhesive. Because the phase image was divided by the
components of the in-phase (input-i) and the quadrature (input-q), the relation of the in-
phase (input-i) and the quadrature (input-q) is converse. It seems that an in-phase image
(input-i) has the same tendency as the force modulation image: its darker area corresponds
to a softer area. In general, the relation between an in-phase image (input-i) and a
quadrature image (input-q) is the relation between elasticity and viscosity. Our observations
seem to experimentally support this relation. Figure 13 demonstrates that the bright area of
the in-phase image has lower energy dissipation than the darker area, which means the
bright area is harder or less adhesive. On the other hand, the darker area in figure 12 (the
force modulation image) corresponds to a softer area. If ophthalmic lens surface is sticky, a
lot of contaminants can easily attach to the lens surface. Fortunately, the lubricant material is
fluorocarbon, which has low surface energy. Thus, the contaminant is easily removed from
the lens surface wiping the surface with a cloth. From these results, in the case of sample B,
it appears that these island structures are mixtures of soft regions and hard regions at the 10
μm scale.
Figure 14 illustrates the lubricant distribution of sample D by AFM topographic image and
phase image at the 10 μm scale. Figure 15 shows the lubricant image of sample C by
topographic image, phase image, in-phase image (input-i), and quadrature image (input-q)
at the 1 μm scale. Figure 16 shows the lubricant image of sample C by topographic image,
phase image, in-phase image (input-i), and quadrature image (input-q) at the 500 nm scale.
The topographic image, phase image, in-phase (input-i), and quadrature image (input-q) of
sample D at the 1 μm scale are shown in figure 17. Finally, the topographic image, phase
image, in-phase (input-i), and quadrature image (input-q) of sample E at the 1 μm scale are
shown in figure 18.
In the case of samples C, D, and E at the 10 μm scale, island structures cannot be observed
by phase image, although it seems that the lubricant is homogeneous in these areas.
However, samples C, D, and E reveal some island structures at smaller scales (i.e., 500 nm
scale and 1 μm scale). We earlier discussed the relation between friction force image, force
modulation image, and phase image. Nevertheless, the signal mark depends upon the
measurement mode; these images reveal island structures in cases of similar morphology.
In the case of sample C, it seems that the grain is too small and some clusters gather with
different dissipation energies. The topographic image of sample D reveals unevenness of
grain, but the phase image clearly shows the grain boundary. This suggests that the grain
boundary in sample D is accumulated lubricants rather than grain. On the other hand,
sample E has grain but the grain boundary in the phase image is not clearly apparent. It
seems that the lubricant in the grain boundary is in accord with the lubricant on the grain,
and the lubricant of sample E is more homogenous than that of sample C or D.
In some ophthalmic lenses, island structures can be observed on the lens surface at the 10
μm scale, whereas in others it is necessary to use the 1 μm or 500 nm scale. From these
lubricant images we have determined that the morphologies of the lubricants of commercial
Characterization of Lubricant on Ophthalmic Lenses
235
ophthalmic lenses vary widely and thus perform differently in terms of wear property and
dirt protection. Therefore, the methods described here are useful and suitable for investigation
of lubricants on ophthalmic lens surfaces.
Fig. 14. Topographic image (left side), phase image (right side) of sample D
Fig. 15. Topographic image (upper left), phase image (upper right), input-i image (lower
left,) and input-q image (lower right) of sample C at the 1 μm scale
Tribology - Lubricants and Lubrication
236
Fig. 16. Topographic image (upper left), phase image (upper right), input-i image (lower
left), and input-q image (lower right) of sample C at the 500 nm scale
Fig. 17. Topographic image (upper left), phase image (upper right), input-i image (lower
left), and input-q image (lower right) of sample D at the 1 μm scale
Characterization of Lubricant on Ophthalmic Lenses
237
Fig. 18. Topographic image (upper left), phase image (upper right), input-i image (lower
left), and input-q image (lower right) of sample E at the 1 μm scale
2.2.3 X-ray damage of lubricants and chimerical structures
Figure 19 shows the X-ray damage ratio of F
1s
spectra for sample F, G, and H as a function of
X-ray exposure time under the condition of X-ray power 300W and Mg-Kα source by XPS.
Figures 20 - 22 show the changing chemical structure of C
1s
for samples F-G as a function of
exposure time (initial structure shown for reference, structure after 30 min, and structure
after 60 min), as determined by XPS. Figure 23 shows the initial structure and of the mass
spectra of positive fragment ions, as obtained by TOF-SIMS (upper spectrum: sample F,
middle spectrum: sample G, lower spectrum: sample H). Figure 24 shows the mass spectra
of positive fragment ions after 60 min X-ray exposure by XPS (upper spectrum: sample F,
middle spectrum: sample G, lower spectrum: sample H). Figure 25 shows the mass spectra
of negative fragment ions for sample F, as obtained by TOF-SIMS (upper spectrum: initial,
lower spectrum: after 60 min, obtained by XPS). Table 3 summarized the film thickness and
coverage ratio of lubricant before and after XPS damage.
From figure 19, we found that the X-ray damage in the case of sample F is greater than that
in the case of sample G and sample H. In the case of sample G and sample H, the lubricant
component of fluorine remained on the surface; fluorine was kept on approximately 80% on
the surface after 60 min of exposure to X-rays. On the other hand, the lubricant component
of sample F decreased by approximately 40% after exposure for 60 min.
On the basis of the initial structures shown in figure 23 and figure 25, it is concluded that the
main structure of sample F has a side chain structure (-CF (CF
3
)-CF
2
-O-)m’, similar to that in
Fombline Y or Krytox. This periodic relation of 166 amu (C
3
F
6
O) continues up till mass
numbers of approximately 5000 amu. In the case of magnetic disks, the high molecular
structure of the lubricants was realized and maintained by dip coating or spin coating.
Tribology - Lubricants and Lubrication
238
0
0.2
0.4
0.6
0.8
1
0 15304560
X-Ray exposure time (min)
Relative F1s counts ratio
A
B
C
Fig. 19. Relationship between F1s intensity and X-Ray exposure time during XPS
However, the ophthalmic lens of lubricants was deposited by lamp heating methods into
vacuum. Nevertheless, some main structure of lubricants was contained high-polymeric
structures. On the other hand, the main structures of sample G and sample H has a straight
chain structure without the side chain structures (-CF
2
-CF
2
-O-)m-(CF
2
-O-)n, similar to the
main structure of Fombline Z. From figure 20, 24 and 25, we found that the main chemical
structure of lubricants for sample F is decreasing and destroying as a function of exposure
time by XPS.
Fig. 20. Changing chemical structure of C
1s
spectrum for sample F as a function of X-ray
exposure time by XPS
These observations suggest that the straight chain structure of (-CF
2
-CF
2
-O-)m-(CF
2
-O-)n is
more robust to X-ray damage during XPS than the side chain structure (-CF (CF
3
)-CF
2
-O-)m’.
We attribute this difference in the strength of the structures to the presence or absence of the
chemical structure of the side chain. TEM or XPS measurement reveals that the film thickness
Characterization of Lubricant on Ophthalmic Lenses
239
of the lubricants is 2–3 nm. According to Tani (1999), he found double steps on the lubricant
film with 2.9 nm thickness that was almost completely cover the surface by the mean
molecular radius of gyration with coil of lubricant molecular. Therefore, it seems that the 2-3
coils of lubricant molecular have been stacked on the surface of the ophthalmic lens.
In the case of sample F, the molecular interaction in the side chain structure of CF
3
is weaker
than that in the straight chain structure of CF
2
because in CF
3
, three-dimensional structures
overlap and this leads to repulsion between fluorine atoms. Therefore, the damage due to
exposure to X-rays during XPS in the case of sample F is more than that in the case of sample
G or that in the case of sample H. It is predicted that the trend observed in the adhesion
properties of lubricants will be the same as that observed in the case of these damages.
Fig. 21. Changing chemical structure of C
1s
spectrum for sample G as a function of X-ray
exposure time by XPS
Fig. 22. Changing chemical structure of C
1s
spectrum for sample H as a function of X-ray
exposure time
Tribology - Lubricants and Lubrication
240
Fig. 23. Initial structure of the mass spectra of positive fragment ions, as determined by TOF-
SIMS (upper spectrum: sample F, middle spectrum: sample G, lower spectrum: sample H)