REPORT NO. 2010-102 FEBRUARY 2010 FLORIDA INTERNATIONAL UNIVERSITY Financial Audit_part1 pptx
Bạn đang xem bản rút gọn của tài liệu. Xem và tải ngay bản đầy đủ của tài liệu tại đây (250.79 KB, 7 trang )
REPORT NO. 2010-102
F
EBRUARY 2010
FLORIDA INTERNATIONAL UNIVERSITY
Financial Audit
For the Fiscal Year Ended
June 30, 2009
This is trial version
www.adultpdf.com
BOARD OF TRUSTEES AND PRESIDENT
Members of the Board of Trustees and President who served during the 2008-09 fiscal year are listed below:
David R. Parker, Chair
A
lbert E. Dotson, Sr., Vice Chair
Cesar L. Alvarez
Jorge L. Arrizurieta
Betsy S. Atkins
T
homas Breslin from 8-01-08 (1)
Patricia Frost
Bruce Hauptli to 7-31-08 (1)
S. Lawrence Kahn, III, from 6-18-09 (3)
R. Kirk Landon
Miriam Lopez
A
lbert Maury
A
rthur "AJ" Meyer to 4-30-09 (2)
Claudia Puig
A
nthony Rionda from 5-01-09 (2)
Rosa Sugrañes to 3-31-09 (3)
Notes: (1) Faculty senate chair.
(2) Student body president.
(3) Position remained vacant from
A
pril 1, 2009, through June 17, 2009.
Dr. Modesto A. Maidique, President
T
he Auditor General conducts audits of governmental entities to provide the Legislature, Florida’s citizens, public entity
management, and other stakeholders unbiased, timely, and relevant information for use in promoting government
accountability and stewardship and improving government operations.
The audit team leader was Marilyn E. Tolley, CPA, and the audit was supervised by Ramon A. Gonzalez, CPA. Please
address inquiries regarding this report to James R. Stultz, CPA, Audit Manager, by e-mail at
or by
telephone at (850) 922-2263.
This report and other reports prepared by the Auditor General can be obtained on our Web site at
www.myflorida.com/audgen
; by telephone at (850) 487-9024; or by mail at G74 Claude Pepper Building, 111 West Madison
Street, Tallahassee, Florida 32399-1450.
This is trial version
www.adultpdf.com
FEBRUARY 2010 REPORT NO. 2010-102
FLORIDA INTERNATIONAL UNIVERSITY
TABLE OF CONTENTS
PAGE
NO.
EXECUTIVE SUMMARY i
INDEPENDENT AUDITOR’S REPORT ON FINANCIAL STATEMENTS 1
MANAGEMENT’S DISCUSSION AND ANALYSIS 3
BASIC FINANCIAL STATEMENTS
Statement of Net Assets 11
Statement of Revenues, Expenses, and Changes in Net Assets 13
Statement of Cash Flows 14
Notes to Financial Statements 16
OTHER REQUIRED SUPPLEMENTARY INFORMATION
Schedule of Funding Progress – Postemployment Healthcare Benefits Plan 49
INDEPENDENT AUDITOR’S REPORT ON INTERNAL CONTROL OVER
FINANCIAL REPORTING AND ON COMPLIANCE AND OTHER MATTERS
BASED ON AN AUDIT OF THE FINANCIAL STATEMENTS PERFORMED
IN ACCORDANCE WITH
GOVERNMENT AUDITING STANDARDS
50
Internal Control Over Financial Reporting 50
Compliance and Other Matters 51
This is trial version
www.adultpdf.com
FEBRUARY 2010 REPORT NO. 2010-102
2
In our opinion, based on our audit and the reports of the other auditors, the financial statements referred to above
present fairly, in all material respects, the respective financial position of Florida International University and of its
aggregate discretely presented component units as of June 30, 2009, and the respective changes in financial position
and cash flows thereof for the fiscal year then ended, in conformity with accounting principles generally accepted in
the United States of America.
In accordance with Government Auditing Standards, we have also issued our report on our consideration of Florida
International University’s internal control over financial reporting and on our tests of its compliance with certain
provisions of laws, rules, regulations, contracts, and grant agreements and other matters included under the heading
INDEPENDENT AUDITOR’S REPORT ON INTERNAL CONTROL OVER FINANCIAL
REPORTING AND ON COMPLIANCE AND OTHER MATTERS BASED ON AN AUDIT OF THE
FINANCIAL STATEMENTS PERFORMED IN ACCORDANCE WITH
GOVERNMENT AUDITING
STANDARDS
. The purpose of that report is to describe the scope of our testing of internal control over financial
reporting and compliance and results of that testing, and not to provide an opinion on the internal control over
financial reporting or on compliance. That report is an integral part of an audit performed in accordance with
Government Auditing Standards and should be considered in assessing the results of our audit.
The MANAGEMENT’S DISCUSSION AND ANALYSIS on pages 3 through 10, and OTHER REQUIRED
SUPPLEMENTARY INFORMATION on page 49, are not a required part of the basic financial statements, but
are supplementary information required by accounting principles generally accepted in the United States of America.
We have applied certain limited procedures, which consisted principally of inquiries of management regarding the
methods of measurement and presentation of the required supplementary information. However, we did not audit
the information and express no opinion on it.
Respectfully submitted,
David W. Martin, CPA
February 22, 2010
This is trial version
www.adultpdf.com
FEBRUARY 2010 REPORT NO. 2010-102
4
¾
FIU Athletics Finance Corporation
The purpose of the FIU Athletics Finance Corporation includes the support of the University in matters
pertaining to the financing of the FIU football stadium and, subsequently, the managing and operating of
the facility.
Information regarding these component units, including summaries of their separately issued financial statements, is
presented in the notes to financial statements. This MD&A focuses on the University, excluding the component
units.
T
HE STATEMENT OF NET ASSETS
The statement of net assets reflects the assets and liabilities of the University, using the accrual basis of accounting,
and presents the financial position of the University at a specified time. The difference between total assets and total
liabilities, net assets, is one indicator of the University’s current financial condition. The changes in net assets that
occur over time indicate improvement or deterioration in the University’s financial condition.
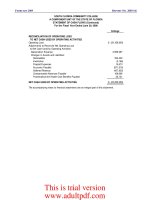
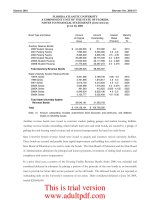
The following summarizes the University’s assets, liabilities, and net assets at June 30:
Condensed Statement of Net Assets at June 30
(In Millions)
2009 2008
Asse ts
Current Assets 403.5$ 398.0$
Capital Assets, Net 657.0 606.2
Other Noncurrent Assets 14.6 19.0
Total Assets
1,075.1 1,023.2
Liabilities
Current Liabilities 219.4 213.2
Noncurrent Liabilities 154.3 153.3
Total Liabilities
373.7 366.5
Net Assets
Invested in Capital Assets,
Net of Related Debt 534.6 476.1
Restricted 21.2 39.7
Unrestricted 145.6 140.9
Total Net Assets
701.4$ 656.7$
The statement of net assets reflects the University’s growth, primarily its continued physical expansion to meet
student and faculty needs. Current assets mainly depict cash and investments, amounts due from the State to fund
approved construction, and renovation projects and receivables from students, granting agencies, and others. The
current assets increase is mainly a result of the amounts due from the State, used for construction related projects,
growing by $17.8 million and offset by a $10.1 million decrease in cash and investments, not classified as restricted.
In summary, total assets increased by $51.9 million, or 5.1 percent, while total liabilities increased by $7.2 million, or
2.0 percent. As a result, the net assets balance at June 30, 2009, had a favorable increase of $44.7 million to
This is trial version
www.adultpdf.com
FEBRUARY 2010 REPORT NO. 2010-102
5
$701.4 million. This ending balance included $534.6 million invested in capital assets, net of related debt,
$145.6 million in unrestricted funds, and $21.2 million in restricted funds.
For more detailed information, see the statement of net assets.
T
HE STATEMENT OF REVENUES, EXPENSES, AND CHANGES IN NET ASSETS
The statement of revenues, expenses, and changes in net assets presents the University’s revenue and expense activity,
categorized as operating and nonoperating. Revenues and expenses are recognized when earned or incurred,
regardless of when cash is received or paid.
The following summarizes the University’s activity for the 2008-09 and 2007-08 fiscal years:
Condensed Statement of Revenues, Expenses,
and Changes in Net Assets
(In Millions)
2008-09 2007-08
Operating Revenues 305.7$ 293.0$
Operating Expenses 589.8 563.7
Operating Loss
(284.1) (270.7)
Net Nonoperating Revenues 276.4 296.4
Income (Loss) Before Other Revenues,
Expenses, Gains, or Losses
(7.7) 25.7
Other Revenues, Expenses, Gains, or Losses 52.4 26.8
Net Increase In Net Assets
44.7 52.5
Net Assets, Beginning of Year 656.7 604.2
Net Assets, End of Year
701.4$ 656.7$
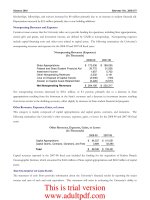
Operating Revenues
GASB Statement No. 35 categorizes revenues as either operating or nonoperating. Operating revenues generally
result from exchange transactions where each of the parties to the transaction either give up or receive something of
equal or similar value.
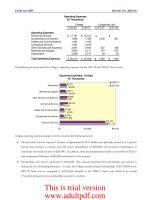
The following summarizes the operating revenues by source that were used to fund operating activities during the
2008-09 and 2007-08 fiscal years:
Operating Revenues
(In Millions)
2008-09 2007-08
Net Tuition and Fees 128.8$ 117.6$
Grants and Contracts 74.0 79.1
Sales and Services of Educational Departments 0.4 4.0
Sales and Services of Auxiliary Enterprises 88.5 81.2
Other 14.0 11.1
Total Operating Revenues
305.7$ 293.0$
This is trial version
www.adultpdf.com
FEBRUARY 2010 REPORT NO. 2010-102
6
Operating revenues totaled $305.7 million for the 2008-09 fiscal year, representing a 4.3 percent increase over the
2007-08 fiscal year. This was due to an increase in net student tuition and fees of $11.2 million, a decrease in grant
and contract revenues of $5.1 million, an increase in sales and services revenues of $3.7 million, and an increase in
other revenues of $2.9 million.
Operating Expenses
Expenses are categorized as operating or nonoperating. The majority of the University’s expenses are operating
expenses as defined by GASB Statement No. 35. GASB gives financial reporting entities the choice of reporting
operating expenses in the functional or natural classifications. The University has chosen to report the expenses in
their natural classification on the statement of revenues, expenses, and changes in net assets and has displayed the
functional classification in the notes to financial statements.
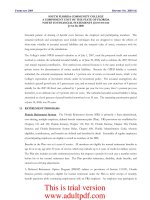
The following summarizes the operating expenses by natural classifications for the 2008-09 and 2007-08 fiscal years:
Operating Expenses
(In Millions)
2008-09 2007-08
Compensation and Employee Benefits 360.4$ 353.3$
Services and Supplies 124.2 110.2
Utilities and Communications 15.4 15.7
Scholarships, Fellowships, and Waivers 53.7 48.7
Depreciation 36.1 35.8
Total Operating Expenses
589.8$ 563.7$
Operating expenses totaled $589.8 million for the 2008-09 fiscal year. This represents a 4.6 percent increase over the
2007-08 fiscal year and was primarily due to an increase in compensation and employee benefits of $7.1 million, an
increase in services and supplies expense of $14 million, and an increase of $5 million in scholarships, fellowships and
waivers.
Nonoperating Revenues and Expenses
Certain revenue sources that the University relies on to provide funding for operations, including State appropriations,
certain gifts and grants, and investment income, are defined by GASB as nonoperating. Nonoperating expenses
include capital financing costs and other costs related to capital assets. The following summarizes the University’s
nonoperating revenues and expenses for the 2008-09 and 2007-08 fiscal years:
This is trial version
www.adultpdf.com