United States General Accounting Office GAO May 2000 Report to the Congress FINANCIAL AUDIT_part3 ppt
Bạn đang xem bản rút gọn của tài liệu. Xem và tải ngay bản đầy đủ của tài liệu tại đây (43.82 KB, 3 trang )
Bank Insurance Fund’s Financial Statements
Page 19 GAO/AIMD-00-157 FDIC’s 1999 and 1998 Financial Statements
The FDICIA also established a limitation on obligations that can be incurred by the BIF, known
as the maximum obligation limitation (MOL). At December 31, 1999, the MOL for the BIF was
$51.8 billion.
Receivership Operations
The FDIC is responsible for managing and disposing of the assets of failed institutions in an
orderly and efficient manner. The assets held by receivership entities, and the claims against
them, are accounted for separately from BIF assets and liabilities to ensure that liquidation
proceeds are distributed in accordance with applicable laws and regulations. Also, the income
and expenses attributable to receiverships are accounted for as transactions of those
receiverships. Liquidation expenses paid by the BIF on behalf of the receiverships are recovered
from those receiverships.
2. Summary of Significant Accounting Policies
General
These financial statements pertain to the financial position, results of operations, and cash flows
of the BIF and are presented in accordance with generally accepted accounting principles
(GAAP). These statements do not include reporting for assets and liabilities of closed banks for
which the FDIC acts as receiver or liquidating agent. Periodic and final accountability reports of
the FDIC's activities as receiver or liquidating agent are furnished to courts, supervisory
authorities, and others as required.
Use of Estimates
FDIC management makes estimates and assumptions that affect the amounts reported in the
financial statements and accompanying notes. Actual results could differ from these estimates.
Where it is reasonably possible that changes in estimates will cause a material change in the
financial statements in the near term, the nature and extent of such changes in estimates have
been disclosed.
Cash Equivalents
Cash equivalents are short-term, highly liquid investments with original maturities of three
months or less. Cash equivalents primarily consist of Special U.S. Treasury Certificates.
Investments in U.S. Treasury Obligations
Investments in U.S. Treasury obligations are recorded pursuant to the Statement of Financial
Accounting Standards (SFAS) No. 115, “Accounting for Certain Investments in Debt and Equity
Securities.” SFAS No. 115 requires that securities be classified in one of three categories: held-
to-maturity, available-for-sale, or trading. Securities designated as held-to-maturity are shown at
amortized cost. Amortized cost is the face value of securities plus the unamortized premium or
less the unamortized discount. Amortizations are computed on a daily basis from the date of
acquisition to the date of maturity. Securities designated as available-for-sale are shown at fair
value with unrealized gains and losses included in Comprehensive Income. Realized gains and
losses are included in the Statements of Income and Fund Balance as components of Net Income.
Interest on both types of securities is calculated on a daily basis and recorded monthly using the
effective interest method. The BIF does not designate any securities as trading.
This is trial version
www.adultpdf.com
Bank Insurance Fund’s Financial Statements
Page 20 GAO/AIMD-00-157 FDIC’s 1999 and 1998 Financial Statements
Allowance for Losses on Receivables From Bank Resolutions and Assets Acquired from
Assisted Banks and Terminated Receiverships
The BIF records a receivable for the amounts advanced and/or obligations incurred for resolving
failing and failed banks. The BIF also records as an asset the amounts paid for assets acquired
from assisted banks and terminated receiverships. Any related allowance for loss represents the
difference between the funds advanced and/or obligations incurred and the expected repayment.
The latter is based on estimates of discounted cash recoveries from the assets of assisted or failed
banks, net of all applicable estimated liquidation costs.
Cost Allocations Among Funds
Operating expenses not directly charged to the funds are allocated to all funds administered by
the FDIC using workload-based-allocation percentages. These percentages are developed during
the annual corporate planning process and through supplemental functional analyses.
Postretirement Benefits Other Than Pensions
The FDIC established an entity to provide the accounting and administration of postretirement
benefits on behalf of the BIF, the SAIF, and the FRF. Each fund pays its liabilities for these
benefits directly to the entity. The BIF’s unfunded net postretirement benefits liability is
presented in the BIF’s Statements of Financial Position.
Disclosure About Recent Accounting Standard Pronouncements
In February 1998, the Financial Accounting Standards Board (FASB) issued SFAS No. 132,
“Employers’ Disclosures about Pensions and Other Postretirement Benefits.” The Statement
standardizes the disclosure requirements for pensions and other postretirement benefits to the
extent practicable. Although changes in the BIF’s disclosures for postretirement benefits have
been made, the impact is not material.
In March 1998, the American Institute of Certified Public Accountants issued Statement of
Position (SOP) 98-1, “Accounting for the Costs of Computer Software Developed or Obtained
for Internal Use.” This Statement requires the development or purchase cost of internal-use
software to be treated as a capital asset. The FDIC adopted this Statement effective January 1,
1998. This asset is presented in the “Property and equipment, net” line item in the BIF’s
Statements of Financial Position (see Note 6).
Other recent pronouncements are not applicable to the financial statements.
Depreciation
The FDIC has designated the BIF as administrator of property and equipment used in its
operations. Consequently, the BIF includes the cost of these assets in its financial statements and
provides the necessary funding for them. The BIF charges the other funds usage fees
representing an allocated share of its annual depreciation expense. These usage fees are recorded
as cost recoveries, which reduce operating expenses.
This is trial version
www.adultpdf.com
Bank Insurance Fund’s Financial Statements
Page 22 GAO/AIMD-00-157 FDIC’s 1999 and 1998 Financial Statements
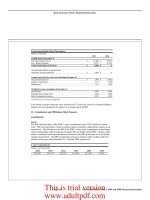
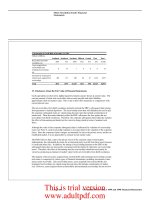
U.S. Treasury Obligations at December 31, 1999
Dollars in Thousands
Stated Unrealized Unrealized
Yield at Face Amortized Holding Holding Market
Maturity Purchase (a) Value Cost Gains Losses Value
1-3 years 6.06% 6,540,000 6,669,580 7,233 (32,331) 6,644,482
3-5 years 6.45% 4,805,000 5,052,441 18,300 (17,217) 5,053,524
5-10 years 5.88% 9,439,053 9,665,955 58,403 (374,526) 9,349,832
Total $ 23,344,053 $ 23,949,655 $ 87,023 $ (426,542) $ 23,610,136
1-3 years 5.36% 625,000 631,662 0 (7,001) 624,661
3-5 years 6.00% 445,000 454,254 0 (6,391) 447,863
5-10 years 5.15% 2,977,452 2,852,055 0 (67,329) 2,784,726
Total $ 4,477,452 $ 4,369,177 $ 48 $ (80,815) $ 4,288,410
Total $ 27,821,505 $ 28,318,832 $ 87,071 $ (507,357) $ 27,898,546
(a) For TIIS, the yields in the above table include their stated real yields at purchase, not their effective yields.
Effective yields on TIIS would include the stated real yield at purchse plus an inflation adjustment of 2.6%,
which was the latest year-over-year increase in the CPI as reported by the Bureau of Labor Statistics on
December 14,1999. These effective yields are 6.44% and 6.70% for TIIS classified as held-to-maturity and
available-for-sale, respectively.
U.S. Treasury Obligations at December 31, 1998
Dollars in Thousands
Stated Unrealized Unrealized
Yield at Face Amortized Holding Holding Market
Maturity Purchase Value Cost Gains Losses Value
1-3 years 6.04% 5,525,000 5,564,524 148,112 0 5,712,636
3-5 years 6.19% 5,965,000 6,345,044 322,126 0 6,667,170
5-10 years 6.01% 10,295,000 10,566,047 864,116 0 11,430,163
Total $ 23,905,000 $ 24,609,063 $ 1,344,951 $ 0 $ 25,954,014
1-3 years 5.63% 550,000 558,991 5,968 0 564,959
Total $ 1,490,000 $ 1,505,717 $ 10,915 $ 0 $ 1,516,632
Total $ 25,395,000 $ 26,114,780 $ 1,355,866 $ 0 $ 27,470,646
Total Investment in U.S. Treasury Obligations, Net
Held-to-Maturity
Available-for-Sale
Total Investment in U.S. Treasury Obligations, Net
Held-to-Maturity
0 $ 951,673
Less than
one
y
ear
$5.09% $ 940,000 $
2,560,000
946,726
Available-for-Sale
Less than
one
y
ear
$
5.57%
$
Less than
one
y
ear
4,947 $
$ 2,120,000 $ 2,133,448
Less than
one
y
ear
(2,468) $ 2,562,298$ 2,561,679 $ 3,0876.02% $
$ 2,144,045$ 10,597 $ 0
(94) $ 431,1605.62% $ 430,000 $ 431,206 $ 48
This is trial version
www.adultpdf.com
