Wiley Wastewater Quality Monitoring and Treatment_13 docx
Bạn đang xem bản rút gọn của tài liệu. Xem và tải ngay bản đầy đủ của tài liệu tại đây (488.16 KB, 19 trang )
JWBK117-3.3 JWBK117-Quevauviller October 10, 2006 20:28 Char Count= 0
References 217
Devisscher, M., Bixio, D., Geenens, D. and Thoeye, C. (2001) In: Proc. IWA 2nd World Water
Congress, 15–19 October 2001, Berlin, Germany.
European Commission (1992a) Methods for determination of ecotoxicity; Annex V, C.1. Acute
toxicity for fish. Directive 92/69/EEC, O.J. L383A.
European Commission (1992b) Methods for determination of ecotoxicity; Annex V, C.2. Acute
toxicity for Daphnia. Directive 92/69/EEC, O.J. L383A.
European Commission (1992c) Methods for determination of ecotoxicity; Annex V, C.3. Algal
inhibition test. Directive 92/69/EEC, O.J. L383A.
Farr´e, M. and Barcel´o, D. (2003) Trends Anal. Chem., 22(5), 299–310.
Geenens, D. and Thoeye, C. (1998) Water Sci. Technol., 37(12), 213–218.
Gernaey, K., Verschuere, L., Luyten, L. and Verstraete, W. (1997) Water Environ. Res., 69(6),
1163–1169.
Gernaey, K., Bogaert, H., Vanrolleghem, P., Massone, A., Rozzi, A. and Verstraete, W. (1998)
Water Sci. Technol., 37(12), 103–110.
Grau, P. and Da-Rin, B.P. (1997) Water Sci. Technol., 36(1–2), 1–8.
Guti´errez, M., Etxebarria, J. and de las Fuentes, L. (2002) Water Res., 36(4), 919–924.
Hayes, E., Upton, J., Batts, R. and Spickin, R. (1998) Water Sci. Technol., 37(12), 193–196.
Hernando, M.D., Fernandez-Alba, A.R., Tauler, R. and Bercel´o, D. (2005) Talanta., 65(2), 358–
366.
Hoffmann, C. and Christofi, N. (2001). Testing the toxicity of influents to activated sludge plants
with the Vibrio fischeri bloassay utilising a sludge matrix. Environ. Toxicol.,16 (5), 422–
427.
International Standardization Organization (1998) Water quality: determination of the inhibitory
effect of water samples on the light emission of Vibrio fischeri. ISO 11348-1, 2 and 3. Interna-
tional Standardization Organization, Geneva, Switzerland.
J¨onsson, K. (2001) Inhibition of nitrification in municipal wastewater – sources, effects, evaluation
and remedies. PhD Dissertation, Lund University of Technology, Lund, Sweden.
Kelly, C.J., Lajoie, C. A., Layton, A .C. and Sayler, G. S. (1999). Water Environ. Res., 71, 31–35.
Kong, Z., Vanrolleghem, P.A., Willems, P. and Verstraete, W. (1996) Water Res., 30(4), 825–836.
La Point, T.W. and Waller, W.T. (2000) Environ. Toxicol. Chem., 19(1), 14–24.
Love, N.G. and Bott, C.B. (2000) A review and needs survey of upset early warning devices.
Report No. 99-WWF-2. Water Environment Research Foundation, Alexandria (VA), USA.
Paxeus, N. (1996) Water Res., 30(5), 1115–1122.
Philp, J., French, C., Wiles, S., Bell, J., Whiteley, A. and Bailey, M. (2004) Wastewater toxicity
assessment by whole cell biosensor. In: The Handbook of Environmental Chemistry, Vol. 5,
Part I, pp. 165–225. Springer-Verlag, Berlin, Germany.
Ren, S. (2004) Environ. Int.
, 30, 1151–1164.
Ren, S. and Frymier, P.D. (2003) Water Environ Res., 75(1), 21–29.
Ren, S. and Frymier, P.D. (2004) J. Environ. Engin., 130(4), 484–488.
Spanjers, H. (1993) Respirometry in activated sludge. PhD Thesis, Wageningen Agricultural
University, Wageningen, The Netherlands.
Thornton, I., Butler, D., Docx, P., Hession, M., Makropoulos, C., McMullen, M., Nieuwenhuijsen,
M., Pitman, A., Rautiu, R., Sawyer, R., Smith, S., White, D., Wilderer, P., Paris, S., Marani, D.,
Braguglia, C. and Palerm, J. (2001) Pollutants in urban wastewater and sewage sludge. Report
for Directorate-General Environment ( />sludge
pollutants.htm).
Tinsley, D., Wharfe, J., Campbell, D., Chown, P., Taylor, D., Upton, J. and Taylor, C. (2004)
Ecotoxicol., 13(5), 423–436.
US EPA (1991) Methods for aquatic toxicity identification evaluations: phase I, toxicity charac-
terization procedures, 2nd Ed. EPA/600/6-91-003.
JWBK117-3.3 JWBK117-Quevauviller October 10, 2006 20:28 Char Count= 0
218 Toxicity Evaluation
US EPA (1994) Whole effluent toxicity (WET) control policy: policy for the development of
effluent limitations in national pollutant discharge elimination system permits to control whole
effluent toxicity for the protection of aquatic life. EPA/833B-94/002.
US EPA (1999) Toxicity reduction evaluation guidance for municipal wastewater treatment plants.
EPA/833B-99/002.
Vanrolleghem, P.A. (1994) On-line modelling of activated sludge processes: development of an
adaptive sensor. PhD Thesis, Ghent University, Ghert, Belgium.
JWBK117-3.4 JWBK117-Quevauviller October 10, 2006 20:30 Char Count= 0
3.4
Nutrient Control
Victor Cerd`a and Jos´e Manuel Estela
3.4.1 Introduction
3.4.2 Occurrence, Importance and Terminology
3.4.2.1 Nitrogen
3.4.2.2 Phosphorus
3.4.3 Sample Handling and Preservation
3.4.3.1 Nitrogen
3.4.3.2 Phosphorus
3.4.4 Standard Recommended Methods of Analysis
3.4.4.1 Nitrogen
3.4.4.2 Phosphorus
3.4.5 Flow Analysis Methods
3.4.5.1 Nitrogen
3.4.5.2 Phosphorus
3.4.6 Chromatographic Methods
3.4.7 Capillary Electrophoresis Methods
References
3.4.1 INTRODUCTION
Nutrients are chemical elements and compounds found in the environment that
plants and animals need to grow and survive. For water-quality investigations the
various forms of nitrogen and phosphorus are the nutrients of interest. The forms
Wastewater Quality Monitoring and Treatment Edited by P. Quevauviller, O. Thomas and A. van der Beken
C
2006 John Wiley & Sons, Ltd. ISBN: 0-471-49929-3
JWBK117-3.4 JWBK117-Quevauviller October 10, 2006 20:30 Char Count= 0
220 Nutrient Control
include nitrate, nitrite, ammonia, organic nitrogen (in the form of plant material or
other organic compounds) and phosphates (orthophosphate and others). Nitrate is
the most common form of nitrogen and phosphates are the most common forms
of phosphorus found in natural waters. High concentrations of nutrients in water
bodies can potentially cause eutrophication and hypoxia. Eutrophication is a process
whereby water bodies, such as lakes, estuaries, or slow-moving streams receive
excess nutrients that stimulate excessive plant growth (algae, periphyton attached
algae and nuisance weeds). This enhanced plant growth, often called an algal bloom,
reduces dissolved oxygen in the water when dead plant material decomposes and
can cause other organisms to die. Nutrients can come from many sources, such as
fertilizers applied to agricultural fields, golf courses, and suburban lawns; deposition
of nitrogen from the atmosphere; erosion of soil containing nutrients;and wastewater
treatment plant discharges. Water with a low concentration of dissolved oxygen is
called hypoxic hypoxia means ‘low oxygen’. In many cases hypoxic waters do not
have enough oxygen to support fish and other aquaticanimals. Hypoxia can be caused
by the presence of excess nutrients in water. Nutrient control is, therefore, essential
for maintaining thequality of waters with theaim to avoid sanitary and eutrophication
problems. This control also facilitates the implementation of strategies in wastewater
treatment plants allowing them to comply with the legal requirements in effluent
contents and to optimize processes that economize both the energetic and chemical
reagent consumptions.
3.4.2 OCCURRENCE, IMPORTANCE
AND TERMINOLOGY
In this section we will briefly discuss, on an individual basis, some properties and
characteristics, as well as the terminology proposed (and usually accepted), used in
nutrient analysis and assessment.
3.4.2.1 Nitrogen
Nitrogen is a bioessential element. The different nitrogen forms (nitrate, nitrite,
ammonia and organic nitrogen) in addition to nitrogen gas (N
2
) are biochemically
interconvertible and are part of the so-called nitrogen cycle (Russell, 1994), which
includes natural and anthropogenic components. It is of great complexity due to
the diversity of compounds and transformations involved. From an analytical point
of view, it is a habitual practice (Standard Methods Committee, 1988) to refer to
organic nitrogen as N
org
, nitrate nitrogen as NO
−
3
-N, nitrite nitrogen as NO
−
2
-N and
ammonia nitrogen as NH
3
-N.
Organic nitrogen is defined (Mopper and Zika, 1987) as the nitrogen organically
linked in the oxidation state -3, and does not include all the organic compounds of
nitrogen. It can be determined together with ammonia and in this case constitutes the
so-called Kjeldahl nitrogen. Organic nitrogen includes products such as peptides,
JWBK117-3.4 JWBK117-Quevauviller October 10, 2006 20:30 Char Count= 0
Occurrence, Importance and Terminology 221
proteins, nucleic acids, urea and synthetic organic materials. Its concentration in
wastewaters can be higher than 20 mg/l.
Total oxidized nitrogen is the sum of nitrite and nitrate nitrogens. Nitrate is only
found in small amounts in domestic wastewaters; however, in the diluent of nitrifying
biological treatment plants nitrate can be found at concentrations of up to 30 mg/l of
NO
−
3
-N. Nitrite is an intermediate oxidation state of nitrogen and can be generated
from oxidation of ammonia or reduction of nitrate. Oxidation is a common practice
in wastewater treatmentplants. An important supply of nitrites comes from industrial
wastewaters since it is used as an additive to inhibit corrosion in industrial processes.
Nitrite is the real cause of the well-known disease methahemoglobinemia (Burden,
1961; Johnson and Cross, 1990) and also the nitrous acid formed in acidic media can
react with secondary amines, nitrosation in vivo, giving rise to nitrosamines many
of which are carcinogenic (Forman et al., 1985).
Ammonia is a naturally occurring compound found in wastewaters, produced by
deamination of nitrogenated organic compounds and by hydrolysis of urea. In some
wastewater treatment plants it is even used as an additive to react with chlorine
and form combined residual chlorine (mono- and dichloramines). In wastewaters its
concentration can surpass 30 mg/l NH
3
–N.
In the European Community 91/271/CEE Council regulation on urban wastewa-
ters treatment, a minimum reduction percentage of 70–80 % is required, establishing
a maximum total nitrogen concentration (Kjedahl nitrogen) of 15 and 10 mg/l N
for populations of 10 000–100 000 i e.(inhabitant-equivalent) and for more than
100 000 i e., respectively. The i e. is the biodegradable organic load with a bio-
chemical oxygen demand for 5 days (BOD5) of 60 g oxygen per day.
3.4.2.2 Phosphorus
Phosphorus is one of the key elements necessary for the growth of plants and ani-
mals. Phosphorus in the elemental form is very toxic and is subject to bioaccumu-
lation. Phosphates, derived from phosphorus, are present in three forms: orthophos-
phate, polyphosphate and organically bound phosphate. Ortho forms are produced
by natural processes and are found in sediments, natural waters and sewage. Poly
forms are used for treating boiler waters and in detergents. In water, they change
into the ortho form. Organic phosphates play an important role in nature, and their
occurrence may result from the breakdown of organic pesticides containing phos-
phates. They may exist in solution, as particles or in the bodies of aquatic organisms.
Phosphorus in aquatic systems may originate from natural sources such as the min-
eralization of algae and the dissolution of phosphate minerals, from anthropogenic
point source discharges of sewage and industrial effluents and from diffuse inputs
from grazing and agricultural land.Studies carried outin theUSA have demonstrated
that phosphorus inputs to the environment have increased since 1950 as the use of
phosphate fertilizer, manure, and phosphate laundry detergent increased; however,
the manufacture of phosphate detergent for household laundry was ended volun-
tarily in about 1994 after many States established phosphate detergent bans. Total
JWBK117-3.4 JWBK117-Quevauviller October 10, 2006 20:30 Char Count= 0
222 Nutrient Control
phosphorus concentrations in raw wastewater effluent contained about 3 mg/l of total
phosphorus during the 1940s, increased to about 11 mg/l at the height of phosphate
detergent use (1970), and have currently declined to about 5 mg/l. However, in some
cases, tertiary wastewater treatment still is needed to effectively improve water qual-
ity of streams. Downward trends in phosphorus concentrations since 1970 have been
identified in many streams, but median total phosphorus concentrations still exceed
the recommended limit of 0.1 mg/l across much of the USA. In the European Com-
munity 91/271/CEE Council regulation on urban wastewaters treatment, a minimum
reduction percentage of 80 % is required, establishing a maximum total phosphorus
concentration of 1 and 2 mg/l for populations between 10 000 and 100 000 i e. and
for more than 100 000 i e., respectively.
The analysis of water samples (natural, waste, etc.) are especially complex owing
to the fact that phosphorus canbe found in the form of different inorganic and organic
species (McKelvie et al., 1995), which in turn can be present in either the dissolved,
colloidal or particulate form. However, the dominant species is always orthophos-
phate. Usually, inthe analysis of water samples theanalysisof thephosphorus content
is carried outon aliquots ofthe whole sample andon aliquots ofthe samplepreviously
filtered through membrane filters of 0.45 and 0.2 μm nominal pore size (Standards
Australia and Standards New Zealand, 1998) or glass fibre filters (GF/F 0.7 and
1.2 μm) (Brober and Persson, 1988). The aim of this procedure is to obtain the
data required for the calculation of the parameters that allow the evaluation of as-
pects such as the content of phosphorus in several organic and inorganic species, the
eutrophication of aquatic systems or the amount of bioavailable phosphorus (BAP).
Parameters determined on the filtered fraction contain the word filterable, namely:
filterable reactive phosphorus (FRP), total filterable phosphorus (TFP) and filterable
acid-hydrolysable phosphorus (FAHP). However, in the literature it is indistinctly
used together with the words dissolved or soluble (McKelvie, 2000). On the other
hand, the term reactive refers to the phosphorus species that react with molybdate
to form 12-phosphomolybdate (12PM) or phosphomolybdenum blue (PMB), the
latter if a reducing agent is present in the reaction medium. Filterable condensed
phosphates (FCP) are comprised of inorganic polyphosphates, metaphosphates and
branched ring structures. The term acid-hydrolysable phosphorus refers to the re-
quired acidic hydrolysis for the conversion of condensed phosphates into orthophos-
phate. Therefore, FCP = FAHP and if the formation reaction of 12PM or PMB is
used for the corresponding determination, thus, FRP +FAHP is obtained. The filter-
able organic phosphorus fraction [FOP =TFP −(FAHP +FRP)] consists of nucleic
acids, phospholipids, inositol phosphates, phosphoamides, phosphoproteins, sugar
phosphates, aminophosphonic acids, phosphorus-containing pesticides as well as or-
ganic condensed phosphates (Armstrong, 1972; Brober and Persson, 1988; Robards
et al., 1994; Stumm and Morgan, 1996).
The parameters obtained on the aliquots of the whole sample (without filtra-
tion processes) contain the word total, namely: total reactive phosphorus (TRP),
total acid-hydrolysable phosphorus (TAHP), total phosphorus (TP) and total organic
phosphorus (TOP) and are equivalent to those previously mentioned. However, they
also considerthe particulate fraction. Determination ofFOP,TFP, TP or TOP requires
JWBK117-3.4 JWBK117-Quevauviller October 10, 2006 20:30 Char Count= 0
Sample Handling and Preservation 223
a previous digestion of the sample for the conversion of the organic phosphates into
the orthophosphate reactive specie.
The numerical treatment of the parameters determined on the filtrated and the
whole fractions of the sample allow the evaluation of other parameters related to
the contents of phosphorus in the particulate phase, namely: total particulate phos-
phorus (TPP = TP − TFP), particulate reactive phosphorus (PRP = TRF − FRP),
particulate acid-hydrolysable phosphorus (PAP = TAHP − FAHP) and particulate
organic phosphorus (POP = TOP − FOP).
Thus, both TP and FRP are the most measured parameters. TP provides a mea-
surement of the maximum potential bioavailable phosphorus, whereas FRP, com-
prising mostly orthophosphate, provides an indication of the amount of most readily
bioavailable phosphorus.
3.4.3 SAMPLE HANDLING AND PRESERVATION
Sample handling, preservation and the time involved until performing the analysis
are steps that should be carefully considered. These steps may vary for the same
analyte according to either the need to carry out a speciation or if the contents in the
different fractions of the sample should be determined or not. Nutrients can easily
evolve after the sample handling and, thus, the general recommendation is to carry
out determination as soon as possible. There is a generalized tendency to reject the
use of preservative additives harmful to the environment, such as mercury salts or
certain organic solvents. Freezing of the sample is a widely accepted alternative,
in agreement with the ‘green chemistry’ policy, and which usually only requires
filtration and/or addition of less aggressive preservative additives. In wastewater
treatment plantsfor daily nutrient control and for several operative reasons, monitors,
sensors or kits are used to perform analysis in situ, thus avoiding both the sample
preservation steps and storage. However, on some occasions, and due to the need to
carry out sample collection, in order to use a generalized automatic analysis system
and/or for the determination of certain parameters, one should resort to preservation
and storage of the samples. Next, we will discuss the recommendations that have
been published and successfully applied for several years (APHA-AWWA-WPCF,
2000) and that have been reviewed in other publications (Nollet, 2000).
3.4.3.1 Nitrogen
Ammonia
It is recommended that sample analysis be carried out as soon as possible, between
1–2 h after collection. If samples are to be analysed within 24 h of collection, re-
frigerate unacidified at 4
◦
C. Samples should be collected in LDPE (low density
polyethylene) glass bottles or PTFE (polytetrafluoroethylene). The residual chlorine
should be destroyed immediately with a dechlorinating agent(sodium sulfite, sodium
JWBK117-3.4 JWBK117-Quevauviller October 10, 2006 20:30 Char Count= 0
224 Nutrient Control
thiosulfate, phenylarsine oxide or sodium arsenite) to hinder its reaction with ammo-
nia. Ifa fast analysis is not possible, samples can be preserved forup to28 days frozen
at −20
◦
C unacidified or by acidifying with sulfuric acid (0.8 ml of conc. H
2
SO
4
/l
sample is usually enough, pH = 1.5–2) and storing at 4
◦
C. Acid neutralization is
required prior to determination.
Nitrite
Samples can be collected in glass bottles or polyethylene. Determination should
be carried out immediately after sample collection to avoid or minimize bacteria
activity, and preservation of the samples with acid should never be used due to its
rapid conversion into nitrate. Samples can be kept frozen for short periods of time
(1 or 2 days) at −20
◦
C or stored at 4
◦
C.
Nitrate
It is recommended that determination be carried out immediately after sample col-
lection, in glass bottles or polyethylene. Samples can be stored up to 24 h at 4
◦
C.
Preservation for longer periods requires the addition of 2 ml of conc. H
2
SO
4
/l sam-
ple. In the case of using acid it should be borne in mind that the step from nitrite to
nitrate will have taken place and, thus, both species cannot be determined individ-
ually. Sample preservation, prior to filtration through alumina, with mercury salts
or chloroform is not recommended for environmental reasons and also because it
interferes with the reduction of nitrate to nitrite if the granulated copper–cadmium
method is employed.
Organic nitrogen
Samples can be collected in glass, poly(vinyl chloride) or polyethylene containers.
As in previous cases, it isadvisable to carry out the analysis immediately after sample
collection. Otherwise, samples canbestored acidified withconc. H
2
SO
4
(pH 1.5–2.0)
and at 4
◦
C. Mercury salts should not be used (i.e. HgCl
2
) as preservatives since they
interfere with ammonia elimination. Several authors (Dore et al., 1996) recommend
freezing the samples for preservation purposes. If this procedure is used, potential
errors due to flocculation during freezing can be reduced by intensive mixing before
analysis.
3.4.3.2 Phosphorus
Freezing is the most popular and general sample preservation procedure for P anal-
ysis. However, the manner in which samples are preserved depends on whether
differentiation of the different forms is required or not.
JWBK117-3.4 JWBK117-Quevauviller October 10, 2006 20:30 Char Count= 0
Standard Recommended Methods of Analysis 225
If no differentiation is required, the TP content is determined; sample freezing
and/or acidification (1 ml HCl/l sample) is a very common practice. If differentia-
tion between the soluble forms – FRP, FAHP and TFP – is required, an immediate
filtration of the samples through membrane filters of 0.45 μm and further freezing is
recommended. Membrane filters should be washed with several portions of distilled
water prior to use to avoid contamination of samples with low phosphate content.
If the sample is difficult to filtrate a previous filtration through glass wool can be
carried out. If the sample needs to be preserved for a long period of time HgCl
2
can be added prior to freezing, although this practice is not currently used for en-
vironmental reasons. Besides, it has been demonstrated that freezing maintains the
stability of the samples for at least 4 months (Clementson and Wayte, 1992). It is
not convenient to add either acid or CHCl
3
as preservatives if differentiation of the
different phosphorus forms is required.
In all cases, samples should be collected in glass containers previously washed:
first with dilute HCl and, then, several times with distilled water. The same washing
procedure is recommended for all used glass material. If the samples are not frozen
they should not be collected in plastic containers since phosphate losses take place
by adsorption across the walls of the containers, especially if their P content is low.
Also, detergents containing phosphates should not be used for the cleaning of the
glass material employed in the analysis.
3.4.4 STANDARD RECOMMENDED
METHODS OF ANALYSIS
In this section the characteristics of the different recommended methods proposed
for the analytical control of nutrients will be presented. The reader is referred to the
literature for procedure details (APHA-AWWA-WPCF, 2000; Nollet, 2000).
3.4.4.1 Nitrogen
Ammonia
Wastewater ammonia is found at low concentrations in good quality nitrified diluents
and can exceed 30 mg/l in effluents. Sensitivity and interferences of a method are al-
waysfactors thathave an influence on theapplicability ofthe method. Fortunately, the
ammonia present in a wastewater sample can be separated from the sample by means
of a previous distillation process (APHA Method 4500-NH
3
B, 2000), thus, making
it possible to use those methods which in their direct application comply with the
sensitivity requirements but do not comply with the selectivity requirements. For de-
termination purposes the following methods are mainly recommended: the titration
method (APHA Method 4500-NH
3
C, 2000), which requires previous distillation
JWBK117-3.4 JWBK117-Quevauviller October 10, 2006 20:30 Char Count= 0
226 Nutrient Control
of the ammonia contained in the sample, the manual colorimetric methods based
on the Nessler reaction (nesslerization) (APHA Method 4500-NH
3
C, 1992) or the
Berthelot reaction (indophenol blue) (APHA Method 4500-NH
3
F, 2000), both with
or without previous distillation, and the ammonia selective electrode method, appli-
cable both directly to the wastewater sample itself or to the distillate, on the basis of
a direct potentiometry (APHA Method 4500-NH
3
D, 2000) with calibration curve
or in a standard addition methodology (APHA Method 4500-NH
3
E, 2000). Ness-
lerization has been dropped (APHA-AWWA-WPCF, 2000) as a standard method,
although it has been considered a classic water quality measurement for more than a
century. The use of mercury in this test warrants its deletion because of the disposal
problems. There are two automated methods (APHA Method 4500-NH
3
G, 2000;
APHA Method 4500-NH
3
H, 2000) based on the classic Berthelot reaction in which
the catalyser, a manganous salt, has been replaced by sodium nitroprusiate. One of
these methods (APHA Method 4500-NH
3
G, 2000) is based on a segmented con-
tinuous flow analysis technique with an analysis throughput of 60 samples per hour.
This method allows NH
3
-N determination directly, prior sample filtration, in domes-
tic and industrial wastewaters within a range of 0.02–2.0 mg/l. The other (APHA
Method 4500-NH
3
H, 2000) is based on a flow injection analysis technique.
Water used in the preparation of reagents should be ammonia free, easily achieved
by using ionic exchange resins; however, it is always advisable to obtain the blank.
In the distillation process the sample is buffered, previously neutralized at pH 9.5 by
addition of borate buffer solution and the distillate is collected over boric acid for the
titration method or the Nessler reaction method and over 0.04 N H
2
SO
4
for the re-
maining methods. As a rule, a previous distillation is recommended for colorimetric
methods since the physical and chemical interferences of the sample such as turbid-
ity, colour, formation of precipitates in the reaction media or those caused by species
added to the samples for preservation purposes (i.e. if acid has been added and the
Bertholet reaction method has been applied) are eliminated. If the Nessler reaction
method is used, and for some domestic wastewater samples, it is possible that distil-
lation may be avoided by pretreatment with zinc sulfate and an alkali. Nevertheless,
this possibility should be previously studied analysing distillates of this same type
of sample and assessing that comparable results are obtained. It should be stressed
that distillation constitutes an important way of eliminating and/or maintaining inter-
ferences at low levels. During distillation, hydrolysis of urea and cyanates together
with the presence of volatile organic compounds (hydrazine and amines) give rise
to interference independent of the analysis method used. The titration method is
mainly used for N-NH
3
concentrations higher than 5 mg/l. Colorimetric methods
are used for concentrations lower than 5 mg/l NH
3
-N, according to the following: the
Berthelot method presents a sensitivity of 10 μg/l NH
3
-N and is used up to 500 μg/l
NH
3
-N and the Nessler method possesses a lower sensitivity, 20 μg/l NH
3
-N, and
is used up to 5 mg/l NH
3
-N. The selective electrode method can be applied within
a considerably wide concentration range 0.03–1400 mg/l NH
3
-N and constitutes a
very interesting alternative since no sample pretreatment (distillation) is required.
However, standards and samples should have a similar ionic content and be measured
JWBK117-3.4 JWBK117-Quevauviller October 10, 2006 20:30 Char Count= 0
Standard Recommended Methods of Analysis 227
at the same temperature. The obtained results should be also confirmed by direct
potentiometry applying a standard addition methodology.
Nitrite
This ionpresents asensitive and selective colorimetric method for itseasy determina-
tion in many aqueous matrixes and, naturally, in domestic and industrial wastewaters.
The method is based on the well-known Griess reaction (APHA Method 4500-NO
−
2
B, 2000), formation of a pink azo-dye at pH 2–2.5 through reaction of diazotized
sulfanylamide with N-(1-naphthyl)-ethylendiamine dichlorohydrate and it is applied
to contents between 10 and 1000 μg/l NO
−
2
-N/l. The sample should contain no solids
in suspension, requirement for any colorimetric method, and therefore, should be
filtered through 0.45 μm membranes if necessary. The following ions: Sb
3+
,Au
3+
,
Bi
3+
,Fe
3+
,Pb
2+
,Hg
2+
,Ag
+
, PtCl
2−
6
and VO
2−
3
precipitate in acid medium and,
thus, should be avoided together with coloured ions and Cu
2+
, which catalyses
the decomposition of the diazonium salt and, therefore, can give rise to low results.
This manual method has been automated (APHA Method 4500-NO
−
3
I, 2000; APHA
Method 4500-NO
−
3
F, 2000). Both automated methods allow the determination of
nitrite and nitrate (prior reduction to nitrite), individually, and of nitrite+nitrate, prior
reduction of nitrate, in wastewaters. The automated method, based on a segmented
continuous flow technique (APHA Method 4500-NO
−
3
F, 2000), allows the determi-
nation in the range 0.5–10 mg N/l with an analysis throughput of 40 samples/h.
If for any reason the previous procedure is not feasible or other anions should also
be analysed, in some cases, ion chromatography can be used. Chromatography is a
multicomponent analysis technique that can eliminate, in certain cases, the need to
use expensive or hazardous reagents. In its ionic modality determination and differ-
entiation of halides (Br
−
,Cl
−
and F
−
), SO
2−
3
,SO
2−
4
,NO
−
2
and NO
−
3
is feasible in an
efficient way. Although there are many modalities of ion chromatography, the use of
ion chromatography with chemical suppression of the eluent conductivity is recom-
mended (APHA Method 4110 B, 2000). This method is applicable to treated wastew-
aters andsome waters from industrial processes,such asboiler or refrigeration circuit
waters, prior filtration of the former through membranefilters of 0.22 μm to avoid the
obstruction of thecolumns. The detection limit isaround 0.1 mg/l. The usual interfer-
ences are those due to the coincidence of the retention times and those caused by high
concentrations, also the proximity of peaks belonging to other ions should be consid-
ered for giving rise to bad chromatographic resolutions. If the dilution of the sample
is feasible, this procedure is a very useful tool for the elimination of interferences.
Nitrate
The approaches recommended for the analysis of nitrates include direct and indi-
rect methods. Among the direct methods is the ion chromatographic method, in its
modality of chemical suppression of the eluent conductivity (APHA Method 4110
JWBK117-3.4 JWBK117-Quevauviller October 10, 2006 20:30 Char Count= 0
228 Nutrient Control
B, 2000), previously mentioned when dealing with the analysis of nitrites, as well as
the nitrate ion selective electrode method (APHA Method 4500-NO
−
3
D, 2000). This
latter method is valid for concentrations between 0.14 and 1400 mg/l NO
−
3
-N/l and
requires keeping the ionic strength at a constant level in both standards and samples,
since the electrode responds to activities rather than concentrations, pH control to
avoid erratic electrode responses and adding reagents which eliminate interferences.
The former requirements are achieved by the addition of a buffer solution which
adjusts the ionic strength and pH to 3 to eliminate the HCO
−
3
interference, contains
Al
2
(SO
4
)
3
to complex organic acids, sulfaminic acid to eliminate NO
−
2
interference,
and Ag
2
SO
4
to eliminate the interferences of Cl
−
,Br
−
,I
−
,S
2−
and CN
−
. It should
be pointed out that in the case of nonwastewater analysis the buffer composition is
likely to be simpler. Indirect methods are based on a previous reduction of the nitrate
ion to nitrite or to NH
3
. Undoubtedly, the colorimetric method based on the Griess
reaction, previously mentioned, which uses a granulated copper–cadmium column
to carry out the reduction to nitrite, has been and probably will continue to be the
most widely used (APHA Method 4500-NO
−
3
E, 2000). The application range of
this method is within 0.01 and 1.0 mg of NO
−
3
-N/l. Being a colorimetric method
and in order to avoid obstructions in the reducing column the solids in suspension
should be eliminated. In the case of a coloured sample, habitual procedures shouldbe
considered. The presence of large amounts of heavy metals, of grease and oxidizing
species, such as residual chlorine, diminish the efficiency of the reducing process.
Grease interference can be eliminated by prior extraction of the former with an or-
ganic solvent. Interferences due to metals and residual chlorine are eliminated by
prior treatment of the sample with ethylendiamine tetraacetic acid (EDTA) and with
sodium thiosulfate, respectively. This method has been automated and previously
cited when dealing with nitrite analysis.
When differentiation of the concentrations of nitrate and nitrite is not required
and bearing in mind that the use of columns is always tiresome, the use of the
automated method based on a segmented continuous flow configuration can be an
advantage. This method uses the Griess reaction for the colorimetric detection and
carries out the nitrate reduction in homogenous phase by means of hydrazine (hy-
drazine sulfate)(APHA Method 4500-NO
−
3
H, 2000). For the correct application of
this method hydrazine sulfate concentration should be adjusted in such a way that the
response obtained for a standard of 2.0 mg N-NO
−
3
/l should coincide with that of a
standard of 2.0 mg N-NO
−
2
/l, and also possible absorptions due to the sample should
be taken intoaccount. The methodcan be appliedto thedetermination ofNO
−
3
+NO
−
2
in domestic and industrial wastewaters between 0.01 and 10 mg N/l. The presence of
sulfide ion at concentration lower than 10 mg/l produces variations of 10 % in the de-
termined concentrations. Similarly, in the case of NH
3
and NO
−
2
concentrations not
being significant in relation to that of NO
−
3
or the determination of the total content
should be required the application of the method of reduction with titanous chloride
would be of interest. The TiCl
3
added to the sample reduces nitrate to NH
3
which is
detected and determined on the basis of potentiometric measurements carried out
with an ammonia selective electrode (APHA Method 4500-NO
−
3
G, 1992).
JWBK117-3.4 JWBK117-Quevauviller October 10, 2006 20:30 Char Count= 0
Standard Recommended Methods of Analysis 229
Organic and total nitrogen
Organic nitrogen is calculated from data obtained in the application of the Kjeldahl
method (APHA Method 4500-N
org
, 2000). This method consists of the transforma-
tion of the amine nitrogen present in many organic compounds, free ammonia and
ammonium nitrogen into ammonium sulfate through sample digestion in a medium
of sulfuric acid, potassium sulfate and a catalyser. The catalyser is usually mercuric
sulfate. However, and due to environmental reasons, if not strongly required it can
be substituted by copper sulfate. Effective digestion results from the use of a reagent
having a salt/acid ratio of 1 g/ml with copper as catalyst, and specified tempera-
ture and time. Nitrogen in the form of azide, azine, azo, hydrazone, nitrate, nitrite,
nitrile, nitrous, oxime and semicarbazone is not transformed. The method allows
the determination of the so-called ‘Kjeldahl nitrogen’ (ammonia nitrogen+organic
nitrogen) to which the NH
3
-N content previously determined is deduced, and the
result is the so-called organic nitrogen. Alternatively, boiling, prior to the digestion
process, can eliminate NH
3
-N and in this case the organic nitrogen content would be
obtained directly. After digestion ammonia is distilled and collected over an adequate
absorbent according to the selected ammonia determination method. The distilla-
tion equipment and determination methods are those above-mentioned when dealing
with ammonia analysis with prior distillation. If the samples to be analysed contain
high organic nitrogen concentrations either the macro (APHA Method 4500-N
org
B,
2000) or semi-micro-Kjeldahl (APHA Method 4500-N
org
C, 2000) method can be
used, otherwise the macro method should be employed. The sample volumes to be
taken is determined according to its organic nitrogen content and there are tables
estimating such volumes. In any case, the macro method involves volumes between
25 ml (for levels between 50 and 100 mg N/l) and 500 ml (for levels lower than 1
mg N/l) and the semi-micro method between 5 ml (for levels between 40 and 400
mg N/l) and 50 ml (for levels between 4 and 40 mg N/l). During digestion chemical
reactions may occur which can give rise to positive and negative interferences, some
difficult to ponder and no adequate methods are available for their elimination. To the
latter group of interferences belongs that of the nitrate ion at concentrations higher
than 10 mg N/l, which can provoke the oxidation of ammonia generating from the
organic matter digestion, giving rise to N
2
O, leading to a negative interference, and
a positive interference due to an excess of organic matter, which can reduce the
nitrate ion to ammonia. Interferences produced by samples with high salt content
or by sulfuric acid shortage, due to an excessive consumption in samples with high
organic matter content, are more well known. In both cases a pyrolytic loss of ni-
trogen is produced and there is a methodology available to avoid them. Thus, in the
first case it is recommended to add excess sulfuric acid (1 ml per g of salt present in
the sample) which maintains the acid–salt equilibrium and avoids the temperature
rising, and in the second case it is recommended to add an excess of 10 ml of sulfuric
acid/3 g of TOC (total organic carbon) or of 50 ml of digestion reagent/g of TOC to
the digestion flask. After digestion it may be necessary to add an excess of alkali in
order to achieve a high pH prior to distillation.
JWBK117-3.4 JWBK117-Quevauviller October 10, 2006 20:30 Char Count= 0
230 Nutrient Control
For the N
org
determination a flow injection method (APHA Method 4500-N
org
D,
2000) has been proposed too. Domestic and industrial wastes are digested in a block
digestor with sulfuric acid and copper as catalyst. The digestion recovers nitrogen
components of biological origin, such as amino acids, proteins and peptides, as
ammonia, but may not recover the nitrogenous compound of some industrial wastes
such as amines, nitro compounds, hydrazones, oximes, semicarbazones, and some
refractory tertiary amines. Nitrate is not recovered. The sample digested is injected
onto a flow injection system. The ammonia produced is heated with salicylate and
hypochlorite to produce a blue colour that is spectrophotometrically detected. The
main source of interference is ammonia.
Total nitrogen can be determined by means of the persulfate method (APHA
4500-N C, 2000) or by in-line UV/persulfate digestion and oxidation with a flow
injection analysis method(APHA Method 4500-N B, 2000). The spectrophotometric
persulfate method determines total nitrogen by alkaline oxidation at 100–110
◦
Cof
all nitrogenous compounds to nitrate. Total nitrogen is determined by analysing the
nitrate inthe digestate by means of automated ormanual cadmiumreduction methods
and Griess-type reaction. In the flow injection analysis method nitrogen compounds
are digested and oxidized in-line to nitrate by use of heated alkaline persulfate and
UV radiation. The digested sample is injected onto the manifold where nitrate is
reduced to nitrite by a cadmium granule column, derivatized with a Griess-type
reaction and detected by spectrophotometry. Both methods recover nearly all forms
of organic and inorganic nitrogen, reduced and oxidized, including ammonia, nitrate
and nitrite.
3.4.4.2 Phosphorus
As previously mentioned, phosphorus determination is complex and occasionally
determination and differentiation between the different forms of phosphorus in the
corresponding fractions of a water sample is required. In spite of the former prece-
dents, which appear to complicate phosphorus analysis, it should be underlined that
there are methods and procedures available which allow carrying out these deter-
minations simply and with ease. Phosphorus analysis involves the performance of
two steps if the sample handling and/or its preservation have already been carried
out (these aspects have been previously discussed). The first step consists of the
transformation of the phosphorus species into orthophosphate, by acidic hydrolysis
or oxidizing digestion (APHA Method 4500-P B, 2000). The second step is the de-
tection and determination of the formed orthophosphate by the colorimetric method
of vanadomolybdophosphoric acid (APHA Method 4500-P C, 2000), which is rec-
ommended for routine analysis and is valid for concentrations ranging between 1
and 20 mg P/l, or the most sensitive colorimetric method of molybdenum blue, ade-
quate for the determination in samples with low phosphorus content. Molybdenum
blue formation can be carried out by reduction of molybdophosphoric acid, formed
through reaction of orthophosphate with ammonium molybdate in acid medium with
stannous chloride (APHA Method 4500-P D, 2000) or ascorbic acid (APHA Method
JWBK117-3.4 JWBK117-Quevauviller October 10, 2006 20:30 Char Count= 0
Standard Recommended Methods of Analysis 231
4500-P E, 2000), if formed by reaction with ammonium molybdate and antimonyl
tartrate also in acid medium. The reduction method with ascorbic acid is more pre-
cise and enables the analysis of samples with levels ranging from 0.01 to 6 mg P/l.
This same method has been automated using a segmented continuous flow technique
(APHA Method 4500-P F, 2000). Thus, orthophosphate can be determined in do-
mestic and industrial wastewaters within a range of 0.001–10 mg P/l in flow cells of
15 mm and with an analysis throughput of 30 samples/h. A flow injection analysis
method for orthophosphate determination has been also proposed (APHA Method
4500-P G, 2000).
In practice, by these methods, the different phosphorus contents are determined
in the sample, without filtration, and in the filtrate, and the contents in the particulate
phase arecalculated by subtraction. However, if necessary, the analysis of the fraction
deposited on the filter can be carried out. Acid hydrolysis is a soft treatment per-
formed at water boiling temperature and with the sample acidified with sulfuric acid
and nitric acid. Through this treatment condensed phosphates and, probably, certain
organic phosphates are transformed into orthophosphate, thus, the term phosphorus
hydrolysable with acid is preferred over that of condensed phosphates. Oxidizing di-
gestion is a far more energetic treatment, which transforms organic phosphates into
orthophosphates and it is essential for the determination of total phosphorus. This
digestion can be carried out by the perchloric acid method, the sulfonitric mixture
method or the persulfate method. Of these three methods the perchloric acid method
is the more efficient, but at the same time the most dangerous; there are explosion
risks if the treating temperature is not controlled and also if working with inadequate
material. Therefore,the sulfonitric mixture method is mostly recommended. The per-
sulfate method is the easiest and there is a strong tendency towards its use, however,
verification of the recoveries with one of the former methods is recommended. After
sample treatment orthophosphate is determined applying the colorimetric methods
to aliquots, and standards, subjected to the same treatment as that of the samples, are
used for calibration purposes. In both methods, i.e. the vanadomolybdophosphoric
acid and the reduction with stannous chloride methods, silica interferes positively
only if thesamplehas been previously heated andarsenate, fluoride, thorium,bismuth
sulfide, thiosulfate, thiocyannate or excess molybdate interfere negatively. Sulfide
interference can be eliminated boiling the sample with bromine water. In the reduc-
tion method with stannous chloride interferences can be eliminated and sensitivity
increased by extracting molybdophosphoric acid in benzene–isobutanol prior to re-
duction. Finally, in the ascorbic acid method arsenate strongly interferes, and more
moderately, hexavalent chromium and nitrite ion, whereas sulfide and silica do not
interfere within concentrations of 1.0 and 10 mg/l, respectively.
The determination of total phosphorus is a very usual practice and two methods
based on the flow injection analysis technique have been proposed. Both methods
are based on molybdenum blue chemistry and spectrophotometric detection of the
orthophosphate generated. The differences between them remain in the necessary
preliminary digestion: manual (APHA Method 4500-P H, 2000) or in-line (APHA
Method 4500-P I, 2000). In the manual method, polyphosphates are converted to the
orthophosphate form by sulfuric acid digestion and organic phosphorus is converted
JWBK117-3.4 JWBK117-Quevauviller October 10, 2006 20:30 Char Count= 0
232 Nutrient Control
to orthophosphate by persulfate digestion. The in-line method needs UV radiation
treatment for organic phosphorus conversion.
3.4.5 FLOW ANALYSIS METHODS
Analysis methods based on flow techniques are an attractive alternative since they
allow the analysis of parameters of interest in different types of samples to be car-
ried out with efficiency, speed, comfort, economy as well as with high degrees of
automation. Previously, we have mentioned several standard methods for nutrient
analysis in wastewaters that use a segmented flow analysis technique or flow injec-
tion analysis technique for the automation of a manual standard procedure. In this
section we will provide the reader a perspective on the analysis methods for nutrient
control in wastewaters based on the more important flow analysis techniques which
have been or currently are the objective of research and development, namely: seg-
mented flow analysis (SFA), continuous flow analysis (CFA), flow injection analysis
(FIA), sequential injection analysis (SIA), multicommuted flow injection analysis
(MCFIA), and multisyringe flow injection analysis (MSFIA). It should be stressed
that the implementation of methods based on flow analysis techniques, in addi-
tion to the advantages previously mentioned, enables monitoring in real time of the
physical and chemical indicators which facilitate water quality control with the aim
to assess the impact of polluted inputs, enhancement of treatments, energetic sav-
ings, etc. The problem of monitoring has been dealt with in several publications
(Trojanowicz et al., 1991; Alexander et al., 1996; Dimitrakopoulos et al., 1996;
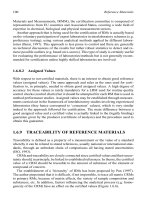
Colin and Quevauviller, 1998; Hanrahan et al., 2002). The scheme corresponding
to a multiparametric monitor, based on a SIA configuration, useful for monitoring
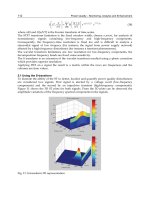
basic water contamination is shown in Figure 3.4.1. The monitor is equipped with
Water
Syringe pump
HCI
RCI
Buffer
Sodium peroxydisulfate
Sample
NaOH
Griess reagent
Air
Waste
SnCI
2
Ammonium
molybdate
HC2
Free port
UV-Spectrophotometer
Acid−base indicator
UV lamp
Waste
Donor
Acceptor
Gas-diffusion
cell
UV
Visible
Detectors
Waste
Figure 3.4.1 Wastewater quality monitoring system. HC, holding coil; RC, reaction coil
JWBK117-3.4 JWBK117-Quevauviller October 10, 2006 20:30 Char Count= 0
Flow Analysis Methods 233
spectrophotometric detectors which allowthe estimation ofthe dissolved organic car-
bonaceous pollution expressed as TOC, COD (chemical oxygen demand) or BOD
(biological oxygen demand) and particulate pollution (TSS, total suspended solids)
using advanced UV spectrophotometry and the determination of ammonium, nitrite,
nitrate, total nitrogen, orthophosphate and total phosphate by UV–visible detection
(Thomas et al., 1997).
3.4.5.1 Nitrogen
Ammonium
Flow analysistechniques based onthe spectrophotometric methods(Menezes-Santos
et al., 1992; Muraki et al., 1992; Cosano et al., 1993; Nobrega et al., 1995) of
Berthelot and Nessler have been developed and adapted to the determination of am-
monium in wastewaters. Methods based on the Berthelot method, in spite of their
greater complexity have proved to possess better analytical advantages. However,
the use of gas diffusion units for isolation of the analyte from the wastewater matrix
to a receptor solution (Andrew et al., 1995; Oms et al., 1996; Akse et al., 1998;
Shen et al., 1998; Vlcek and Kuban, 1999; Mulvaney et al., 2000; Wang et al., 2000)
constitutes an adequate strategy which allows elimination of interferences, except
those caused by the presence of amines, and enables the selection of other types of
detection, besides the spectrophotometric detection, such as potentiometric or con-
ductometric detection. Direct potentiometric detection, using ammonium selective
electrodes of PVC membrane containing nonactin ionophore (Moschou et al., 1998)
or photo-cured membranes on silver wire (Alexander et al., 1997, 1998) as well as
amperometric detection (Shen et al., 1997; Kurzawa et al., 2001) have been used in
wastewater analysis. Methods with chemiluminescence detection in gas phase, with
prior ammonia conversion into nitric oxide and further reaction with ozone (Aoki
et al., 1997), have also been successfully used. We have not found in the literature
any electrochemiluminiscence, chemiluminiscence or fluorescence method in so-
lution applied to this type of matrix. In Table 3.4.1 are summarized the analytical
characteristics of several of the above-mentioned methods.
Nitrite
Several flow spectrophotometric methods have been proposed on the basis of the
Griess reaction, or on modalities of the former, for the analysis of nitrites in aqueous
samples of very different matrixes, among which wastewaters (Segarra-Guerrero
et al., 1996; Gabriel et al., 1998; Hirakawa et al., 1998; Van Staden and van der
Merwe, 1998; Galhardo et al., 2001) are found. The use of a membrane-based optical
flow-through sensor (Frenzel et al., 2004), using the common spectrophotometric
detection scheme for nitrite based azo-dye formation, constitutes a novel option that
allows, alternatively, nitrite detection to be carried out by absorption and reflectance
measurements. This option does not present interferences due to colour or turbidity
JWBK117-3.4 JWBK117-Quevauviller October 10, 2006 20:30 Char Count= 0
Table 3.4.1 Analytical characteristics of some flow analysis methods for determination of ammonia, and nitrate and nitrite in wastewaters
Mode/ Detection
Flow detection Reagent/sensor Linear range RSD% limit Sampling
Analyte system technique characteristics (mg N/l) (mg N/l) (mg N/l) rate (/h) Reference
NH
+
4
FIA Spec NaOH-CR-TB-GPM 1.6–15.6 <3.0 (7.8) 0.78 11 Wang et al., 2000
FIA Spec BrTB-GPM 1.0–100 3.4 (2.0) 0.6 12–13 Andrew et al., 1995
FIA Cond SPBB-GPM 0–49 0.46 (8) 0.008 8–9 Akse et al., 1998
FIA Pot Nonac-GPM-ACC 0.8–140 1.4 (2.8) 0.12 25 Shen et al., 1998
FIA Pot Nonac 1.4–140 3.6 (0.034) 0.014 30 Shen et al., 1997
FIA CL Hyp-O
3
0.0014–1.4 1,8(0.0014) 0.00014 20 Aoki et al., 1997
SIA Cond NaOH-Bor-GPM Up to 62 <3.0 (7.8) 0.08 25 Oms et al., 1996
NO
−
3
FIA Sim/Spec Nitrate: Gr/Cu-Cd 0.056–11.290 2.3 (1.52) 0.056 8 Gabriel et al., 1998
and NO
−
2
Nitrite: Gr 0.015–1.520 1.1 (11.29) 0.015
FIA Seq/Bia Nitrate: NRg/UV 0.023–0.452 1.6 (NR) 0.0152 25 Gil-Torro et al., 1998
Nitrite: NRg 0.030–0.304 1.2 (NR) 0.0076
FIA Seq/Spec Nitrate: DAA/Cu-Cd 0.0000–0.0023 0.76 (0.001) 0.00002 24 Segarra-Guerrero et al.,
Nitrite: DAA 0.018–1.217 0.1(0.635) 0.018 1996
FIA Sim/Gp-CL Nitrate: O
3
/I
−
0.005–1.000 1.2 (0.700) 0.0007 NR Aoki and Wakabayashi,
Nitrite: O
3
/Ti
3+
0.003–1.000 1.4 (0.280) 0.0004 1995
SIA Seq/Spec Nitrate: Gr/Cu-Cd 0.02–2.0 0.8 (0.10) 0.008 20 Galhardo et al., 2001
Nitrite: Gr 0.010–1.0 NR 0.006
FIA Seq/Spec Nitrate: Gr/UV Up to 3.36 2.4 (NR) 0.112 NR Cerd`a et al., 1996
Nitrite: Gr Up to 3.08 1.5 (NR) 0.028
SIA Sim/Spec Nitrate: Gr/Hy Up to 5.6 3.1 (1.40 ) 0.045 NR Oms et al., 1995
Nitrite: Gr Up to 5.6 1.5 (1.40 ) 0.021
RSD, relative standard deviation; NR, not reported. Mode: Sim (simultaneous) or Seq (sequential). Detection technique: Spec (spectrophotometric), Cond (conductometric),
Pot (potentiometric), CL (chemiluminescence), Bia (biamperometric), Gp-CL (gas-phase chemiluminescence). Reagent/sensor characteristics: CR (cresol red), TB (thymol
blue), BrTB (bromothymol blue), GPM (gas permeable membrane), SPBB (solid phase basification beds), ACC (activated carbon cartridge), Nonac (ammonium ion-
selective coated wire sensor involving a nonactin-based membrane), Hyp (sodium hypochlorite), Bor (boric acid), Cu-Cd (copperized-cadmium packed-bed reactor), UV
(UV-irradiation), Gr (Griess-type reaction), NRg (no reagent), DAA (3,6-diamino acridine), Hy (hydrazine).
234
JWBK117-3.4 JWBK117-Quevauviller October 10, 2006 20:30 Char Count= 0
Flow Analysis Methods 235
and does not require prior treatment of the sample. Other flow methods use reactions
which are not of the Griess type. Recently, spectrophotometric-FIA determination
of nitrites in wastewaters based on the reaction of nitrite with thiocyannate has been
described (Kuznetsov et al., 2005). According to Kuznetsov et al. this reaction is
attractive from an analytical point of view due to its high selectivity. Nitrosation of
4-iodine-N,N-dimethylaniline (Nikonorovand Moskvin, 1995),the simple formation
of iodine (Miura and Kusakari, 1999), the catalytic action of nitrite in the oxidation
of Victoria green stand G (Zi et al., 2001) or Rodamine B (Wang and He, 1995) dyes
by potassium bromate in acid medium and the reaction with fuchsine in acid medium
(Zi and Chen, 2000a) in FIA and r-FIA configurations (Zi and Chen, 2000b) have
been also used. Several chemiluminiscence methods have been proposed for deter-
mination of this ion in wastewaters. Thus, the use of quenching has been proposed
in the oxidation of acriflavine by permanganate (Catala-Icardo et al., 2001) and that
based on the conversion of nitrite into nitric oxide and its reaction in gas phase with
ozone (Aoki and Wakabayashi, 1995; Aoki et al., 1997). The remaining detection
instrumental techniques are less frequently employed. Nevertheless, methods using
biamperometric detection (Gil-Torro et al., 1998) and photoacoustic spectrometry
(Carrer et al., 1995) based on pulsed laser excitation have been proposed in FIA
configurations.
Nitrate
Nitrate content in a wastewater sample is usually calculated on the basis of the
difference in contents between oxidized nitrogen (NO
−
2
+NO
−
3
) and nitrite. Flow
analysis methods using this approach usually carry out nitrate on-line reduction
in the heterogeneous phase, using reactors filled with granulated copper–cadmium
(Lapa et al., 2000; Galhardo and Masini, 2001; Gabriel et al., 1998; Hirakawa et al.,
1998; Segarra-Guerrero et al., 1996) or in the homogeneous phase (Oms et al.,
1995) with hydrazine sulfate in the presence of copper sulfate acting as a catalyser.
In both cases the use of a reaction of the Griess type allows the spectrophotometric
determination of the oxidized nitrogen content. Nitrite is usually determined with
the same procedure but without carrying out the reduction step. The photo-induced
generation of nitrite using a mercury lamp wrapped in an aluminium foil as a light
source and adding EDTA to the sample as an activator has been also proposed for
the analysis of wastewaters (Cerd`a et al., 1995). The enzymatic reduction of nitrate
as an alternative to the other systems has not been proposed for this type of sample.
Also, the reduction to NO in the homogeneous phase (Aoki et al., 1997) has been
proposed using I
−
, for nitrite, and Ti
3+
, for nitrate and nitrite, followed by chemi-
luminiscence detection through the reaction of NO with ozone in the gas phase. A
FIA system using a bulk acoustic wave impedance detector together with reducing
columns filled with granulated Zn allows the determination and differentiation of
nitrate and nitrite contents in wastewaters (Su et al., 1998). The on-line reduction
to NH
3
of one or the two species simultaneously, depends on the medium provided