FINANCIAL AUDIT OF THE DEPARTMENT OF BUSINESS, ECONOMIC DEVELOPMENT AND TOURISM STATE OF HAWAII Fiscal Year Ended June 30, 2009 _part2 pdf
Bạn đang xem bản rút gọn của tài liệu. Xem và tải ngay bản đầy đủ của tài liệu tại đây (309.48 KB, 12 trang )
Department
of
Business,
Economic
Development
and
Tourism
State
of
Hawaii
MANAGEMENT'S DISCUSSION AND ANALYSIS
(Continued)
Fiscal
Year
Ended
June
30, 2009
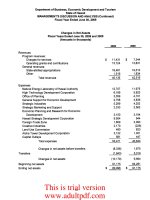
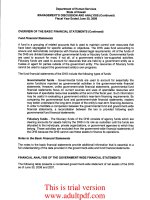
Changes
in
Net
Assets
Fiscal
Years
Ended
June
30, 2009 and 2008
(Amounts
in
thousands)
2009
2008
Revenues
Program revenues:
Charges for services
$
11,431
$
7,344
Operating grants and contributions
13,724
13,831
General revenues:
State-allotted appropriations
18,461
19,510
Other
1,519
1,834
Total revenues
45,135
42,519
Expenses
Natural Energy Laboratory
of
Hawaii Authority
12,707
11,975
High Technology Development Corporation
6,189
5,823
Office
of
Planning
3,359
4,101
General Support for Economic Development
2,758
3,835
Strategic Industries
5,299
4,252
Strategic Marketing and Support
2,333
2,562
Economic Planning and Research for Economic
Development
3,150
3,194
Hawaii Strategic Development Corporation
9,504
944
Foreign-Trade Zone
1,809
2,093
Creative Industries
2,170
(226)
Land Use Commission
490
623
Aloha Tower Development Corporation
3,122
1,021
Capital Outlays
581
447
Total expenses
53,471
40,644
Changes in net assets before transfers
(8,336)
1,875
Transfers
(1,843) 5,019
Changes
in
net assets
(10,179)
6,894
Beginning net assets
91,175
84,281
Ending net assets
$
80,996
$
91,175
13
This is trial version
www.adultpdf.com
Department
of
Business,
Economic
Development and Tourism
State
of
Hawaii
MANAGEMENT'S DISCUSSION AND ANALYSIS (Continued)
Fiscal Year Ended
June
30, 2009
Analysis
of
Changes
in
Net Assets
The DBEDT's net assets decreased
by
$10.2 million or 11.2% during the fiscal year ended
June
30,
2009 primarily due to the current fiscal year's total expenses exceeding the current
fiscal year's total revenues.
Total revenues for the DBEDT were
$45.1
million for the fiscal year ended June
30,
2009.
Revenues generated
by
program charges for services were $11.4 million or 25.3% of the total,
the State-allotted appropriations made
up
$18.5 million or 40.9% of the total, and federal grants
and other sources provided the balance
in
total revenues. Revenues generated
by
program
charges for services increased
by
$4.1
million or 55.7% from the prior fiscal year primarily due
to
an
increase
in
revenues for the Natural Energy Laboratory of Hawaii Authority, the High
Technology Development Corporation and the Hawaii Strategic Development Corporation.
Total expenses for the DBEDT were $53.5 million for the fiscal year ended June
30,
2009. The
expenses were for the following programs administered
by
the DBEDT: Natural Energy
Laboratory of Hawaii Authority (NELHA), Office of Planning, High Technology Development
Corporation, Hawaii Strategic Development Corporation, Strategic Industries, Strategic
Marketing and Support, Creative Industries, Economic Planning and Research for Economic
Development, General Support for Economic Development, Aloha Tower Development
Corporation, Land Use Commission, and the Foreign-Trade Zone. The largest expenses were
for NELHA of $12.7 million or 23.8% of the total expended, which increased $0.7 million or
6.1
% from the prior fiscal year.
FINANCIAL ANALYSIS
OF
DBEDT'S INDIVIDUAL FUNDS
As noted earlier, the DBEDT uses fund accounting to ensure
and
demonstrate compliance with
finance-related legal requirements.
Governmental Funds
The focus of the DBEDT's governmental funds
is
to provide information
on
near-term inflows,
outflows, and balances of spendable resources. Such information
is
useful
in
assessing the
DBEDT's financing requirements.
In
particular, the unreserved fund balance may serve
as
a
useful measure of a government's net resources available for spending at the end
ofthe
fiscal
year.
As of the end of the current fiscal year, the DBEDT's governmental funds reported combined
ending fund balances of $34.6 million, a decrease of $5.5 million or 13.8% from the prior fiscal
year. Approximately $5.8 million or 16.8% of this total amount constitutes the unreserved fund
balance, which
is
available for spending at the DBEDT's discretion
in
the coming fiscal year.
The general fund
is
the DBEDT's primary operating fund. At the end of the current fiscal year,
the fund balance of the DBEDT's general fund was
$3.1
million, which reflects a decrease of
71
% over the prior fiscal year.
14
This is trial version
www.adultpdf.com
Department
of
Business,
Economic
Development and Tourism
State
of
Hawaii
MANAGEMENT'S DISCUSSION AND ANALYSIS (Continued)
Fiscal Year Ended
June
30, 2009
The economic development special revenue fund accounts for
all
programs related to the
development and promotion of industry and international commerce, energy development
and management, economic research and analysis, and the utilization of resources. At the
end of the current fiscal year, the fund balance of the economic development special revenue
fund was $22.7 million, of which $4.8 million was unreserved
and
available for the DBEDT's
expenses.
The capital projects fund accounts for financial resources used for the acquisition or
construction of major capital facilities. The fund balance of the capital projects fund at the
end of the current fiscal year was $8.8 million.
Fiduciary Funds
The DBEDT maintains
an
agency fund for the funds held
in
the bank account for security
deposits for the Foreign-Trade Zone Division, NELHA, and the High Technology
Development Corporation.
GENERAL FUND BUDGETARY HIGHLIGHTS
The difference between the general fund original budget of $11.0 million and the final budget
of $11.6 million was $0.6 million. Actual expenditures were $9.8 million for the fiscal year
ended June
30,
2009, resulting
in
a variance between the final budget and actual
expenditures
on
a budgetary basis of $1.8 million.
CAPITAL ASSETS
The DBEDT's investment
in
capital assets
as
of June
30,
2009, amounted to $50.2 million
(net of accumulated depreciation of $39.3 million). This investment
in
capital assets includes
land, buildings and improvements, machinery, and equipment. Major capital improvement
project expenses for the fiscal year ended June
30,
2009, were for improvements at NELHA.
ECONOMIC FACTORS AND NEXT YEAR'S BUDGET
Hawaii
is
currently going through a period of economic slowdown due
to
national and global
economic conditions.
In
January 2010, the Council
on
Revenues, revised its estimates of the
State's General Fund tax growth rate to a negative 2.5%
in
fiscal 2010, 7.6%
in
fiscal 2011,
and 6.0%
in
fiscal 2012. Due to extraordinary financial circumstances concerning the State
budget, the Governor has restricted authorized spending
in
FY
2010
and
has implemented
both layoffs and furloughs to reduce payroll costs. The Governor has required that the
reductions due to layoff and salary furlough adjustments be reflected
in
the General Fund
supplementary budget request for FY 2011. Updated revenue projections will impact the
Governor's budget policy and accordingly, DBEDT's future budget.
15
This is trial version
www.adultpdf.com
Department
of
Business,
Economic
Development and
Tourism
State
of
Hawaii
MANAGEMENT'S DISCUSSION AND ANALYSIS (Continued)
Fiscal Year Ended
June
30, 2009
REQUESTS FOR INFORMATION
Questions concerning any of the information provided
in
this report or requests for additional
financial information should
be
addressed to the Director, Department of Business, Economic
Development and Tourism, P.O. Box 2359, Honolulu, Hawaii 96804. General information
about the DBEDT can
be
found
at
the State's website, aiLgov/dbedt.
16
This is trial version
www.adultpdf.com
Department
of
Business, Economic Development and Tourism
State
of
Hawaii
STATEMENT
OF
NET ASSETS
June 30,2009
ASSETS
Cash
Cash in State Treasury
Cash in bank
Petty cash
Total cash
Receivables
Accounts, net
Loans, net
Due from grantor
Total receivables, net
Investment in venture capital limited partnerships, at cost
Capital assets
Non-depreciable
Depreciable, net
Total assets
LIABILITIES
Liabilities
Vouchers payable
Accrued payroll
Due to other state agencies
Due to State General Fund
Deferred revenues
Accrued claims payable
Accrued compensated absences
Due within one year
Due
in
more than one year
Total liabilities
NET ASSETS
Invested
in
capital assets
Unrestricted
Total net assets
Total liabilities and net assets
See accompanying notes to the basic financial statements.
17
$
34,397,026
1,024,280
29,300
35,450,606
696,975
1,030,554
843,357
2,570,886
8,974,073
3,486,466
46,709,095
50,195,561
$
97,191,126
$
1,404,035
602,922
7,683,566
29,300
2,636,584
1,550,000
673,557
1,615,380
16,195,344
50,195,561
30,800,221
80,995,782
$
97,191,126
This is trial version
www.adultpdf.com
Department
of
Business, Economic Development and Tourism
State
of
Hawaii
STATEMENT OF ACTIVITIES
Fiscal Year Ended June 30, 2009
Program
Revenues
Net
(Expenses)
Operating
Revenue
Charges
for
Grants
and
and
Changes
Functions/Programs
Expenses
Services
Contributions
in
Net
Assets
Governmental
activities:
Natural
Energy
Laboratory
of
Hawaii
Authority
$
12,706,961
$
4,091,918
$
7,297,528
$
(1,317,515)
High
Technology
Development
Corporation
6,188,923
1,319,583
3,394,944
(1,474,396)
Office
of
Planning
3,358,719
1,431,843
(1,926,876)
General
Support
for
Economic
Development
2,757,871
(2,757,871)
Strategic
Industries
5,299,100
153,029
274,140
(4,871,931)
Strategic
Marketing
and
Support
2,332,802
43,624
100,000
(2,189,178)
Economic
Planning
and
Research
for
Economic
Development
3,150,063
1,225,642
(1,924,421
)
Foreign-Trade
Zone
1,808,861
1,575,410
(233,451)
~
Hawaii
Strategic
Development
Corporation
9,504,328
2,903,085
(6,601,243)
ex>
Creative
Industries
2,169,773
(2,169,773)
Land
Use
Commission
490,430
(490,430)
Aloha
Tower
Development
Corporation
3,121,950
1,344,438
(1,777,512)
Capital
Outlays
581,185
(581,185)
Total
govemmental
activities
$
53,470,966
$
11,431,087
$
13,724,097
(28,315,782)
General
revenues:
State-allotted
appropriations,
net
of
reversions
and
lapses
18,461,274
Nonimposed
employee
fringe
benefits
2,886,010
Net
investment
loss
(641,984)
Lapsed
appropriations
related
to
previous
fiscal
years
(725,300)
Total
general
revenues
19,980,000
Transfers
(1,843,162)
Change
in
net
assets
(10,178,944)
Net
assets
at
July
1,
2008
91.174,726
Net
assets
at
June
30,
2009
$
80,995,782
See
accompanying
notes
to
the
basic
financial
statements.
This is trial version
www.adultpdf.com
Department
of
Business,
Economic
Development
and
Tourism
State
of
Hawaii
BALANCE SHEET
GOVERNMENTAL FUNDS
June
30, 2009
Economic
Development
Special
Capital
General
Revenue
Projects
Total
ASSETS
Cash
in
State
Treasury
$
2,843,066
$
22,748,041
$
8,805,919
$
34,397,026
Cash
in
bank
1,024,280
1,024,280
Petty
cash
8,500
20,800
29,300
Receivables:
Accounts,
net
696,975
696,975
Loans,
net
1,020,565
9,989
1,030,554
Due
from
grantor
843,357
843,357
Investment
in
venture
capital
limited
partnerships,
at
cost
8,974,073
8,974,073
Total
assets
$
3,872,131
$
34,317,515
$
8,805,919
$
46,995,565
LIABILITIES
AND
FUND
BALANCES
LIABILITIES
Vouchers
payable
$
481,662
$
922,373
$
$
1,404,035
Accrued
payroll
274,008
328,914
602,922
Due
to
other
state
agencies
7,683,566
7,683,566
Due
to
State
General
Fund
8,500
20,800 29,300
Deferred
revenues
2,636,584
2,636,584
Total
liabilities
764,170
11,592,237
12,356,407
FUND
BALANCES
Reserved
for
encumbrances
2,087,396
17,814,994
353,443
20,255,833
Reserved
for
capital
projects
8,452,476
8,452,476
Reserved
for
other
purposes
110,053
110,053
Unreserved
1,020,565
4,800,231
5,820,796
Total
fund
balances
3,107,961
22.725,278
8,805,919
34,639,158
Total
liabilities
and
fund
balances
$
3,872,131
$
34,317,515
$
8,805,919
$
46,995,565
See accompanying notes to the basic financial statements.
19
This is trial version
www.adultpdf.com
Department
of
Business,
Economic
Development
and
Tourism
State
of
Hawaii
RECONCILIATION OF THE GOVERNMENTAL FUNDS BALANCE SHEET
TO THE STATEMENT OF NET ASSETS
June
30, 2009
Total fund balances - governmental funds
$
34,639,158
Amounts reported
for
governmental activities in the
statement
of
net assets are different because:
Capital assets used in governmental activities are not
financial resources and, therefore, are not reported
in the governmental funds.
Governmental capital assets
$
89,456,611
Less accumulated depreciation
(39,261,050)
50,195,561
Accrued compensated absences liability is not due in
the current period and, therefore, is not reported
in the governmental funds.
(2,288,937)
Claims payable is not due in the current period and,
therefore, is not reported in the governmental funds.
(1,550,000)
Net assets
of
governmental activities $
80,995,782
See accompanying notes to the basic financial statements.
20
This is trial version
www.adultpdf.com
Department
of
Business,
Economic
Development
and
Tourism
State
of
Hawaii
STATEMENT OF REVENUES, EXPENDITURES, AND CHANGES
IN
FUND BALANCES
GOVERNMENTAL FUNDS .
Fiscal
Year Ended
June
30, 2009
Economic
Development
Special
Capital
General
Revenue
Projects
Total
REVENUES
Charges
for
current
services
$
$
11,431,087
$
$
11,431,087
Intergovernmental
13,724,097
13,724,097
State-allotted
appropriations,
net
of
reversions
and
lapses
9,575,974
8,160,000
17,735,974
Nonimposed
employee
fringe
benefits
2,886,010
2,886,010
Net
investment
loss
59.844
(701,828)
(641,984)
12,521,828
24,453,356
8,160,000
45,135,184
EXPENDITURES
Natural
Energy
Laboratory
of
Hawaii
Authority
357,669
10,498,430
10,856,099
Office
of
Planning
1,896,483
1,449,050
3,345,533
High
Technology
Development
Corporation
1,130,903
4,292,220
5,423,123
Strategic
Industries
3,248,143
1,999,069
5,247,212
General
Support
for
Economic
Development
3,051,207
3,051,207
Economic
Planning
and
Research
for
Economic
Development
1,665,302
1,449,018
3,114,320
Strategic
Marketing
and
Support
1,920,310
401,934
2,322,244
Hawaii
Strategic
Development
Corporation
4,650,000
4,878,868
9,528,868-
-
Foreign-Trade
Zone
1,701,581
1,701,581
Creative
Industries
1,565,144
1,565,144
Land
Use
Commission
509,531
509,531
Aloha
Tower
Development
Corporation
1,571,950
1,571,950
Capital
outlays
581,185 581,185
19,994,692
28,242,120
581,185
48,817,997
EXCESS
OF
REVENUES
OVER
(UNDER)
EXPENDITURES
(7,472,864)
(3,788,764)
7,578,815
(3,682,813)
OTHER
FINANCING
SOURCES
(USES)
Transfers
out
(215,000)
(1,628,162)
(1,843,162)
(215,000)
(1,628,162)
(1,843,162)
NET
CHANGE
IN
FUND
BALANCES
(7,687,864)
(5,416,926)
7,578,815
(5,525,975)
FUND
BALANCES
AT
JULY
1,
2008
10,795,825
28,142,204
1,227,104
40,165,133
FUND
BALANCES
AT
JUNE
30,
2009
$
3,107,961
$
22,725,278
$
8,805,919
$
34,639,158
See accompanying notes to the basic financial statements.
21
This is trial version
www.adultpdf.com
Department
of
Business,
Economic
Development
and
Tourism
State
of
Hawaii
RECONCILIATION OF THE CHANGE IN FUND BALANCE OF
GOVERNMENTAL FUNDS TO THE STATEMENT OF ACTIVITIES
Fiscal
Year
Ended
June
30, 2009
Net change in fund balances - total governmental funds
Amounts reported
for
governmental activities in the
statement
of
activities are different because:
Governmental funds report capital outlays as expenditures,
however, in the statement
of
activities, the cost
of
those
assets are depreciated over their estimated useful lives as
depreciation expense. This is the amount by which
capital outlays exceeded depreciation
in
the current period
Change
in
long-term compensated absences reported in the
statement
of
activities do not require the use
of
current
financial resources and therefore are not reported as
expenditures in governmental funds.
Claims payable reported
in
the statement
of
activities do not
require the use
of
current financial resources and therefore
are not reported as expenditures in the governmental funds.
$
(5,525,975)
(3,071,907)
(31,062)
(1,550,000)
Change in net assets
of
governmental activities
See accompanying notes to the basic financial statements.
22
$ (10,178,944)
This is trial version
www.adultpdf.com
Department
of
Business,
Economic
Development
and
Tourism
State
of
Hawaii
STATEMENT OF REVENUES AND EXPENDITURES - BUDGET AND ACTUAL
GENERAL AND ECONOMIC DEVELOPMENT SPECIAL REVENUE FUNDS
Fiscal
Year
Ended
June
30, 2009
General
Fund
Economic
Development
Special
Revenue
Fund
Actual
on
Variance
Actual
on
Variance
Original
Final
budgetary
favorable
Original
Final
budgetary
favorable
budget
budget
basis
(unfavorable)
budget budget
basis
(unfavorable)
REVENUES
State-allotted
appropriations,
net
of
reversions
and
lapses
$
10,991,697
$
11,621,434
$
9,794,225
$
(1,827,209)
$
$
-
$
$
Other
52,515,460
83,156,719
22,308,445
(60,848,274)
l'V
10,991,697
11,621,434
9,794,225
(1,827,209)
52,515,460
83,156,719
22,308,445
(60,848,274)
w
EXPENDITURES
Natural
Energy
Laboratory
of
Hawaii
Authorit)
365,000
365,000
357,669
7,331
12,277,635
25,229,965
13,630,026 11,599,939
High
Technology
Development
Corporation
1,068,465
1,047,539
964,800
82,739
8,876,482
11,318,250
3,475,328
7,842,922
Office
of
Planning
1,681,322
1,704,754
1,275,615
429,139
5,336,671
6,847,228
1,086,156
5,761,072
Aloha
Tower
Development
Corporation
3,030,554
3,876,497
1,628,477
2,248,020
Strategic
Industries
1,273,579
1,269,174 1,065,102
204,072
4,363,397
13,393,459
4,370,547
9,022,912
General
Support
for
Economic
Development
1,648,994
2,384,525 2,163,699
220,826
Economic
Planning
and
Research
for
Economic
Development
1,341,287
1,382,312
1,091,982
290,330
1,575,737
2,876,357
966,543
1,909,814
Foreign-Trade
Zone
2,010,341
2,417,717
1,725,949
691,768
Strategic
Marketing
and
Support
1,828,212
1,724,729
1,464,950
259,779
2,071,915 2,239,362
210,946
2,028,416
Land
Use
Commission
491,668
509,731
398,891
110,840
Hawaii
Strategic
Development
Corporation
12,972,728 14,957,884
8,827,740
6,130,144
Creative
Industries
1,293,170
1,233,670 1,011,517
222,153
10,991,697
11,621,434
9,794,225
1,827,209
52,515,460
83,156,719
35,921,712
47,235,007
EXCESS
OF
REVENUES
OVER
(UNDER)
EXPENDITURES
$
$
$
$
$
-
$
-
$
(13,613,267)
$
(13,613,267)
See accompanying notes to the basic financial statements.
This is trial version
www.adultpdf.com
Department
of
Business,
Economic
Development
and
Tourism
State
of
Hawaii
STATEMENT OF ASSETS AND LIABILITIES
AGENCY FUNDS
June
30, 2009
ASSETS
Cash and other assets held
in
trust
$
250,250
Total assets
$
250,250
LIABILITIES
Deposits payable
$
250,250
Total liabilities
$
250,250
See accompanying notes to the basic financial statements.
24
This is trial version
www.adultpdf.com