Biosensors Emerging Materials and Applications Part 13 docx
Bạn đang xem bản rút gọn của tài liệu. Xem và tải ngay bản đầy đủ của tài liệu tại đây (2.21 MB, 40 trang )
P450-Based Nano-Bio-Sensors for Personalized Medicine
471
CYP
species
Drugs Description Reduction
potential (vs
Ag/AgCl)
Reference
CYP1A2
Clozapine
Ftorafur
Antipsychotic for
schizophrenia
Anticancer
-265mV
-430mV
(Antonini et al.,
2003)
*
CYP2B4
Aminopyrine
Benzphetamine
Analgesic, anti-
inflammatory and
antipyretic
Anorectic
-400mV
-250mV
(Shumyantseva et
al., 2004)
(Shumyantseva et
al., 2007)
CYP2B6
Bupropion
Cyclophospha
mide
Ifosfamide
Lidocaine
Antidepressant
Anticancer and
immunosuppressive
Anticancer and
immunosuppressive
Anesthetic and
antiarrhythmic
-450mV
-450mV
-430mV
-450mV
(Liu et al., 2008)
(Liu et al., 2008)
*
(Peng et al., 2008)
CYP2C9
Diclofenac
S-Warfarin
Sulfaphenazole
Tolbutamide
Torsemide
Analgesic and anti-
inflammatory
Anticoagulant
Antibacterial
Stimulator for insulin
secretion (treatment of
type II diabetes)
Diuretic
-41mV
-36mV
-41mV
-37mV
-19mV
(Johnson et al., 2005)
(Johnson et al., 2005)
(Johnson et al., 2005)
(Johnson et al., 2005)
(Johnson et al., 2005)
CYP2D6
Fluoxetine
Sertaline
Antidepressant
Antidepressant
-327mV
-275mV
(Iwuoha, Wilson,
Howel, Mathebe,
Montane-Jaime,
Narinesingh,
Guiseppi-Elie, 2000)
(Iwuoha et al., 2007)
CYP2E1
P-Nitrophenol Intermediate in the
synthesis of paracetamol
-300mV (Fantuzzi et al.,
2004)
CYP3A4
Cyclophospha
mide
Erythromycin
Anticancer and
immunosuppressive
Antibiotic
-450mV
-625mV
*
(Hendricks et al.,
2009)
Biosensors – Emerging Materials and Applications
472
Ifosfamide
Indinavir
Midazolam
Quinidine
Progesterone
Verapamil
Anticancer and
immunosuppressive
Anti-HIV
Anxiolytic, anaesthetic,
sedative, anticonvulsant,
and muscle relaxant
Beta blocker
Steroid hormone
For the treatment of
hypertension, angina
pectoris, cardiac
arrhythmia
-435mV
-750mV
-
-
-
-100mV
*
(Ignaszak et al.,
2009)
(Joseph et al., 2003)
(Joseph et al., 2003)
(Joseph et al., 2003)
(Joseph et al., 2003)
* Measurements obtained in studies performed by the authors, immobilizing CYPs isoforms onto
carbon nanotubes.
Table 3. List of CYPs used for the detection of drugs for common diseases and their
reduction potential obtained with cyclic voltammetry technique.
analysis of reduction peaks obtained in the cyclic-voltammograms. The electron transfer can
be enhanced by electrodes nanostructuring, as using metallic or zirconium dioxide
nanoparticles, carbon-nanotubes (Bistolas et al., 2005; Eggins, 2003), or other techniques for
the enzyme immobilization onto the electrode surface, which have been already explained
in the previous pharagraph. Different studies demonstrated that carbon-nanotubes
(schematized in figure 20) promote the electron transfer between the CYP active site and the
electrode and enhance biosensor sensitivity (Lyons & Keeley, 2008; Wang, 2005). In table 3 a
list of a target drugs which have been detected with several CYP isoforms used as biological
recognition element of biosensors is reported.
So, the cytochromes P450 may be used to detect drug compounds commonly used in
medical treatments by using nanoparticles or carbon nanotubes for improving the device
sensitivity to reach the therapeutic ranges found in the patients’ serum. Since for the
treatments some of the most common diseases, as in anti-cancer therapies, more than one drug
are administrated contemporaneously, an array-based biosensor able to measure multiple-
drug concentrations at the same time, by using different CYP isoforms, would be very useful
and it would find several practical applications. The development of such as biosensor has to
overcome several difficulties, first of all the fact that each cytochrome P450 isoform detects
many drugs and that different isoforms can detect the same drug (Carrara et al., 2009).
5.2.1 Carbon Nanotube (CNTs)
CNTs can be described as sp
2
carbon atoms arranged in graphitic sheets wrapped into
cylinders and can have lengths ranging from tens of nanometers to several microns
(Lyons & Keeley, 2008). CNTs can display metallic, semiconducting and superconducting
P450-Based Nano-Bio-Sensors for Personalized Medicine
473
electron transport, possess a hollow core suitable for storing guest molecules and have the
largest elastic modulus of any known material. CNTs can be made by chemical vapour
deposition, carbon arc methods, or laser evaporation (Wang, 2005) and can be divided
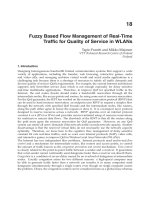
into single-walled carbon-nanotubes and multi-walled carbon-nanotubes (see figure 21).
Single-walled carbon nanotubes (SWCNTs) provide good chemical stability, mechanical
strength and a range of electrical conductivity. They are around ten times stronger and six
times lighter than steel and they can behave as metals, semiconductors or insulators
depending on their chirality and diameter (Lyons & Keeley, 2008). The chirality of the
SWNT is related to the angle at which the graphene sheets are rolled up (Gooding, 2005).
It has been also demonstrated (Gooding, 2005) that the conductivity properties of SWNTs
can depend by the presence of catalytic particles, deriving from the fabrication process,
the presence of defects in their chemical structure, ion-doping and side-wall
functionalizations.
Fig. 21. MWCNT and SWCNT (obtained with Nanotube Modeler © JCrystalSoft, 2010).
Due to their high surface energies, SWCNTs are usually found in bundles or small
aggregates composed of 10-100 tubes in parallel and in contact with each other. Multi-
walled carbon nanotubes (MWCNTs) are composed of several layers of concentric graphitic
cylinders. They are regarded entirely as metallic conductors, making them more suitable for
electrochemical applications (Lyons & Keeley, 2008). Anyway, thanks to their
electrochemical properties, both multi and single-walled carbon nanotubes could be
excellent candidates for the nanostructuration of electrodes used in amperometric biosensor
devices. Pre-treatments of CNTs before their deposition onto electrode surfaces, cause the
formation of open-ended tubes with oxygenated functional groups, crucial for the
electrochemical properties of CNTs. Because of the hydrophobicity due to the CNT walls, in
aqueous solution or in polar solvents the tubes have a tendency to rapidly coagulate. Thus,
dispersing tubes is usually performed in non-polar organic solvents such as in
dimethylformamide (DMF) or chloroform, or with the aid of surfactants or polymers, such
as Nafion. The difficulty in dispersing nanotubes in aqueous solution though has been used
SWCNT
MWCNT
Biosensors – Emerging Materials and Applications
474
as an advantage in preparing nanotube modified electrodes where nanotubes dispersed in
an organic solvent are dropped onto an electrode surface and the solvent allowed
evaporating. It has been demonstrated that this kind of CNT deposition allows the
nanotubes to be strongly adsorbed onto the electrode surface (Gooding, 2005).
5.2.1.1 Electron transfer CNTs-protein
The best strategy for successful enzyme biosensor fabrication is to devise a configuration by
which electrons can directly transfer between the redox center of the enzyme and the
underlying electrode. This is achievable because the physical adsorption or covalent
immobilization of enzymes onto the surface of immobilized carbon nanotubes allows a
direct electrical communication between the electrode and the active site of redox-active
enzymes. It has been reported (Wang, 2005) that a redox enzyme, such as the glucose
oxidase or cytochrome P450, adsorbs preferentially to edge-plane sites on nanotubes. Such
sites contain a significant amount of oxygenated functionalities such as hydroxyl groups
or carboxylic moieties formed during the purification of CNT, which provide sites for
covalent linking of CNT to biorecognition elements (or other materials) or for their
integration onto polymer surface structures (Wang, 2005). Other oxygenated moieties,
useful for the protein immobilization, can be also formed by the breaking of carbon-
carbon bonds at the nanotube ends and at defect sites present on the side-walls. The
nanotubes and enzyme molecules are of similar dimensions, which facilitate the
adsorption of the enzyme without significant loss of its shape or catalytic function. It is
thought that the nanotube directly reaches the prosthetic group such that the electron
tunnelling distance is minimized. In this way, loss of biochemical activity and protein
denaturation are prevented (Lyons & Keeley, 2008).
5.2.1.2 Nanostructuring electrode surfaces with carbon nanotubes
There have been a number of approaches to randomly distributing the CNTs on electrodes
by dispersing the nanotubes with a binder such as dihexadecyl-hydrogen phosphate or
Nafion, forming the nanotube equivalent of a carbon paste which can be screen printed,
forming a nanotube-teflon composite, drop coating onto an electrode without any binders,
preparing a nanotubes paper as the electrode and abrasion onto the basal planes of pyrolytic
graphite. The resultant electrode has randomly distributed tubes with no control over the
alignment of the nanotubes. To better control the alignment of nanotubes a more versatile
approach to producing aligned carbon nanotube arrays is by self-assembly, by using self-
assembled monolayers (after the functionalization of the carboxylic-ends of CNTs with
carbodiimide groups and thiols), or by directly growing of aligned nanotubes onto the
surface. To do this plasma enhanced chemical vapor deposition using a nickel catalyst on a
chromium coated silicon wafer can be used (Gooding, 2005). Advantages in using this
method are the robustness of these electrodes and also the control over the density of the
CNT film by controlling the distribution of the catalyst on the surface (Salimi et al., 2005).
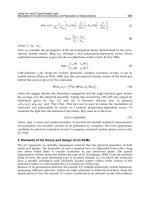
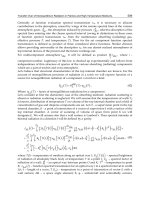
Figure 22 reports a comparison between SEM images of MWCNTs (on the bottom) and
MWCNTs covered by 1 layer of CYP3A4 (on the top). The CNTs has been deposited by drop
casting technique onto the electrode surface (30μL of a solution 1mg/ml of MWCNTs in
chloroform). In the figure is visible the increase of apparent CNTs diameter due to the
presence of a layer of CYP3A4 (on the top), that has been deposited by drop casting onto the
CNT-surface.
P450-Based Nano-Bio-Sensors for Personalized Medicine
475
Fig. 22. Comparison between SEM images of MWCNTs (on the bottom) and MWCNTs
covered by 1 layer of CYP3A4 (on the top), both at 80,000X of magnification.
5.2.1.3 Enhancement of catalytic current with CNTs
The chemical modification of electrode surfaces with carbon nanotubes has enhanced the
activity of electrode surfaces with respect to the catalysis of biologically active species such
as hydrogen peroxide, dopamine and NADH. Furthermore, multi-walled carbon nanotubes
have exhibited good electronic communication with redox proteins where not only the
redox center is close to the protein surface such as in Cytochrome c (Zhao et al., 2005) and
horseradish peroxidase, but also when it is deeply embedded within the glycoprotein such
as is found with glucose oxidase (Gooding, 2005). A recent study (Carrara et al., 2008)
demonstrated the enhancement of the catalytic current in a P450-based enzyme sensor in the
case of electrodes modified with MWCNT, with respect to the case of both the bare
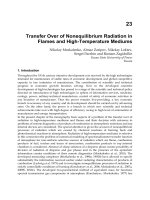
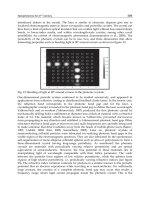
electrodes and the electrode modified with gold nanoparticles. In figure 23, a comparison
between cyclic voltammograms of screen-printed bare electrode (1), electrode modified with
Biosensors – Emerging Materials and Applications
476
Au nanoparticles and CYP11A1 (2) and with MWCNTs and CYP11A1 (3) is reported. In
these voltammograms, a huge increase of the current peak is observable in the case of the
P450 working electrode modified with gold nanoparticles respect to the bare electrode, but a
further enhancement of the peak current is clearly visible in the case of MWCNTs-modified
electrode with P450 (Carrara et al., 2008).
Fig. 23. Cyclic voltammograms of screen-printed bare electrode (1), electrode modified with
Au nanoparticles and CYP11A1 (2) and with MWCNTs and CYP11A1 (3), (Carrara et al.,
2008). Reprinted from Biosensors and Bioelectronics, Vol. 24, Sandro Carrara, Victoria V.
Shumyantseva, Alexander I. Archakov, Bruno Samorì, “Screen-printed electrodes based on
carbon nanotubes and cytochrome P450scc for highly sensitive cholesterol biosensors”,
Pages No. 148–150, Copyright (2008), with permission from Elsevier.
This is the direct proof that the CNT improve the electron transfer between the electrodes
and the heme groups of the cytochromes. Moreover, in the presence of MWCNT, the peak is
shifted in the positive direction of the voltage axis, because P450 is easier reduced in the
presence of CNT, i.e. it is easier to reduce the heme iron incorporated in the protein core.
6. Conclusions
In this chapter the feasibility of cytochrome P450 as probe molecule for the design of an
electrochemical biosensor for drug detection in biological fluids has been investigated.
Cytochromes P450 have been chosen since they are known to be involved in the metabolism
of over 1,000,000 different xenobiotic and endobiotic liphophilic substrates, in particular in
the metabolism of ∼75% of all drugs. The majority of cytochromes involved in drug
metabolism exhibits a certain genetic polymorphism, i.e. mutations in the CYP genes that
can cause the enzyme activity to be abolished, reduced, altered or increased, with
substantial consequences in drug metabolism, such as an exaggerated and undesirable
pharmacological response. In order to individually optimize an ongoing drug therapy, it is
required to measure the plasma concentrations of drugs or their metabolites after the
P450-Based Nano-Bio-Sensors for Personalized Medicine
477
administration. This is needed for really understand how the patient metabolize drugs at the
moment of the pharmacological cure. It is a strong need since most effective drug therapies
for major diseases still provide benefit only to a fraction of patients, typically in the 20 to
50% range. At the present state-of-the-art the technology allows only to check the genetic
predisposition of patients to metabolize a certain drug, without taking into account the
many factors that can influence drug metabolism, such as lifestyle, drug-drug interactions
and cytochrome P450 daily variation of the polymorphism. Although CYPs are capable in
general of catalyse around 60 different classes of reactions, they have a number of features
in common, such as the overall fold structure, the presence in their active site of the heme
group, that allow the electron transfer to catalyze substrate oxidations and reductions, and
the typical catalytic cycle which requires oxygen and electrons as part of the process of
metabolism.
CYPs ability to metabolize a broad spectrum of endogenous substances, e.g., fatty acids,
steroid hormones, prostaglandins and in particular foreign compounds such as drugs, has
made this enzyme family interesting as recognition element for biosensing. P450-based
biosensors are of great interest due to the possibility of developing applications such as the
detection of analytes and drugs, since the currently-available methods used for in vitro
quantifying the levels of drugs in biological fluids are time-consuming and expensive. A
cytochrome P450 biosensor may be a promising alternative that would provide quick
measurements for drugs and metabolites with a cheap, simple to use, rapid and, in some
instances, disposable equipment, which also supplies good selectivity, accuracy and
sensitivity. The most suitable approach for the design of a CYP-based biosensor is the direct
mediatorless electron supply from an electrode to the redox active group of the CYP, thus
leading a direct flow of electrons to the enzyme. In the development of this mediator-less
approach, the immobilization of CYP onto the electrode surface has to be deeply controlled
in order to obtain a high probability for the protein to be attached to the electrode in a
proper orientation that could optimize the electron transfer to the heme group. In this
chapter different techniques for the immobilization of CYPs onto the electrode surface have
been described as reported in literature, focusing the attention also on the use of
nanostructures (e.g. carbon nanotubes), to improve the biosensor sensitivity.
Finally, a list of drugs which have been detected with several CYP isoforms has been
reported with data found in literature as well as data obtained by the authors. It is possible
to conclude that cytochromes P450 may be used to detect drug compounds also reaching the
therapeutic ranges found in the patients’ blood, thanks to improved performances due to
nanostructured-electrodes. Since for the treatments of some of the most common diseases
(e.g. in anti-cancer therapies), more than one drug are administrated contemporaneously, an
array-based biosensor able to measure multiple-drug concentrations at the same time, by
using different CYP isoforms, would find several practical applications and it could be a
first step toward the development of a real chip for personalized-medicine. Electrode
miniaturization is the next mandatory step in order to test the real feasibility of this
cytochrome-based biosensor as a fully-implantable device for the detection of drugs and
metabolites, as much as the evaluation of the biocompatibility of all chip’s components, with
particular regard to nanostructures and cytochrome citotoxicity. Finally, kinetics studies of
drugs should be carried out in order to better understand drug-drug interaction phenomena
and the reactions between drugs and cytochrome P450, with regard to enzyme heterotropic
kinetics and its effects on drug metabolism.
Biosensors – Emerging Materials and Applications
478
A cytochrome P450-based biochip for drug detection should be a very powerful platform for
personalization of drug therapy thanks to the key role of P450. However, as it has been
shown in this chapter, different P450 isoforms may have the same drug compound as
substrate and different drugs may be substrates of the same P450 protein. Proper strategies
to develop the multiplexing P450-based biosensor arrays must be studied, considering
problems due to multiple enzyme-substrate interactions and in the meanwhile maintaining
high reliability and low cost of experimentation.
7. Acknowledgments
The SNF Sinergia Project, code CRSII2_127547/1 and title “Innovative Enabling Micro-
Nano-Bio-technologies for Implantable systems in molecular medicine and personalized
therapy” financially supported this research.
8. References
Aguey-Zinsou K.F; Bernhardt,P.V.; De Voss, J.J. & Slessor, K.E. Electrochemistry of P450cin:
new insights into P450 electron transfer. Chem. Commun. Vol.(2003), pp.418-419
Antonini, M.; Ghisellini, P.; Pastorino, L.; Paternolli, C. & Nicolini, C. (2003). Preliminary
electrochemical characterisation of cytochrome P4501A2-clozapine interaction. IEE
ProC Nanobiotechnol. Vol.150, (June 2003), No.1
Armstrong, F.A. & Wilson, G.S. (2000). Recent developments in faradaic
bioelectrochemistry. Electrochimica Acta. Vol.45, (2000), pp. 2623–2645
Atkins, W. (2005). Non Michaelis Menten Kinetics in Cytochrome P450-Catalized Reactions.
Ann Rev Pharmacol Toxicol. Vol.45, (2005), pp 291-310
Bistolas, N.; Wollenberger, U.; Jung, C. & Scheller, F.W. (2005). Cytochrome P450
biosensors—a review. Biosensors and Bioelectronics. Vol.20, (2005), pp. 2408–2423
Carrara, S.; Cavallini, A.; Garg, A. & De Micheli, G. (2009). Dynamical Spot Queries to
Improve Specificity in P450s based Multi-Drugs Monitoring. Conference Proceedings
of IEEE CME2009, Tempe (US), 9-11, April, 200
Carrara, S.; Shumyantseva, V.V.; Archakov, A.I. & Samorì, B. (2008). Screen-printed
electrodes based on carbon nanotubes and cytochrome P450scc for highly sensitive
cholesterol biosensors. Biosensors and Bioelectronics. Vol.24, (2008), pp. 148–150
Cavallini, A.; Carrara, S.; De Micheli, G. & Erokhin, V. (2010). P450-mediated
electrochemical sensing of drugs in human plasma for personalized therapy. Ph.D.
Research in Microelectronics and Electronics (PRIME), 2010 Conference on , pp.1-4, ISBN
978-1-4244-7905-4, Berlin, Germany, July, 18-21, 2010
Coleman, M.D. (2010). Human drug metabolism – An Introduction (ed.2). Wiley-Blackwell.
Denisov, I.G.; Makris, T.M.; Sligar, S.G. & Schlichting, I. (2005). Structure and Chemistry of
Cytochrome P450. Chem. Rev.,Vol.105, (2005), pp. 2253-2277
Eggins, B.R. (2003). Chemical Sensors and Biosensors. Wiley
Estabrook, R.W.; Faulker, K.M.; Shet, M.S. & Fisher, C.W. (1996). Application of
electrochemistry for P450-catalyzed reactions. Methods Enzymol. Vol.272, (1996),
pp.44–51
Estavillo, C.; Lu, Z.; Jansson, I.; Schenkman, J.B. & Rusling, J.F. (2003). Epoxidation of
styrene by human cyt P450 1A2 by thin film electrolysis and peroxide activation
compared to solution reactions. Biophysical Chemistry. Vol.104, (2003), pp. 291–296
P450-Based Nano-Bio-Sensors for Personalized Medicine
479
Fantuzzi, A.; Fairhead, M. & Gilardi, G. (2004). Direct Electrochemistry of Immobilized
Human Cytochrome P450 2E1. Journal of the American Chemical Society. Vol.126,
(2004), No.16, pp. 5040-5041
Freire, R.S.; Pessoa, C.A.; Mello, L.D. & Kubota, L.T. (2003). Direct Electron Transfer: An
Approach for Electrochemical Biosensors with Higher Selectivity and Sensitivity. J.
Braz. Chem. Soc. Vol.14, (2003), No.2, pp. 230-243
Ghindilis, A. (2000). Direct electron transfer catalysed by enzymes: application for biosensor
development. Biochemical Society Transactions. Vol.28, (2000), pp.84–89
Gooding, J.J. (2005). Nanostructuring electrodes with carbon nanotubes: A review on
electrochemistry and applications for sensing. Electrochimica Acta. Vol.50, (2005),
pp.3049–3060
Guengerich, F.P. (2001). Common and Uncommon Cytochrome P450 Reactions Related to
Metabolism and Chemical Toxicity. Chem. Res. Toxicol., Vol.14, (2001), No. 6, pp.
611-650
Guengerich, F.P. (2003). Cytochromes P450, drugs, and diseases. Molecular interventions,
Vol.3, No.3, (2003), pp. 194-204
Guengerich, F.P. (2008). Cytochrome P450 and Chemical Toxicology. Chem. Res. Toxicol.,
Vol.21, (2008), pp. 70–83
He, P.; Hu, N. & Rusling, J.F. (2004). Driving Forces for Layer-by-Layer Self-Assembly of
Films of SiO
2
Nanoparticles and Heme Proteins. Langmuir. Vol.20, (2004), pp.722-
729
Hendricks, N.; Waryo, T.T.; Arotiba, O.; Jahed, N.; Baker, P.G.L. & Iwuoha, E.I. (2009).
Microsomal cytochrome P450-3A4 (CYP3A4) nanobiosensor for the determination
of 2,4-dichlorophenol—An endocrine disruptor compound. Electrochimica Acta.
Vol.54, (2009), No.7, pp. 1925-1931
Honeychurch, M. (2006). The direct electrochemistry of cytochrome P450. What are we
actually measuring?. , (2006)
Houston, B. & Galetin, A. (2005). Modelling atypical CYP3A4 kinetics: principles and
pragmatism. Archives of Biochemistry and Biophysics, Vol.433, (2005), pp 351-360
Huang, N.; Agrawal, V.; Giacomini, K.M. & Miller, W.L. (2008). Genetics of P450
oxidoreductase: Sequence variation in 842 individuals of four ethnicities and
activities of 15 missense mutations. PNAS. Vol.105, (2008), No.5, pp. 1733-1738
Ignaszak, A.; Hendricks, N.; Waryo, T.; Songa, E.; Jahed, N.; Ngece, R.; Al-Ahmed, A.;
Kgarebe, B.; Baker, P. & Iwuoha, E.I. (2009). Novel therapeutic biosensor for
indinavir—A protease inhibitor antiretroviral Drug. Journal of Pharmaceutical and
Biomedical Analysis. Vol.49, (2009), pp.498–501
Ingelman-Sundberg, M. (2004). Human drug metabolising cytochrome P450 enzymes:
properties and polymorphisms. Naunyn-Schmiedeberg’s Arch Pharmacol.,Vol.369,
(2004), pp. 89–104
Iwuoha, E.I.; Joseph, S.; Zhang, Z.; Smyth, M.R.; Fuhr, U. & Ortiz de Montellano, P.R. (1998).
Drug metabolism biosensors: electrochemical reactivities of cytochrome P450cam
immobilised in synthetic vesicular systems. Journal of Pharmaceutical and Biomedical
Analysis. Vol.17, (1998), pp. 1101–1110
Iwuoha, E.I.; Kane, S.; Ania, C.O.; Smyth, M.R.; Ortiz de Montellano, P.R & Fuhr, U.
(2000). Reactivities of Organic Phase Biosensors 3: Electrochemical Study of
Biosensors – Emerging Materials and Applications
480
Cytochrome P450cam Immobilized in a Methyltriethoxysilane Sol-Gel.
Electroanalysis. Vol.12, (2000), No.12, pp.980-98
Iwuoha, E.I.; Ngece, R.; Klink, M. & Baker, P. (2007). Amperometric responses of CYP2D6
drug metabolism nanobiosensor for sertraline: a selective serotonin reuptake
inhibitor. IET Nanobiotechnology. Vol.1, (2007), No.4, pp. 62-67
Iwuoha, E.I.; Wilson, A.; Howel, M.; Mathebe, N.G.R.; Montane-Jaime, K.; Narinesingh, D. &
Guiseppi-Elie, A. (2000). Cytochrome P4502D6 (CYP2D6) Bioelectrode for
Fluoxetine. Analytical Letters. Vol.37, (2000), No.5, pp. 929–941
Johnson, D.L.; Lewis, B.C.; Elliot, D.J.; Miners, J.O. & Martin, L.L. (2005). Electrochemical
characterisation of the human cytochrome P450 CYP2C9. Biochemical
Pharmacology. Vol.69, (2005), pp. 1533–1541
Joseph, S.; Rusling, J.F.; Lvov, Y.M.; Friedberg, T. & Fuhr, U. (2003). An amperometric
biosensor with human CYP3A4 as a novel drug screening tool. Biochemical
Pharmacology. Vol.65, (2003), pp.1817–1826
Kirchheiner, J. & Seeringer, A. (2007). Clinical implications of pharmacogenetics of
cytochrome P450 drug metabolizing enzymes. Biochimica et Biophysica Acta.
Vol.1770, (2007), pp.489–494
Krishnan, S.; Abeykoon, A.; Schenkman, J.B. & Rusling, J.F. (2009). Control of
Electrochemical and Ferryloxy Formation Kinetics of Cyt P450s in Polyion Films by
Heme Iron Spin State and Secondary Structure. J. Am. Chem. Soc. Vol.131, (2009),
pp.16215–16224
Lazarou, J.; Pomeranz, B.H. & Corey, P.N. (1998). Incidence of Adverse Drug Reactions in
Hospitalized Patients. JAMA. Vol. 279, (1998); No.15, pp 1200-1205
Lei, C.; Wollenberger, U.; Jung, C. & Scheller,F.W. (2000). Clay-Bridged Electron Transfer
between Cytochrome P450cam and Electrode. Biochemical and Biophysical
Research Communications. Vol.268, (2000), pp. 740–744
Lin, J.H. (2007). Pharmacokinetic and Pharmacodynamic Variability: A Daunting Challenge
in Drug Therapy. Current Drug Metabolism. Vol.8, (2007), pp. 109-136
Liu, S.; Peng, L.; Yang, X.; Wu, Y. & He, L. (2008). Electrochemistry of cytochrome P450
enzyme on nanoparticle-containing membrane-coated electrode and its
applications for drug sensing. Analytical Biochemistry. Vol.375, (2008), pp. 209–216
Liu, H.; Rusling, J.F. & Hu, N. (2004). Electroactive Core-Shell Nanocluster Films of Heme
Proteins, Polyelectrolytes, and Silica Nanoparticles. Langmuir. Vol.20, (2004),
pp.10700-10705
Lyons, M.E.G. & Keeley, G.P. (2008). Carbon Nanotube Based Modified Electrode
Biosensors. Part 1.Electrochemical Studies of the Flavin Group Redox Kinetics at
SWCNT/Glucose Oxidase Composite Modified Electrodes. Int. J. Electrochem. Sci.
Vol.3, (2008), pp.819–853
Miller, W.L. (2005). Minireview: Regulation of Steroidogenesis by Electron Transfer.
Endocrinology. Vol. 146, (2005), pp.2544-2550
Munge, B.; Estavillo, C.; Schenkman, J.B. & Rusling, J.F. (2003). Optimization of
Electrochemical and Peroxide-Driven Oxidation of Styrene with Ultrathin Polyion
Films Containing Cytochrome P450cam and Myoglobin. ChemBioChem, Vol.4,
(2003), pp. 82-89
P450-Based Nano-Bio-Sensors for Personalized Medicine
481
Nicolini, C.; Erokhin, V.; Ghisellini, P.; Paternolli, C.; Ram, M.K. & Sivozhelezov, V. (2001).
P450scc Engineering and Nanostructuring for Cholesterol Sensing. Langmuir.
Vol.17, (2001), pp.3719-3726
Ortiz de Montellano, P.R. (2005). Cytochrome P450, Kluwer Academic/Plenum Publishers,
New York.
Paternolli, C.; Antonini, M.; Ghisellini, P. & Nicolini, C. (2004). Recombinant Cytochrome
P450 Immobilization for Biosensor Applications. Langmuir. Vol.20, (2004), pp.11706-
11712
Peng, L.; Yang, X.; Zhang, Q. & Liu, S. (2008). Electrochemistry of Cytochrome P450 2B6 on
Electrodes Modified with Zirconium Dioxide Nanoparticles and Platin
Components. Electroanalysis. Vol.20, (2008), No.7, pp.803–807
Podust, L.M.; Poulos, T.L. & Waterman, M.R. (2001).Crystal structure of cytochrome P450
14α-sterol demethylase (CYP51) from Mycobacterium tuberculosis in complex with
azole inhibitors. Vol.98, (2001), No.6, pp. 3068-3073
Renedo, O.D.; Alonso-Lomillo, M.A. & Arcos Martinez, M.J. (2007). Recent developments in
the field of screen-printed electrodes and their related applications. Vol.73, (2007),
No.2, pp. 202-219
Rodriguez-Antona, C. & Ingelman-Sundberg, M. (2006). Cytochrome P450
pharmacogenetics and cancer. Oncogene. Vol.25, (2006), pp. 1679–1691
Salimi, A.; Noorbakhsh, A. & Ghadermarz, M. (2005). Direct electrochemistry and
electrocatalytic activity of catalase incorporated onto multiwall carbon nanotubes-
modified glassy carbon electrode. Analytical Biochemistry. Vol.344, (2005), pp.16–
24
Sevrioukova, I.F.; Li, H.; Zhang, H.; Peterson, J.A. & Poulos, T.L. (1999). Structure of a
cytochrome P450–redox partner electron-transfer complex. PNAS. Vol.96, (1999),
No.5, pp.1863-1868
Shukla, A.; Gillam, E.M.; Mitchell, D.J. & Bernhardt, P.V. (2005). Direct electrochemistry of
enzymes from the cytochrome P450 2C family. Electrochemistry Communications.
Vol.7, (2005), pp.437–442
Shumyantseva, V.V.; Bulko, T.V. & Archakov, A.I. (2005). Electrochemical reduction of
cytochrome P450 as an approach to the construction of biosensors and bioreactors.
Journal of Inorganic Biochemistry, Vol.99, (2005), pp. 1051–1063
Shumyantseva, V.V.; Bulko, T.V.; Bachmann, T.T.; Bilitewski, U.; Schmid, R.D. & Archakov,
A.I. (2000). Electrochemical Reduction of Flavocytochromes 2B4 and 1A2 and Their
Catalytic Activity. Archives of Biochemistry and Biophysics. Vol.377, (2000), pp.43–48
Shumyantseva, V.V.; Bulko, T.V.; Kuznetsova, G.P.; Samenkova, N.F. & Archakov, A.I.
(2009). Electrochemistry of Cytochromes P450: Analysis of Current–Voltage
Characteristics of Electrodes with Immobilized Cytochromes P450 for the Screening
of Substrates and Inhibitors. Biochemistry. Vol.74, (2009), No.4, pp. 438-444.
Shumyantseva, V.V.; Bulko, T.V.; Usanov, S.A.; Schmid, R.D.; Nicolini, C. & Archakov, A.I.
(2001). Construction and characterization of bioelectrocatalytic sensors based on
cytochromes P450. Journal of Inorganic Biochemistry. Vol.87, (2001), pp.185–190
Shumyantseva, V.V.; Bulko, T.V.; Yu.O.; Rudakov, G.P.; Kuznetsova, N.F.; Samenkova, A.V.;
Lisitsa, I.I.; Karuzina, & Archakov, A.I. (2007). Electrochemical properties of
cytochroms P450 using nanostructured electrodes: Direct electron transfer and
electro catalysis. Journal of Inorganic Biochemistry
. Vol.101, (2007), pp.859–865
Biosensors – Emerging Materials and Applications
482
Shumyantseva, V.V.; Carrara, S.; Bavastrello, V.; Riley, D.J.; Bulko, T.V.; Skryabin, K.G.;
Archakov, A.I. & Nicolini, C. (2005). Direct electron transfer between cytochrome
P450scc and gold nanoparticles on screen-printed rhodium–graphite electrodes.
Biosensors and Bioelectronics. Vol.21, (2005), pp.217–22
Shumyantseva, V.V.; Ivanov, Y.D.; Bistolas, N.; Scheller, F.W.; Archakov, A.I. &
Wollenberger, U. (2004). Direct Electron Transfer of Cytochrome P450 2B4 at
Electrodes Modified with Nonionic Detergent and Colloidal Clay Nanoparticles.
Analytical Chemistry. Vol.76, (2004), No.20, pp. 6046–6052
Sligar, S.G. (1976). Coupling of spin, substrate, and redox equilibriums in cytochrome P450.
Biochemistry. Vol.15, (1976), No.24, pp. 5399–5406
Sono, M.; Roach, M. P.; Coulter, E.D. & Dawson, J.H. (1996). Heme-Containing Oxygenases.
Chem. Rev.,Vol.96, (1996), pp. 2841-2887
Thévenot, D.R.; Toth, K.; Durst, R.A. & Wilson, G.S. (2001). Electrochemical Biosensors:
recommended definitions and classification. Analytical Letters. Vol.34, (2001), No.5,
pp. 635-659
Wang, J. (2005). Carbon-Nanotube Based Electrochemical Biosensors: A Review.
Electroanalysis. Vol.17, (2005), No.1, pp. 7-14
Wu, Y. & Hu, S. (2007). Biosensors based on direct electron transfer in redox proteins,
Microchim Acta. Vol.159, (2007), pp. 1–17
Yang, M.; Kabulski, J.L.; Wollenberg, L.; Chen, X.; Subramanian, M.; Tracy, T.S.; Lederman,
D.; Gannett, P.M. & Wu, N. (2009). Electrocatalytic Drug Metabolism by CYP2C9
Bonded to A Self-Assembled Monolayer-Modified Electrode. Drug Metabolism and
Disposition. Vol.37, (2009), No.4, pp. 892–899
Zhao, G.C.; Yin, Z.Z.; Zhang, L. & Wei, X.W. (2005). Direct electrochemistry of cytochrome c
on a multi-walled carbon nanotubes modified electrode and its electrocatalytic
activity for the reduction of H
2
O
2
. Electrochemistry Communications. Vol.7, (2005),
pp.256–260
PDBe Protein Data Bank Europe, Available from
Roche Molecular Diagnostic, Available from
/>.html
22
Development of Potentiometric Urea Biosensor
Based on Canavalia ensiformis Urease
Lívia Maria da Costa Silva
1
, Ana Claudia Sant’Ana Pinto
1
,
Andrea Medeiros Salgado
1
and Maria Alice Zarur Coelho
2
1
Laboratory of Biological Sensors/EQ/UFRJ
2
BIOSE/EQ/UFRJ
Biochemical Engineering Department, Chemistry School,
Technology Center, Federal University of Rio de Janeiro
Brazil
1. Introduction
The increasing number of potentially harmful pollutants in the environment calls for fast
and cost-effective analytical techniques to be used in extensive monitoring programs.
Additionally, over the last few years, a growing number of initiatives and legislative actions
for environmental pollution control have been adopted in parallel with increasing scientific
and social concern in this area (Rogers & Gerlach, 1996; Rodriguez-Mozaz et al., 2004;
Rodriguez-Mozaz et al., 2005; Rogers, 2006). Nitrogen compounds are pollutant found in
several industrial effluents, being its determination of extreme environmental importance.
Several methods are used to urea determination, including spectrophotometry, fluorimetry,
potentiometry and amperometry. But some of these require a pretreatment or are unsuitable
for monitoring in situ. For this reason there has been growing interest in the development of
biosensors for these determinations.
The requirements for application of most traditional analytical methods to environmental
pollutants analysis, often constitute an important impediment for their application on a
regular basis. The need for disposable systems or tools for environmental applications, in
particular for environmental monitoring, has encouraged the development of new
technologies and more suitable methodologies. In this context, biosensors appear as a
suitable alternative or as a complementary analytical tool. Biosensors can be considered as a
subgroup of chemical sensors in which a biological mechanism is used for analyte detection
(Rogers & Gerlach, 1996; Rodriguez-Mozaz et al., 2005; Rogers, 2006).
A biosensor (Figure 1) is defined by the International Union of Pure and Applied Chemistry
(IUPAC) as a self-contained integrated device that is capable of providing specific
quantitative or semi-quantitative analytical information using a biological recognition
element (biochemical receptor), which is retained in contact direct spatial with a
transduction element (Thévenot et al., 1999). Biosensing systems and methods are being
developed as suitable tools for different applications, including bioprocess control, food
quality control, agriculture, environment, military and in particular, for medical
applications. The main classes of bioreceptor elements that are applied in environmental
Biosensors – Emerging Materials and Applications
484
analysis are whole cells of microorganisms, enzymes, antibodies and DNA. Additionally, in
the most of the biosensors described in the literature for environmental applications
electrochemical transducers are used (Thévenot et al., 1999).
Fig. 1. Biosensor scheme.
For environmental applications, the main advantages offered by biosensors over
conventional analytical techniques are the possibility of portability, miniaturization, work
on-site, and the ability to measure pollutants in complex matrices with minimal sample
preparation. Although many of the developed systems cannot compete yet with
conventional analytical methods in terms of accuracy and reproducibility, they can be used
by regulatory authorities and by industry to provide enough information for routine testing
and screening of samples (Rogers & Gerlach, 1996; Rogers, 2006; Sharpe, 2003). Biosensors
can be used as environmental quality monitoring tools in the assessment of
biological/ecological quality or for the chemical monitoring of both inorganic and organic
priority pollutants.
Due to great variety of vegetal tissues Brazil constitutes an inexhaustible enzyme source,
which can be used in the most diverse areas of the knowledge, amongst them in the
development of the biosensors. James B. Sumner (Sumner, 1926) crystallized the enzyme
urease from jack bean, Canavalia ensiformis (Fabaceae), a bushy annual tropical american
legume grown mainly for forage, in 1926, to show the first time ever that enzymes can be
crystallized. Urease is abundant enzyme in plants and, moreover, it can be found at
numerous of eukaryotic microorganisms and bacteria. The bacterial and plant ureases have
high sequence similarity, suggesting that they have similar three-dimensional structures and
a conserved catalytic mechanism.
Ureases (urea amidohydrolase, EC3.5.1.5) catalyzes the hydrolysis of urea to yield ammonia
(NH
3
) and carbamat, the latter compound decomposes spontausly to generate a second
molecule of ammonia and carbon dioxide (CO
2
) (Takishima et al., 1988) (Figure 2).
So, the main objective of this study was to optimize the operating conditions to obtain the
final configuration of the urease biosensor for environmental application.
Development of Potentiometric Urea Biosensor Based on Canavalia ensiformis Urease
485
→
↔
2
2
↔2
2
Fig. 2. Urea hydrolysis catalyzed by urease.
2. Material and methods
2.1 Biocomponent: jack beans (Canavalia ensiformis)
The biocomponent, jack beans, Canavalia ensiformis, as show in Figure 3, was donated by
Seeds & Associate Producers on Earth by Brazilian Agricultural Research Company
(EMBRAPA). It is a vegetal plant tissue rich in the urease (Luca & Reis, 2001). The jack beans
were being used as a powder, with a particle size less than or 3mm, in free form or
immobilized. When the powder was not in use, it was stored in refrigerators, till further use.
Fig. 3. Jack beans.
2.2 Ammonium ion-selective electrode calibration
For biosensor system development, an ammonium ion-selective electrode (Orion Ammonia
Electrode 95-12 Thermo) was used as transducer. A calibration curve of the electrode
potential (mV) vs. urea concentration (ppm) is constructed, using ammonium chloride
solution (NH
4
Cl) (1000 ppm) as stock solution. The standard solutions were prepared from
the stock solution in range of 5 to 1000 ppm.
2.4 Best conditions of the fresh jack bean urease
The tests for optimization the enzymatic reaction conditions of fresh urease of jack beans
monitored the urea hydrolysis to ammonia by ion-selective electrode response under
different conditions. The conditions tested were: the jack bean amount (0.1, 0.2, 0.3, 0.4 and
0.5 g); the pH of sample standard solution (6.0, 7.0 and 8.0) and reaction temperature (20, 25,
30 and 40°C).
The assay consisted in adding the desired amount of powder in 5.0 mL of the standard
solutions (several urea concentrations prepared from stock solution in potassium phosphate
buffer with desired pH) and 100 µL of ISA (ionic strength adjustor buffer solution). Then the
ammonium ion-selective electrode was immersed in the solution, monitoring the enzymatic
reaction by the potential difference (mV) caused by urea hydrolysis.
Biosensors – Emerging Materials and Applications
486
2.5 Urease immobilization
The enzyme (powdered jack bean) immobilization using glutaraldehyde was performed
according Junior (1995). The final configuration of procedure, in brief, urease was
covalently immobilized on nylon screen according to the following procedure: 0.2 g of
powdered beans was placed under a nylon screen and 200 mL of glutaraldehyde solution
(12.5%) were added. Then, another nylon screen was placed on top (Figure 4). After 20
minutes, the set was immersed in distilled water for 20 minutes and then in potassium
phosphate buffer pH 7.0 at the same time. The immobilized biocomponent was used after
storage for 24 hours in the refrigerator, at 4°C.
Fig. 4. Procedure step sequence of powdered jack bean immobilization.
2.6 Urease activity assay
Alkalimetric method is based on the observation made by Kistiakowsky & Shaw (1953, as
cited in Comerlato, 1995) which the initial pH neutral of unbuffered solution of urea-urease
rapidly increases to pH 9.0, and then remains approximately constant. The reaction products
in this pH are usually ammonium carbamate, ammonium carbonate and bicarbonate as
shown in the following Figure 5:
2
→
→2
→
Fig. 5. Urea hydrolysis by urease.
In this method, the urease activity was assayed by adding 1mL of urea solution,
immobilized urease and 10mL of deionised water. Incubation was carried out at 25ºC (room
temperature) and low agitation for a constant interval. Withdrew an aliquot (2 mL) of
mixture solution and terminated with hydrochloric acid solution. Then, the reaction mixture
was back-titrated with sodium hydroxide solution, methylorange being used as an
indicator. The blank test was assayed under the same conditions above, using 1mL of urea
solution and 11 mL of deionised water.
These end products of the reaction are a buffer system that maintains the pH constant as the
reaction proceeds. So using the substrate initially buffered at pH 9.0, avoids the subsequent
change in pH. The addition of excess hydrochloric acid in the final time disrupts the reaction
and converts the carbamate and ammonia to ammonium ions. Therefore, back-titration with
sodium hydroxide measures the acid did not react (Comerlato, 1995).
To calculate the enzyme activity, first is necessary to calculate the volume of sodium
hydroxide (vol. NaOH) wich is given by: vol. NaOH = vol. NaOH blank – vol. NaOH test. So
the urease activity calculated using the equation below:
Development of Potentiometric Urea Biosensor Based on Canavalia ensiformis Urease
487
.
1000
where:
.
1000
2.7 Kinetics parameters of urease
The kinetic parameters (K
m
and V
max
) for free and immobilized urease were determined by
using Lineweaver–Burk plot. The substrate was urea, and its concentrations were 0.05 to
10.00% (w/v). The reaction rates were determined according to the method mentioned
above in Section 2.4, with the established best reaction conditions. Based on Lineweaver–
Burk plot Michaelis constant and maximal rate were calculated.
2.8 Instrumentation: biosensor system
The schematic set-up for biosensor system for urea analysis is presented as Figure 6. The set
up consists of a peristaltic pump (2), reaction chamber (3) made from PVC pipe with
biocomponent (immobilized urease) (4), transducer (ion-selective electrode) (5), potentiostat
and data recorder (6). Standard sample and discard sample are numbered in Figure 5 as 1
and 7, respectively. Silicone tubing was used for connections.
Fig. 6. Schematic set-up for biosensor system for urea analysis.
Biosensors – Emerging Materials and Applications
488
2.8.1 Procedure
For urea analysis, calibration standards were prepared by dilution of urea stock solution in
potassium phosphate buffer, pH 6.0. All measurements were carried out by injection of
25.00 mL standard sample (0.50 a 50.00 ppm) at a flow rate of 40.00 mL.min
−1
. After the
sample has completed the reaction chamber, the pump was turned off and 200 mL of ISA
was added and electrode was immersed. Then, data were collected throughout the reaction
time, in order to analyze the response time of instrument. After each sample analysis, the
system was thoroughly rinsed with distilled water for 2 minutes. The potentiometric
measurements were made at room temperature (25°C).
A corresponding change of potential against the urea concentration could be observed.
Different urea concentrations would cause different potential changes, due to ammonia
generation. The values (mV) found with the transducer were converted into ammonia
concentration through the equation of calibration curve of ammonium ion-selective
electrode (Section 2.2). Thereby, the calibration curve of urea concentration versus
ammonium generated was obtained.
2.9 Stability studies
2.9.1 Reusability
The immobilized urease was tested for its reusability by checking the biosensor response
using assay as described in Section 2.8.1 at time intervals (days). After every use,
biocomponent was washed properly with distilled water and stored in potassium phosphate
buffer, pH 7.0 at 4ºC, till further use.
2.9.2 Storage stability
The immobilized urease was stored in potassium phosphate buffer, pH 7.0 at 4ºC. The
activity was determined and recorded at regular intervals for stored urease using assay
procedures described in Section 2.6. The values of activity were plotted against the number
of days.
2.10 Protein assay
The amount of protein in the wash solutions after urease immobilization and biosensor
system procedure were determined as described by Bradford (1976) with bovine serum
albumin (BSA) as a standard.
2.11 Reproducibility
The reproducibility of ammonium ion-selective electrode response was checked by
measuring this response when it was inserted into a 2% (w/v) urea solution with jack bean
immobilized under over 2 minutes of enzymatic reaction. The assay was developed in
potassium phosphate buffer, pH 6.0 at 25ºC.
3. Results
3.1 Best conditions of the jack bean urease (fresh and immobilized)
Table 1 shows the values of ammonia concentration (ppm) generated by urea hydrolysis in 2
minutes of enzymatic reaction in experiments with several fresh jack beans weight with urea
solutions of 0.05% to 10.00% (w/v).
Development of Potentiometric Urea Biosensor Based on Canavalia ensiformis Urease
489
Ammonia concentration (ppm)
Urea
concentration
% (w/v)
Jack beans weight (g)
0.1 0.2 0.3 0.4 0.5
0.05
33.02 38.69 22.40 5.57 11.67
0.10
3.73 60.97 37.73 52.24 42.25
0.50
21.97 96.29 77.79 77.23 120.85
1.00
67.44 107.99 161.70 161.48 201.22
2.00
76.16 119.96 141.96 170.66 167.56
4.00
100.88 183.08 204.64 313.02 265.61
6.00
90.11 134.24 218.96 218.86 234.95
8.00
77.73 120.84 214.76 1690.26 157.23
10.00
48.09 104.86 130.99 157.26 195.89
Table 1. Results of experiments to choose the best jack beans amount analyzing the ammonia
generation according Secion 2.4.
The table data are shown in the graph below (Figure 7). The curves of Figure 7 show that
after the urea concentration of 4% (w/v) regardless of the jack beans amount was a
saturation of the enzymatic reaction.
Fig. 7. Influence of jack beans amount on enzymatic reaction monitored (ammonia
generation) by ammonium ion-selective electrode according Secion 2.4.
Biosensors – Emerging Materials and Applications
490
Figure 8 shows the pH dependence of buffer solutions on the potentiometric response of the
transducer of fabricated urea biosensor. In the present work, the best response could be
observed at pH 6.0 which was subsequently utilized in further experimental investigations.
Fig. 8. Influence of buffer solution pH on the urea hydrolysis. Variation along the time of the
ammonium ion-selective electrode (mV) response to a 2% (w/v) urea solution.
Fig. 9. Effect of temperature on the urea hydrolysis. Variation along the time of the
ammonium ion-selective electrode (mV) response to a 2% (w/v) urea solution.
Development of Potentiometric Urea Biosensor Based on Canavalia ensiformis Urease
491
Furthermore, the effect of temperature of the buffer solution on the response of urea
biosensor was studied in the range of 20–40°C. Figure 9 shows the ammonium ion-selective
electrode against the buffer solution temperature. The 25°C was chosen the best temperature
and utilized in further experimental investigations.
Through the tests using the fresh biocomponent, the best pH solution and test temperature
were chosen. Furthermore, two jack beans amount (0.2 and 0.3 g) were chosen to be
immobilized as Section 2.5 and used in the further tests. Although the 0.3 g jack bean weight
has presented a better result as show in Figure 7, it was noted that 0.3 g did not have to be
immobilized satisfactory results, and then the 0.2 g jack bean mass was also tested.
The powder of jack beans (urease source) was immobilized in different matrices (different
screen materials), but the best results of mass retention were achieved with the screen nlyon
(80% mass retention) (data not shown). So, this material was chosen to be used in the
immobilization method in this work. Table 2 shows the values of ammonia concentration
(ppm) generated by hydrolysis urea in 2 minutes of enzymatic reaction in experiments with
0.2 and 0.3 g of immobilized jack beans with urea solutions of 0.05% to 10.00% (w/v).
Ammoia concentration (ppm)
Urea
concentration
% (w/v)
Jack beans weight (g)
0.2 0.3
0.05
62.13 42.29
0.10
258.61 205.31
0.50
30.24 243.77
1.00
525.73 271.94
2.00
675.31 371.47
4.00
981.44 533.27
6.00
1136.77 537.30
8.00
1200.35 583.23
10.00
1192.95 582.47
Table 2. Results of experiments to choose the best immobilized jack beans amount (0.2 or 0.3
g) analyzing the ammonia generation according Secion 2.4.
The table data are shown in the graph below (Figure 10). Figure 10 shows that the mass of
0.2 g had a higher urea hydrolysis into ammonia, whereas the immobilization of 0.3 g of jack
bean on the nylon screen formed a thick film, hindering the mass transfer phenomena. So
0.2 g of jack bean was chosen as amount to be immobilized and utilized in further
experimental investigations.
After the optimal pH of buffer solution, reaction temperature and immobilized amount of
jack beans were chosen, the reproducibility of the ion-selective electrode response when
inserted into 2% (w/v) urea solution was investigated under Section 2.11. Figure 11 shows a
response variation, an average, of 11% over the eight times.
Biosensors – Emerging Materials and Applications
492
Fig. 10. Enzymatic reaction tests by jack bean immobilized mass variation (0.2 and 0.3 g),
along the substrate (urea) concentration variation (0.05 to 10% (w/v)), pH 6.0, 25°C.
Fig. 11. Assay for reproducibility investigation according to Section 2.11.
Development of Potentiometric Urea Biosensor Based on Canavalia ensiformis Urease
493
3.2 Kinetic parameters determination
The kinetic parameters (K
m
and V
max
) were determined through the conventional
Lineweaver–Burk plot, by varying the urea concentration between 0.05 to 10.00% (w/v)
(Figure 12). The Km is an approximate measure of the affinity of the substrate for the
enzyme. So the Km values for the free and immobilized ureases were also calculated.
According to the results, the Km values were 19.10 mM and 411.39 mM for the free and
immobilized urease, respectively.
This is a common result, because normally an increase of Km for an immobilized enzyme is
expected. The difference of Km values suggests that substrate is easier to enter the active site
of free urease because the enzyme immobilization may influence the diffusion of the
substrate or product during reaction process. The K
m
values found are within the range
described in the literature (Verma & Singh, 2002) that lies between 2.08Mm for Bacillus sp.
up to 100mM for Bacillus pasteurii. Therefore, it is noted that the study material (Canavalia
ensiformis urease) has a good affinity with the substrate (urea) under the conditions tested.
Moreover, V
max
values for the free and immobilized ureases were also calculated. According
to the results, the V
max
values were 3.76 mM/min and 31.26 mM for the free and
immobilized urease, respectively. The value increase can be explained by enzymatic
structure changes bye immobilization process that may have made the active sites more
exposed to the substrate (urea).
Fig. 12. Plot of 1/V against 1/[S] for immobilized urease (0.2 g of jack bean, pH 6.0, at 25°C).
3.3 Calibration curve of biosensor system and Reusability
The preliminary tests with the biosensor system were aimed in order to find the response
time and linearity range of linearity of the instrument. For this, the range of 0.5 to 50.0 ppm
of urea was chosen. Figure 13 shows that in all experiments, linearity range was observed in
1.0 to 20.0 ppm of the substrate. The best response time for the biosensor system was chosen
315 seconds. Moreover, water washing process between analysis samples did not cause
Biosensors – Emerging Materials and Applications
494
mass loss of immobilized biocomponent according to protein assay (Section 2.10).
Calibration curve of protein assay is show in Figure 14.
Fig. 13. Ammonia concentration variation over the urea range studied (0.5 to 50 ppm) using
a biosensor system as a Section 2.8.1 for 317 seconds.
Fig. 14. Calibration curve of protein assay according Section 2.10.
Development of Potentiometric Urea Biosensor Based on Canavalia ensiformis Urease
495
Thereafter, to study the immobilized biocomponent reuse in biosensor system, assays were
designed using the same immobilized urease along the days as Section 2.9.1. Figure 15
shows the results over 29 days using immobilized biocomponent in biosensor system.
However, according to Table 3, it was found that up to 72 days of biocomponent use, the
biosensor system has linearity range 1.0 to 20.0 ppm of urea, although the difference
between the slopes of straight line, due to the urease activity of the immobilized jack bean
powder.
Fig. 15. Ammonia concentration variation over the urea range studied (0.5 to 50 ppm) using
a biosensor system as a Section 2.8.1 for 29 days.
3.4 Storage stability
Figure 16 shows the storage stability of the three immobilized Canavalia ensiformis urease (as
shown in Figure 4) stored at refrigerator (4°C) throughout the 1 month (30 days). The
operational stability of a biosensor response may vary considerably depending upon the
sensor geometry, method of preparation, biological recognition reactions etc. From Figure
16, it can be seen that the performance of the urea sensor stored under this conditions is not
good. A pronounced decrease in the initial urease activity was observed over a nine days of
stored.
4. Conclusion
In this study, for urease biosensor development, the urease was covalent immobilized on
nylon screen by glutaraldehyde and the ammonia produced as a result of enzymatic
reaction was monitored by potentiometry. The enzyme employed was from a rather non-