Biosensors Emerging Materials and Applications Part 16 docx
Bạn đang xem bản rút gọn của tài liệu. Xem và tải ngay bản đầy đủ của tài liệu tại đây (2.38 MB, 40 trang )
Chemical Biosensors Based on Proteins Involved in Biomineralization Processes
591
solutions of SCA-1, SCA-2, Ansocalcin, and Lysozyme (control) were prepared in distilled
water. All these three intramineral proteins (SCA-1, SCA-2, ANCA) as well as Lysozyme
were thermally analyzed in their aggregation behavior ranging from 5-30 ºC in steps of 1ºC.
For all proteins analyzed in dynamic light scattering the final concentration was 1.0 mg/mL.
2.3 Electrochemical investigations
The electro-analytical determinations of carbonate response for SCA-1 and SCA-2 were carried
out by cyclic voltammetry (100 mVs
-1
) in an AUTOLAB PGSTAT 30 potentiostat/galvanostat
following the procedure published by Marín-García et al. (2008). For these experiments, all
maximum currents for each addition of carbonate ions at different concentrations respect to a
voltage of 1.3V vs SCE (Saturated Calomel Electrode) using the protein adsorbed carbon paste
electrode, were divided by current of the pure carbon paste electrode to obtain a normalized
curve I/I° vs carbonate concentration. This electrochemical procedure was suitable to detect
the interaction between these proteins (10 μg included in the working electrode) and carbonate
ions (ranging from 0 to 14 mM) for SCA-1 and SCA2. It is worth mentioning that in
electrochemistry an inert electrolyte is always required for these types of experiments, so in all
cases LiClO
4
0.1 M was used as supporting electrolyte, and the electrochemical response
(current) of the carbonate oxidation on the pure carbon paste electrode was used as the control
experiment. The analyzed proteins did not show any electrochemical response in this medium.
This electroanalytical methodology was not suitable to be applied to ANCA due to the
limitation of amount of protein purified from the natural source, where the yield is very low
compared to SCA-1 and SCA-2 from the ostrich eggshell.
3. Results and discussion
The purity of all the proteins used in this research were analyzed and characterized by
means of biochemical methods as have been shown in the gel of electrophoresis (Figure 1).
In order to verify the feasibility of constructing a carbonate's biosensor using these
intramineral proteins contained in the avian eggshells, we based our electroanalytical
analyses using the first prototype designed by Marín-García et al, (2008).
Nowadays, proteins play an important role in the development of novel electroanalytical
devices because of their high selectivity for certain analytes. However, there is the
possibility of using them for monitoring biomolecules during diagnostic tests in different
clinical areas (Chien et al., 2009; Cosnier, 1999; Navratilova et al., 2006). Recently, the
development of a protein biosensor used to detect a specific class of antibiotic or any other
biological important species have been reported elsewhere (Amine & Palleschi, 2004; Li et
al., 2006; Mechler et al., 2006). Most of the proteins, which have been used for these types of
structural and biomedical research, need to be in a higher degree of purity.
In our experiments, for the electroanalytical results a clear final difference of the electrode
response was observed after the protein adsorption on the surface of the electrode. An
enhancement of the capacitive current and the change of the barrier potential were the most
important features proving the presence of the protein. The stability of the adsorption was
verified every 10 minutes using a cyclic voltammetry of the biosensor dipped into the
electrolyte solution. The response of cyclic voltammetry for proteins SCA-1 and SCA-2 in
period of one hour remained unchanged after protein-adsorption. Once the stability of the
protein on the biosensor was checked, its electrochemical response towards the carbonate
Biosensors – Emerging Materials and Applications
592
Fig. 1. SDS-PAGE electrophoresis gel for highly purified proteins used for this research: first
lane corresponds to MW markers, the second to Lysozyme (lys), third to Ansocalcin
(ANCA), the fourth and fifth for struthiocalcins 1 and 2 (SCA-1 and SCA-2) respectively.
ion was investigated. In Figure 2, the electrochemical response in terms of the normalized
current measured at 1.3 V vs SCE (Saturated Calomel Electrode, anodic barrier) with respect
to Na
2
CO
3
concentration is shown. Due to the absence of an electrochemical peak to follow
the electrochemical response, the current related to the anodic barrier, which corresponds to
the oxidation of carbonate anions, was monitored. The protein SCA-1, for instance, showed
a higher slope and a clear linear response (R
2
=0.98) of the current when carbonate
concentration in the solution was ranging from 10
-3
to 10
-2
M and a slope less remarkable for
SCA-2. This range was selected to show the response of the biosensor with the isolated
proteins from the eggshell, but it must be clarified that the biosensor could also give a good
response at lower carbonate concentrations or higher sensibility.
The comparison of the slope values for these analyzed proteins demonstrated that the
biosensor containing SCA-1 was 2.7 times more sensitive to carbonates, than the pure
carbon paste electrode.
Although these experiments were highly sensitive for detecting protein-carbonate ions
interactions, when applied to proteins SCA-1 and SCA-2, it was nevertheless a challenge to
look for another methodology to detect these interactions (chemical recognition) using a
simple experimental set up. By means of using photon correlation spectroscopy methods
like dynamic light scattering (DLS) can be performed easily using higher amounts of
carbonate ions ranging from 10mM to 100mM as those found in the intrauterine fluid in
avian (Domínguez-Vera et al., 2000), and less amount of protein sample.
Many proteins aggregate to some extent when they are in pure water. At low ionic strength,
the tendency to form aggregates is usually lower and became more soluble at certain pH
values (salting-in effect). However, in a transparent solution, it is difficult either to evaluate
the homogeneity or the inhomogeneity of the biological aggregates in solution. So, dynamic
light scattering methods were used to characterize the homogeneity, the conformational
stability, and thermal properties of these proteins. On the whole, the analyzed range of
Chemical Biosensors Based on Proteins Involved in Biomineralization Processes
593
Fig. 2. Fig. 2. Plot of normalized (I/I
0
) electrochemical response taken at 1.3V for all cyclic
voltammograms versus concentration of carbonate ions using an electrode of carbon paste.
Fig. 3. Dynamic light scattering aggregation behavior for a) SCA-1, b) SCA-2, c) SCA-1
filtered, and d) SCA-2 filtered.
Biosensors – Emerging Materials and Applications
594
temperatures (5 to 30 ºC), dynamic light scattering experiments for SCA-1, SCA-2 showed a
fully random aggregation behavior with huge aggregates (Figure 3a and 3b respectively).
However, when filtering the protein solution a few small and slightly homogeneous
aggregates were observed for SCA-1 in water as shown in Figure 3c (ranging from 250 to 350
nm in their hydrodynamic radii) when for SCA-2 these aggregates were small and
inhomogeneous (Figure 3d).
On the other hand, when adding different concentrations of carbonate ions (10mM, 70mM
and 100mM as shown in Figure 4 a-c respectively). This protein SCA-1 was stable showing a
highly homogeneous particle size distribution (around 40 nm in hydrodynamic radius)
when 70 mM sodium carbonate was added to the protein sample along the DLS analysis
and thermal behavior (Figure 4 b). It is clearly observed that the particle size distribution is a
function of carbonates concentration. The homogeneous hydrodynamic radius observed on
these experiments could be explained in terms of a well-defined aggregation process that
generates smallest species at 100mM and the biggest at 10mM. On the other hand, SCA-2 for
instance, showed almost the same behavior (Figure 4 d-f) obtained for SCA-1, but at higher
concentrations of sodium carbonate (ranging from 70 mM to 100mM) as shown in Figure 4 f.
In this case the aggregate size distribution did not follow a clear tendency like in SCA-1 with
the concentration, although the hydrodynamic radii were also function of carbonates
concentration value, which demonstrates that the process to form them occurs but by
different mechanism.
Fig. 4. Dynamic light scattering aggregation behavior for SCA-1 at a) 10mM, b) 70mM and c)
100mM sodium carbonate; the same for SCA-2 from d) 10mM, e) 70m, and f) 100mM.
Chemical Biosensors Based on Proteins Involved in Biomineralization Processes
595
In the particular case of Ansocalcin (Figure 5 a-d), this homogeneous size distribution
behavior was obtained starting at 10ºC ranging from 10mM concentration of sodium
carbonate as that obtained for SCA-1, from the filtered solution (Figure 5 a) to the addition
of 10mM, 70mM, and 100mM sodium carbonate (Figure 5b, 5c, and 5d respectively). This
protein did not show the aggregation trend observed for SCA-1 and SCA-2, which
demonstrates that ANCA is less sensitive to the carbonate ions recognition. It is worth
mentioning that goose eggshell contains only one intramineral protein (called ANCA). This
result is particularly interesting in terms of the conformational stability, and chemical
recognition function of these intramineral proteins as biological sensors for carbonate ions.
While SCA-1 is very sensitive, ANCA is less sensitive in all range of specific concentrations
of sodium carbonate (from 10mM to 70mM), and slightly more homogeneous at 70mM
concentration, which is equivalent to those concentrations found in the intrauterine fluid in
avian. The protein SCA-2 is sensitive at higher concentrations of carbonate ions (100 mM),
which is probably less sensitive to carbonate ions interactions than SCA-1 (see Figure 4f).
These dynamic light scattering experiments gave us a double check methodology to prove
our electrochemical approach shown in Figure 2. However, the procedure via light
scattering methods is less time-consuming, needs less amount of sample, and it is non-
destructive for analyzing these protein-carbonate interactions.
Fig. 5. Dynamic light scattering aggregation behavior for ANCA: a) filtered solution, b) in
the presence of 10mM, c) 70mM, and d) 100mM of sodium carbonate respectively.
Based on the present results, it is also possible to propose that the mineralization of calcium
carbonate (calcite) process that gives rise to avian eggshell formation is fostered by proteins
like SCA-1 in ostrich or ANCA for goose eggshell (or from the biological point of view
maybe controlled by some genes), which have an specific biological function during this
process. These would give rise to crystalline arrays that favor the formation of highly
Biosensors – Emerging Materials and Applications
596
Fig. 6. Dynamic light scattering aggregation behavior for Lysozyme: a) filtered solution, b)
in the presence of 10mM, c) 70mM, and d) 100mM of sodium carbonate respectively.
Fig. 7. Curve fitting of lysozyme aggregates growth for a cuadratic power of the
hydrodynamic radius versus temperature. The fitting equation was Y = -1.2945x
2
+ 76.566x –
92.554
Chemical Biosensors Based on Proteins Involved in Biomineralization Processes
597
selective polycrystalline aggregates, which have the specific features to develop the duties
for which these rigid structures have being designed (Li & Stroff, 2007). Finally, hen egg
white lysozyme, used as control, did not show a remarkable effect (Figure 6 a-d). This
protein is not intramineral, nonetheless it could play an important role also in the
calcification of eggshell as has been published recently (Wang et al., 2009). This can be
assumed by looking at Figure 6b where 10 mM sodium carbonate was added and a trend
was observed; the hydrodynamic radius varies from 200 to 1200 nm in the range of
temperatures from 5 to 30ºC compared to other values (Figure 6 c, d), where the random
aggregates size distribution was ranging from 10 to 400 nm, when adding 70 mM and 100
mM sodium carbonate respectively. From the crystal growth point of view, this linear
aggregation behavior for lysozyme is more related to the influence of the ionic strength to
the growth of the nucleus of lysozyme than the carbonate ions recognition. The linear
behavior of lysozyme aggregates (shown in Figure 6 b) was mathematically adjusted, and
did show a quadratic growth fitting; when plotting a quadratic value or root square of the r
h
(hydrodynamic radius) versus temperature (Figure 7).
Scheme 1. Proposed carbonate oxidation process through an interaction protein-carbonate
Biosensors – Emerging Materials and Applications
598
The selectivity towards carbonate ion observed with these proteins in electrochemical and
DLS experiments could be explained by an interaction mechanism where two carbonate
anions are fixed into a protein cavity named carbonate interaction site (Scheme 1, step I). In
the case of the electrochemical experiments, this mechanism facilitates the first oxidation
process producing the percarbonate ion that remains fixed at this site (step II). It can suffer a
second oxidation step yielding as final products oxygen and carbon dioxide molecules (step
III). The current value is enhanced due to an enriched mass transfer during the oxidation
process because both reactants are confined on the protein adsorbed on the electrode
surface. Finally, based on Figures 3 to 5 those clearly show the solution of the dilemma
about the selectivity of these proteins for carbonate ions. At least three of the intramineral
proteins SCA-1, and SCA-2 (concentration dependent) as well as ANCA (less sensitive)
interact directly with carbonate ions as proven by using electroanalytical methods (for SCA-
1 and 2), and dynamic light scattering techniques for all of them. This fact opens the first
possibility of explaining the mechanisms of calcite mineralization in the eggshell as well as
the potential applications of SCA-1, SCA-2, and ANCA as plausible carbonate ions
biosensors.
4. Conclusion
The idea of designing carbonate biosensors would be based on these types of experiments,
which demonstrated interaction between SCA-1, SCA-2 and ANCA with carbonate anions.
The electroanalytical characterization, and limits of the biosensor containing intramineral
proteins could be estimated in this contribution combining both methods cyclic
voltammetry, and photon correlation methods like dynamic light scattering.
5. Acknowledgment
The authors acknowledge financial support from the DGAPA-UNAM through projects No.
IN201811 and IN212207-3. Rayana R. Ruiz Arellano acknowledges the scholarship for a PhD
from C.L.A.F., and the Institute for Science and Technology of Mexico City (ICyTDF) and
CONACYT (complementary scholarship as an assistant researcher for SNI 3). Finally, one of
the authors (A.M.) acknowledges the partial support of CONACYT (Mexico) project No.
82888.
6. References
Amine, A., Palleschi, G. (2004) Phosphate, Nitrate, and Sulfate Biosensors. Analytical. Letters
37, pp. 1-19. ISSN 0003-2719.
Cosnier, S. (1999). Biomolecule immobilization on electrode surfaces by entrapment or
attachment to electrochemically polymerization films. Biosensors and Bioelectronics.
14, pp. 443-456. ISSN 0956-5663.
Chien, Y C., Hincke, M.T., McKnee, M.D. (2009). Avian Eggshell Structure and Osteopontin.
Cells Tissues Organs. 189 pp. 38-43. ISSN 1422-6405.
Dominguez-Vera, J. M., Gautron, J., Garcia-Ruiz, J. M., Nys, Y. (2000). The effect of avian
uterine fluid on the growth behavior of calcite crystals. Poultry Science 79, pp. 901-
907. ISSN 0032-5791.
Chemical Biosensors Based on Proteins Involved in Biomineralization Processes
599
Drickamer, K. (1999). C-type lectin-like domains. Curr. Opin. Struct. Biol. 9, pp. 585-590. ISSN
0959-440X.
Hincke, M.T., Gautron J., Tsang, Ch. P.W., McKnee, M.D., Nys, Y. (1999). Molecular Cloning
and Ultrastructural Localization of the Core Protein of an Eggshell Matrix
Proteoglycan, Ovocleidin-116, Journal of Biological Chemistry Vol. 274, pp 32915-
32923. ISSN 0021-9258.
Lammie, D., Bain, M. M., Solomon S. E., Wess, T. J. (2005). The Physiology of Avian
Eggshell, Current Topics in Biotechnology, Vol. 2, pp 65-74, ISSN 0972-821X.
Lakshminarayanan, R., Joseph, J. S., Kini, R. M., and Valiyaveettil, S. (2005).
Structure−Function Relationship of Avian Eggshell Matrix Proteins: A
Comparative Study of Two Major Eggshell Matrix Proteins. Anocalcin and OC-17.
Biomacromolecules, 6, pp. 741-751, ISSN 1525-7797
Li, H. & Estroff, L. A. (2007). Hydrogels Coupled with Self-Assembled Monolayers: An in
Vitro Matrix To Study Calcite Biomineralization. J. Am. Chem. Soc. 129, pp. 5480-
5483. ISSN 0002-7863.
Li, I. T., Pham, E., Truong, K. (2006). Protein biosensors based on the principle of
fluorescence resonance energy transfer for monitoring cellular dynamics.
Biotechnoly Letters. 28, pp. 1971-1982. ISSN 0141-5492.
Mann, K. & Siedler, F. (1999). The amino acid sequence of ovocleidin 17, a major protein of
the avian eggshell calcified layer Biochem. Mol. Biol. Int. 47, pp. 997-1007. ISSN 1039-
9712.
Mann, K. & Siedler, F. (2004). Ostrich (Struthio camelus) eggshell matrix contains two
different C-type lectin-like proteins. Isolation, amino acid sequence, and
posttranslational modifications. Biochim. et Biophysics Acta.1696, pp. 41-50. ISSN
09266585.
Mann, K. & Siedler, F. (2006). Amino acid sequences and phosphorylation sites of emu and
rhea eggshell C-type lectin-like proteins. Comparative Biochemistry and Physiology.
143B, pp. 160-170. ISSN 1095-6433.
Mann, S. (2001). Biomineralization. Principles and Concepts in Bioinorganic Materials Chemistry,
Oxford University Press, ISBN 0-19-850882-4, Oxford, UK.
Marín-García, L., Frontana-Uribe, B.A., Reyes-Grajeda, J.P., Stojanoff, V., Serrano-Posada,
H.J., Moreno, A. (2008). Chemical recognition of carbonate anions by proteins
involved in biomineralization processes and their influence on calcite crystal
growth. Crystal Growth and Design. 8, pp. 1340-1345. ISSN 1528-7483.
Mechler, A., Nawaratna, G., Aguilar, M., Martin, L. L. (2006). A Study of Protein
Electrochemistry on a Supported Membrane Electrode. Int. J. of Peptide Research and
Therapeutics 12, No. 3 (2006) 217-224. ISSN 1573-3149.
Navratilova, I., Pancera, M., Wyatt, R. T., Myszka, D. G. (2006). A biosensor-based approach
toward purification and crystallization of G protein-coupled receptors. Analytical
Biochemistry. 353, pp. 278-283. ISSN 0003-2697.
Narayana K. & Subramanian N. (2010). Crystallization from Gels In: Handbook of Crystal
Growth, Dhanaraj, G., Byrappa, K., Prasad, V., Dudley, M. (Ed), pp. 1607-1636
Springer-Verlag, ISBN 978-3-540-74182-4, Berlin, Germany.
Biosensors – Emerging Materials and Applications
600
Reyes-Grajeda, J. P., Moreno, A., Romero, A. (2004). Crystal Structure of Ovocleidin-17, a
Major Protein of the Calcified Gallus gallus Eggshell. Implications in the calcite
mineral growth pattern. J. Biol. Chem. 279, pp. 40876-40881. ISSN 0021-9258.
Wang, X., Sun, H., Xia, Y., Chen, C., Xu, H., Shan, H., Lu, J. R. (2009). Lysozyme mediated
calcium carbonate mineralization. Journal of Colloid and Interface Science 332, pp. 96-
103. ISSN 0021-9797.
27
Applicability of GFP Microbial Whole Cell
Biosensors to Bioreactor Operations -
Mathematical Modeling and Related
Experimental Tools
Delvigne Frank
1
, Brognaux Alison
1
, Gorret Nathalie
2
,
Sørensen J. Søren
3
, Crine Michel
4
and Thonart Philippe
1
1
Université de Liège, Gembloux Agro-Bio Tech, Unité de Bio-industries/CWBI
2
Université de Toulouse, INSA, INRA, UMR792
Ingénierie des Systèmes Biologiques et Procédés
3
University of Copenhagen, Department of microbiology, SØlvgade 83H, 1307 Copenhagen
4
Université de Liège, Chemical engineering laboratory
1,4
Belgium
2
France
3
Denmark
1. Introduction
Until now, whole cell microbial biosensors have been mainly used for the detection
chemicals in different ecosystems (Sorensen, 2006). In this work, we propose to point out
different features of microbial biosensors in the context of their applicability to monitor
bioreactor operations. Indeed, large-scale bioreactors tend to be heterogeneous and it is now
clear that these heterogeneities (e.g. in substrate, dissolved oxygen, pH, temperature,…)
induce several kinds of physiological responses at the level of the exposed microbial cells,
i.e., metabolic shift (Xu, 1999, Neubauer, 1995, Han L., 2002), mRNA synthesis (Schweder,
1999), stress protein synthesis (Schweder, 2004, Pioch, 2007), alteration of membrane
integrity (Hewitt, 2000, Nebe-von-Caron G., 2000). In this context, the use of Green
Fluorescent Protein (GFP) microbial whole cell biosensors is fully justified to their
recognized advantages: characterization of the physico-chemical conditions at the
micrometer scale when analyzed at the single cell level (Tecon, 2006, Southward, 2002), non
invasive measurement and possibility to acquire online signal (Jones, 2004). Two main
problems are encountered when extending the use of microbial biosensors for monitoring
bioreactor efficiency, i.e. first the choice of an appropriate stress promoter for the detection
of extracellular fluctuations and second the dynamics of the expression of the reporter
system in front of the bioreactors hydrodynamics. This last issue is especially critical
considering the particular dynamics of extracellular fluctuations encountered in the reacting
volume depending on bioreactor mixing efficiency, circulation of microbial cells inside the
broth and the dynamics of substrate consumption. Discussion will be supported by
Biosensors – Emerging Materials and Applications
602
mathematical simulations of the dynamics of GFP expression inside microbial biosensors
and of the bioreactor hydrodynamics.
2. Basic microbial biosensor design and its application to bioreactor
operations
2.1 Basic bioreactor design: the scaling-up problematic and the potential role of
microbial biosensors
The main problem associated with bioprocesses scaling-up is the formation of concentration
gradients inside large-scale bioreactors (Hewitt, 2007a, Lara, 2006, Enfors, 2001). These
gradients induce various stresses at the level of microbial cells, such as glucose excess, glucose
starvation, oxygen limitation, pH shock, leading to a deviation of the cells from the desired
metabolism and in extreme case to a complete modification of the metabolism subsequent to a
modification of the gene expression pattern. Studies have been mainly focused on glucose
gradient appearing during fed-batch process, although other kinds of gradient have also been
considered (Neubauer, 2010). The characterization of the exposure of microorganisms to
gradients stress is not a trivial task, since several phenomena, including bioreactor mixing
efficiency and microorganism's circulation, are involved (Fig. 1).
Fig. 1. Illustration of the exposure of microbial cells to glucose gradient concentration inside
an industrial bioreactor operating in fed-batch mode. The color intensity is proportional to
the glucose concentration and the figure shows that glucose accumulates at the level of the
upper part of the bioreactor considering the lack at the level of the mixing efficiency of the
system
Actually, because of the lack of appropriate sensors, bioprocess monitoring rely on indirect,
global parameters, such as biomass evolution, substrate uptake profile, and these
Applicability of GFP Microbial Whole Cell Biosensors to
Bioreactor Operations: Mathematical Modeling and Related Experimental Tools
603
parameters are not directly related to the cells physiological state (Deckwer, 2006, Pioch,
2007, Clementschitsch F., 2006). As reported in previous studies, stress genes can be used as
marker in order to monitor the fitness of bacterial systems during industrial bioprocesses
(Schweder, 2004). We propose thus to use several stress promoters linked with the GFP
doing sequence and inserted in microbial cells in order to design some kind of
"physiological tracer" for the determination of the biological impact of the mixing conditions
met in heterogeneous bioreactors. These analyses will be performed by considering several
E. coli strains carrying a Green Fluorescent Protein (GFP) reporter system. This kind of
reporter system provides rapid detection of the promoter expression level (March, 2003), at
a single cell level (by using flow cytometry) and by taking the population dynamics into
account (Patkar, 2002). Indeed, previous studies have shown that microbial population can
be very heterogeneous in a bioreactor, according to a particular cellular function (Hewitt,
2007b, Sundstrom, 2004, Roostalu, 2008). It is why a lare part of this work will be devoted to
the demonstration of the usefulness of GFP reporter strains combined with a flow cytometry
analytical tool in order to characterize the stress experienced by microorganisms in perturbed
fed-batch bioreactors. As said before, this combination of biological and analytical techniques
allows the observation of the consequences of stress at a single cell resolution among a
microbial population. By comparison with inert tracer experiments used to characterize
bioreactor hydrodynamics, the GFP reporter system takes into account the cell history, i.e. the
displacement of the microbial particle along the concentration gradient. This reporter system is
also linked with a direct physiological parameter, i.e. the protein synthesis related to an
extracellular stimulus. It must be noted that, although protein synthesis is the final
consequence of a physiological reaction (e.g., synthesis of a stress protein that redirect
metabolic activity to better cope with stress conditions), the characteristic time constant
associated with this biological reaction is rather high compared with circulation and mixing
time inside bioreactors. The major challenge of this work is thus to demonstrate that useful
information can be gained from the analysis of the GFP microbial biosensor dynamics after the
response of the microbial population to various process-related perturbations.
2.2 Selection of an appropriate stress promoter
The critical step for an appropriate biosensor design, apart from the characteristics of the
GFP itself, relies on the choice of a stress promoter. This is this part of the biosensor that will
be sensitive to the extracellular conditions met by microbial cells inside bioreactors (Fig. 2).
According to their specificity, three classes of promoter can be considered in order to build
the reporter system (Sorensen, 2006):
- Non-specific: the reporter gene coding for GFP is linked to a constitutive promoter. This
kind of construction has been previously used to toxicants in various environments
(Wiles, 2003, Bhattacharyy, 2005). Since the promoter is constitutively expressed, cells
that are exposed to lethal dose of toxicants do not exhibit any fluorescence and can be
easily distinguished from not exposed biosensors. Owing to their simplicity, non-
specific reporters are the most widely used whole-cell biosensors.
- Semi-specific: the reporter gene is linked with a promoter responding to general
conditions of stress. In this case, the biosensor is activated when cells are exposed to
stressful conditions. Stress promoters can be selected on the basis of their belonging to
well-known stress regulon, such as the heat shock or the general stress response
regulons (e.g., rpoS regulon for several Gram negative bacteria, including E. coli).
Biosensors – Emerging Materials and Applications
604
- Specific: the biosensor specifically responds to the presence of a defined chemical. It
implies the selection of a promoter that is tightly regulated by the presence of a specific
chemical signal.
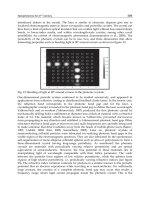
Fig. 2. Basic principle of GFP microbial biosensors. Photograph on the right shows the
process of GFP synthesis inside E. coli biosensors
In bioreactor, the environment detected by the cells comprises multiple variables, such as
substrate level, pH, dissolved oxygen and temperature. The use of specific biosensor is thus
not adapted in bioreactor applications, although some studies involve the use of such
system (e.g., the use of the narZ promoter coupled to the GFP coding sequence in order to
detect local oxygen limitation in bioreactors (Garcia, 2009)). It must also point out that the
reporter system governs the field of application of the considered microbial biosensor.
Indeed, if GFP is used as signaling system, only aerobic processes can be investigated,
considering that maturation of the GFP molecule requires an oxidation step promoted by
the presence of oxygen in the medium (Tsien R.Y., 1998). In our case, we will select stress
promoter responsive to carbon limitation. This stimulus is in fact mainly encountered in
intensive fed-batch operation, one of the most used modes of operation at the industrial
level considering its enhanced productivity. Then, in normal fed-batch mode it is expected
that the microbial biosensor is fully activated and exhibit a given level of fluorescence
according to the strength of the associated stress promoter, and when biosensor is exposed
to deviation from the normal feeding profile, GFP level decreases. These considerations
about the performances of fed-batch bioreactor will be explained more in details in section 4.
2.3 Dynamics of the microbial biosensor and method for GFP detection
When the appropriate stress promoter has been selected, the characteristic of the reporter
molecule itself, i.e. GFP, must be kept into account. Indeed, GFP synthesis depends on a
huge amount of factors, such as plasmid copy number (if the reporter system is carried by a
plasmid), promoter strength, but also the rate of transcription and translation and the half-
life of the GFP mRNA and proteins. One of the major drawbacks associated with the first
version of GFP used as reporter system was its folding and maturation time of about 95
minutes (DeLisa, 1999), limiting the use of GFP to characterize the dynamics of microbial
process in bioreactor. Until this, intensive researches have been provided in order to find
out GFP variant of different colors (Shaner, 2005) and exhibiting significantly reduced
Applicability of GFP Microbial Whole Cell Biosensors to
Bioreactor Operations: Mathematical Modeling and Related Experimental Tools
605
maturation time (Cormack, 2000). This has led to the GFPmut1, 2 and 3 variants with
maturation of about 4 minutes. Another issue was the high stability of this variant. In fact,
the stability of the gfpmut2 variant is so high that this protein exhibits half-life of more than
24 hours. In order to illustrate the previous statement, a model allowing the simulation of
GFP synthesis has been set up. This model is partly inspired from (Thattai M., 2004) and
take into account the essential step involved in GFP expression (Fig. 3).
Fig. 3. Scheme showing the different steps involved for GFP synthesis and related chemical
reactions with specific rates (from k1 to k8)
In our case, synthesis of transcription activator (TA) will depends on the exposure of
microbial cells to heterogeneous conditions at the level of the bioreactor (Fig. 3). When TA is
synthesized, it binds to the stress promoter (here, rpoS promoter has been chosen as an
example) and the TA_DNA complex induces a cascade of reactions involving transcription
of GFP-related mRNA and translation of this RNA to actively fluorescent GFP.
In this work, the gfpmut2 variant will be used (details about GFP biosensors will be given in
section 3). The dynamics of our microbial biosensors will be experimentally characterized in
section 4. The dynamics of this set of reactions can be mathematically modeled by 5 ordinary
differential equations (ODEs) involving synthesis and degradation of the different chemicals
involved (i.e. TA, TA_DNA, DNA, RNA and GFP):
k
k
.TA.DNAk
.TAk
.TA
(1)
_
k
.TA.DNAk
.TA_DNAk
.TA_DNA (2)
k
.TA_DNAk
.TA.DNA (3)
k
.TA_DNAk
.RNAk
.RNA (4)
k
.RNAk
.GFP (5)
Biosensors – Emerging Materials and Applications
606
These equations can be used in order to predict the time required to reach a given GFP
expression level after gene induction. Basically, GFP-related fluorescence can be monitored
non-invasively and in a non-destructive way by a lot of equipments comprising excitation
sources and appropriate photomultipliers (Randers-Eichhorn, 1997, Kostov, 2000). However,
there are more and more GFP measurements carried out with flow cytometer (Patkar, 2002,
Galbraith, 1999, Tracy, 2010, Diaz, 2010). This equipment allows the separation of cells prior
to analysis, leading to single-cell measurements. The major reason for this increasing interest
for flow cytometry relies on the fact that microbial cells are able to exhibit various
phenotypes in a same culture broth. Many reasons have been identified to lead to this
phenotypic heterogeneity, among which various intrinsic biological processes (cell cycle and
division) and extrinsic physico-chemical conditions (impact of the environment on microbial
cells) (Müller, 2010). In our case, the recognized stochasticity associated to gene expression
(MacAdams H.H., 1997, Swain P.S., 2002) is of major importance since it affects directly GFP
synthesis (Mettetal, 2006). To account for these random components, several stochastic
models have been developed. Most of these modes are based on the Gillespie algorithm in
order to include the stochasticity at the level of the biochemical reactions (Gillespie D.T.,
2001). In order to demonstrate the potential impact of stochastic gene expression on GFP
synthesis, equations (1) to (5) have been implemented at the level of the Gillespie algorithm.
Simulation has been performed with the following parameters: k1 = 0.1 s
-1
; k2 = 0.05 s
-1
; k3 =
0.045 s
-1
; k4 = 0.09 s
-1
; k5 = 0.1 s
-1
; k7=0.0058 s
-1
; k6=0.1155 s
-1
; k8=0.0002 s
-1
,and considers
that the biosensor is activated after 1hour (Fig. 4). Simulated results show that GFP content
at the single cell level can vary according to the random nature of the biochemical reactions
(Fig. 3). This randomness has to be attributed to the extremely small reacting volume
represented by the microbial envelope and the rather small amount of DNA and RNA
molecules involved.
Fig. 4. Stochastic simulation of the GFP evolution at the single cell level according to the
biochemical reaction scheme depicted at figure 3.
By repeating several time the simulation, it is possible to simulate the fate of GFP expression
at the single cell level for a whole microbial population. By this way, phenotypic
heterogeneity can be taken into account. Comparison with experimental results obtained by
Applicability of GFP Microbial Whole Cell Biosensors to
Bioreactor Operations: Mathematical Modeling and Related Experimental Tools
607
flow cytometry is also possible by taking into account the background noise and the
sensitivity of this equipment (Zhang, 2006) (Fig. 5).
Fig. 5. Simulated histogram for the GFP content at the single cell level for a given time
during bioreactor cultivation
The purpose of this work is to demonstrate the applicability for the use of microbial
biosensor in a fluctuating reacting volume representative of that encountered in large-scale
bioreactor. Single cell behavior will be investigated in order to highlight the impact of both
intrinsic and extrinsic sources of noise at the level of GFP expression.
3. "Material and methods" items used in order to illustrate the principles
covered in this chapter
The experimental results that will be used to illustrate this chapter come from an important
set of experiments involving different E. coli GFP reporter strains coming from a public
collection (Zaslaver, 2006). Two techniques have been used for GFP detection: a classical
spectrofluorimeter and flow cytometry. Most of the experiments carried out in this work
have been based on a fluorescence signal are measured by flow cytometry, considering the
single cell capability of this techniques. This approach allows to interpret the data by
considering the stochastic mechanisms (noise) inherent to GFP expression and to
fluctuations met in heterogeneous environment (Müller, 2010, Patnaik, 2002, Patnaik P.R.,
2006). Techniques are detailed in the following sections.
3.1 Strains and medium
E. coli K12 MG1655 bearing a pMS201 (4260 bp) plasmid with a stress promoter and a
kanamycin resistance gene. The strains comes from a cloning vector library elaborated at the
Biosensors – Emerging Materials and Applications
608
Weizmann Institute of Science (Zaslaver, 2006). Three reporter strains have been selected
from this library, according to the responsiveness of their promoter to carbon limitation, i.e.
the general stress response promoter rpoS, the carbon starvation induced promoter csiE and
the universal stress protein associated promoter uspA. A constitutive promoter cyaA has
been used as a basis for comparison (Fig. 6). Microbial biosensors are maintained at -80°C in
working seeds vials (2 mL) in solution with LB media and with 40% of glycerol. Precultures
and cultures have been performed on a defined mineral salt medium containing (in g/L):
K
2
HPO
4
14.6, NaH
2
PO
4
.2H
2
O 3.6 ; Na
2
SO
4
2 ; (NH
4
)
2
SO
4
2.47, NH
4
Cl 0.5, (NH
4
)
2
-H-citrate
1, glucose 5, thiamine 0.01, kanamycin 0.1. Thiamin and kanamycin are sterilized by
filtration (0.2 µm). The medium is supplemented with 3mL/L of trace solution, 3mL/L of
a FeCl
3
.6H
2
O solution (16.7 g/L), 3mL/L of an EDTA solution (20.1 g/L) and 2mL/L of a
MgSO
4
solution (120 g/L). The trace solution contains (in g/L): CoCl
2
.H
2
O 0.74,
ZnSO
4
.7H
2
O 0.18, MnSO
4
.H
2
O 0.1, CuSO
4
.5H
2
O, CoSO
4
.7H
2
O. Before each bioreactor
cultivation experiment, a precultivation step is performed in 100 mL of the above
mentioned medium in baffled shake flask at 37°C and under orbital shaking at 160 rounds
per minute. Cell growth has been monitored by optical density (OD) at a wavelength of
600 nm. Cell dry weight has been determined on the basis of filtered samples (0.45 µm)
dried during 24 hours at 105°C. Glucose concentration has been monitored by an electro-
enzymatic system YSI.
Fig. 6. Epifluorescence microscopy pictures showing the relative intensity of the basal level
of GFP expression for the different microbial biosensors involved in this work
Applicability of GFP Microbial Whole Cell Biosensors to
Bioreactor Operations: Mathematical Modeling and Related Experimental Tools
609
3.2 Bioreactor configurations
Microbial GFP biosensors have been cultivated in a lab-scale stirred bioreactors (Biostat B-
Twin, Sartorius) operated in fed-batch mode (total volume: 3L; initial working volume: 1L;
final working volume: 1.5L; mixing provided by a standard RTD6 rushton turbine). The
bioreactor platform comprises 2 cultivation vessels in parallel monitored and controlled by
the same control unit (remote control by the MFCS/win 3.0 software). For each reporter
strains, experiments have been conducted in parallel by considering a culture performed in
the classical stirred vessel and another one conducted with the stirred vessel connected to a
recycle loop. This last apparatus correspond to a scale-down strategy allowing to reproduce
heterogeneities expected in large-scale bioreactors (Hewitt, 2007a, Lara, 2006, Delvigne,
2006a). The scale-down reactor arrangement is based on the previously described stirred
bioreactor connected to a recycle loop (silicon pipe; diameter 0.005m ; length 6m or 12m in
order to modulate the residence time in the recycle loop). A continuous recirculation of the
broth between the stirred reactor and the recycle loop is ensured by a peristaltic pump
(Watson Marlow 323) with the glucose feed solution being added at the inlet of the recycle
loop in order to generate a concentration gradient. Fed-batch is controlled on the basis of
dissolved oxygen (setpoint : 30% above saturation). The dissolved oxygen in the recycle loop
is monitored by a set of sterilizable optical probes (Flow-through cell, Presens). The sensor
spot inserted in the flow-through cell contains a fluorogenic compound that is excited at a
wavelength of 540 nm. The emission signal can then be recorded at 640 nm. The dissolved
oxygen measurement is based on the properties that molecular oxygen is able to absorb a
part of the emission energy. The relationship between dissolved oxygen and fluorescence
intensity is nonlinear and can be expressed by the Stern-Volmer equation (John, 2003). The
excitation and emission signals are generated / recorded at the level of a miniaturized set of
excitation led and photomultiplier. The fluorescence signal coming from planar sensors is
then processed and recorded at the level of an oxy-4 mini transmitter. During the
experiments, pH was maintained at 6.9 (regulation by ammonia and phosphoric acid) and
temperature at 37°C. Stirrer rate is maintained at 1000 rpm with a RDT6 impeller and air
flow rate is set to 1 L/min at the beginning of the culture. When fed-batch is started
agitation rate and air flow rate are progressively raised to 1300 rpm and 2 L/min
respectively. Culture is fed with 500 mL of a solution containing 400 g/L of glucose diluted
in mineral medium (see above for composition). Continuous cultures have also been
performed on the basis of the same stirred bioreactor with the same settings. In this case,
fresh culture medium is added continuously and spent medium is withdrawn in order to
keep a constant volume. The fresh medium feed rate is modulated in order to reach dilution
rate of 0.02 h
-1
and 0.2 h
-1
.
3.3 Flow cytometry
The analysis of the GFP expression level has been performed by Fluorescence Activated Cell
Sorting (FACS) on a FACScan (Becton Dickinson) flow cytometer. Samples are taken directly
from the reactor and are diluted in 900 µL of PBS and 100 µL of a chloramphenicol solution
(50 µg/mL) in order to stop protein synthesis. For each measurement, 30,000 cells are
analyzed. GFP is excited at 488 nm and emission signals are collected by using filters at 530
nm. The gfp-mut2 variant has been especially engineered to optimally match the
excitation/emission range of the FACS instrument (Cormack, 1996). Considering that
bacterial cells exhibit a high side scatter (SSC) signal(Galbraith, 1999), a threshold of 52 has
been set up on the SSC channel in order to limit noise signal. The FSC, FL1, FL2 and FL3
Biosensors – Emerging Materials and Applications
610
channels are logarithmically amplified with the following settings: FSC E00, FL1 620, FL2
420, FL3 420. The results have been analyzed by the FlowJo version 7.6.1 software. Flow
cytometry has also been used in order to determine the residence time distribution inside
the recycle loop of the SDRs and the membrane permeability of the cells (see above).
3.4 Tracer test for the determination of the residence time distribution inside the
recycle loop of the SDRs
Fluorescent microspheres (fluorosphere 1µm, molecular probes, invitrogen) have been
used as representative tracer for the determination of the residence time distribution of
the microbial cells inside the recycle loop of the SDRs. Indeed, tracer test involving
particulate dye instead of soluble dye has been recently recognized as more relevant to
describe the transport of microbial cells (Asraf-Snir, 2011). We have also use this method
previously for the characterization of the transport of fluorescently labeled microbial cells
in scale-down reactors (Delvigne, 2006b). Our methodology has been improved in the
present work, mainly at the level of the method used to detect fluorescent particles. A
tracer pulse of 1 mL containing 10
9
fluorescent beads has been injected at the inlet of the
recycle loop. Samples of 3 mL are taken at different time intervals at the outlet of the
recycle loop. Samples are analyzed by flow cytometry. Beads are easily detected according
to their high green fluorescent level (FL1 detection). The analysis is performed for 30s
and the number of events recorded during this period is used as a measure of the beads
concentration. The number of events is gated on the basis of the FL1 parameter in order to
make the distinction between fluorescent beads and background (software analysis
performed on FlowJo 7.6.1.). The RTD curves are processed with MatLab to determine the
following parameters:
∑
.
.∆
∑
.∆
(6)
∑
.
.∆
∑
.∆
(7)
With t
R
being the mean residence time of the RTD (s); C
i
the number of beads detected
during the time interval t
i
and σ² the variance of the RTD (s²).
The SDRs considered here comprise a well-mixed stirred bioreactor connected to a recycle
loop. Glucose is injected at the inlet of the recycle loop in order to generate a concentration
gradient. As stated in a previous work, the intensity of the concentration gradient, but also
the frequency at which microbial cells are exposed to these gradients is important (Delvigne,
2006a). In order to assess the performances of the SDRs, the residence time distribution
(RTD) of microbial cells has been determined by using an innovative tracer test.
Mathematical treatment of the RTD curves led to the following results: in the case of the
SDR with a recycle loop L = 6 m : mean residence time t
R
= 38.2 s and variance σ² of 62.2 s² ;
in the case of the SDR with a recycle loop L = 12 m : t
R
= 79.8 s and σ² = 120.7 s².
3.5 Supernatant analysis: fluorescence, SDS-page and western blot
Samples coming from bioreactor are centrifugated at 12000 rpm for 3 minutes and filtered
on 0.2 µm cellulose membrane in order to remove the cells. Fluorescence of the supernatant
(samples of 200 µL on 96 wells black microtiter plate) is analysed by spectrofluorimetry
(Victor³ V Wallac, Perkin Elmer). Proteins coming from the supernatant (7 µL) are separated
Applicability of GFP Microbial Whole Cell Biosensors to
Bioreactor Operations: Mathematical Modeling and Related Experimental Tools
611
on 30% polyacrylamide gels (Biorad). Immunoblot is performed in order to detect the band
corresponding to GFP (ECL plus detection system, Amersham).
3.6 Membrane permeability
Samples taken from bioreactor are diluted in PBS in order to reach an optical density of 4.
Cells are stained by adding 10µL of propidium iodide solution (PI) for 15 minutes at 37°C.
Samples are then analyzed by flow cytometry with the following settings : FSC E00, FL1 620,
FL2 420, FL3 520.
3.7 Mathematical modeling
Mathematical modeling procedures allowing the simulation of the gradients experienced by
microbial biosensors developed in this work will be explained directly in the text for the
ease of understanding. All the codes are written in MatLab and are based on standard
algorithm (notably the ode function has been used for the resolution of ODEs systems).
Sample codes are provided in annex. Please refer to a reference book (e.g., (Finlayson, 2006))
for additional explanations about appropriate use of the .m codes.
4. Investigation of the dynamics of several GFP microbial biosensors
responsive to substrate limitation
Two strategies, involving each a given bioreactor mode of operation, will be considered in
order to assess the performance of selected microbial biosensors. The chemostat reactor
allows to test the responsiveness of the microbial biosensor in fully stabilized conditions,
whereas the scale-down reactor (SDR) allows to better reproduce the complex
environmental perturbations encountered in industrial scale bioreactor operating in fed-
batch mode.
4.1 Investigation in continuous bioreactors : chemostat mode
In order to assess the responsiveness of the microbial biosensor, a culture in chemostat
mode has been performed by considering a sharp variation at the level of the dilution rate.
Indeed, the csiE biosensor is supposed to be induced upon carbon limitation, a condition
that can be easily implemented in a chemostat under controlled conditions (i.e., constant cell
density and growth rate with constant environmental variables such as pH and dissolved
oxygen). The culture is started by a batch phase and no evolution of the fluorescence is
noticed during this phase according to the fact that microbial growth is not limited and
substrate is in large excess. At the end of the batch phase, bioreactor is switched to
continuous mode at a very low dilution rate of 0.02 h
-1
(Fig. 7) At this stage, csiE promoter is
activated and fluorescence level rises significantly and reach a constant value after 60 hours
of culture (corresponding to the equilibrium time considered when using a D = 0.02 h
-1
).
When equilibrium is reached, dilution rate is rapidly switched to 0.2 h-1 leading to a shift of
the environmental conditions to less limiting at the level of the carbon source. As expected,
fluorescence level drops considering the decrease of the activation of the csiE promoter.
However, fluorescence level does not go back to its initial basal level. As a last step of
experiment, a glucose pulse of 5 g/L has been performed in order to relieve completely
glucose limitation leading to the drop of fluorescence level to its initial state. This series of
experiments validate the responsiveness of the csiE promoter to glucose limitation.
Biosensors – Emerging Materials and Applications
612
Fig. 7. Evolution of the global fluorescence for a culture carried out by using the csiE
microbial biosensor in chemostat. Initial batch phase ends at 2 hours and is followed by a
continuous mode of culture.
The GFP distribution among the microbial population has been determined by flow
cytometry (Fig. 8). Results show that, even when all the microbial biosensors are cultivated
under strictly constant environmental conditions, heterogeneity at the level expression is
observed. This phenomenon has to be attributed to the stochastic mechanisms governing
GFP expression (described as the intrinsic source of noise in section 2) and must be further
taken into account to make the difference between intrinsic and extrinsic or environmental
source of noise. The extrinsic source of noise will be experimentally generated at the level of
a scale-down bioreactor.
4.2 Investigation in scale-down reactors (SDR)
In industrial bioreactor, the picture is by far more complex since extrinsic noise has to be
added to the intrinsic one. Indeed, the drop of mixing efficiency induces the appearance of
concentration gradient. In order to characterize the concentration fluctuations met by the
microbial cells, the circulation process must be superimposed to the concentration gradient.
However, it is well known that this circulation process is subject to stochasticity in large-
scale bioreactor, and can be characterized by a circulation time distribution (Nienow A.W.,
1998). This kind of stochastic process is at the basis of the extrinsic source of noise, i.e. the
extracellular fluctuations experienced by the cells and potentially leading to a stress
response (Müller, 2010). In order to take into account this extrinsic component, a two-
compartment scale-down bioreactor experiment has been set up. In this kind of apparatus,
the passage of the cells through the tubular section is an extrinsic stochastic phenomenon
Applicability of GFP Microbial Whole Cell Biosensors to
Bioreactor Operations: Mathematical Modeling and Related Experimental Tools
613
Fig. 8. Distribution of the GFP-related fluorescence determined by flow cytometry (green
component of the fluorescence determined by the FL1 channel). Sample has been taken from
a culture involving the csiE biosensor in a chemostat at D = 0.02 h
-1
that leads to the exposure to local glucose fluctuations. By this way, it is possible to expose
the microbial cells belonging to the same population to extracellular fluctuations at different
frequencies and intensities (Fig. 9).
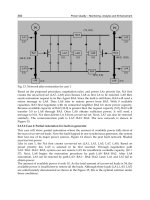
Fig. 9. Illustration of the scale-down reactor (B) principle and comparison with normal (A)
mode of substrate addition during fed-batch
Biosensors – Emerging Materials and Applications
614
The dynamics of four GFP biosensors have been tested comparatively in a stirred bioreactor
(considered as well-mixed) and a scale-down reactor with a recycle loop (Fig. 10).
Fig. 10. Evolution of the GFP-related fluorescence for the rpoS (A), csiE (B), uspA (C) and
cyaA (D) biosensor in lab-scale bioreactor and in SDR
The cyaA strain has been chosen as a reference and exhibits a strong constitutive GFP
expression throughout the culture. In addition, GFP expression is not affected by the
perturbations induced by the presence of the recycle loop in the case of the SDR experiment.
For the three other reporter strains involving stress promoters, a significant induction is
observed when the bioreactor is shift to the fed-batch mode after 4 hours of cultivation. The
rpoS and csiE exhibits a very low basal level of GFP expression, whereas this basal level is
high in the case of the uspA strain. This quite high basal level has been previously observed
with an equivalent lacZ transcriptional reporter strain cultivated in fed-batch mode (Prytz,
2003). A significant difference has been noticed at the level of the induction profile between
classical and scale-down bioreactor for the rpoS and csiE strains. This environmental
condition seems to be met during the fed-batch culture when the carbon flow inside the
bioreactor is limited in order to avoid dissolved oxygen limitation. In the case of the scale-
down bioreactor experiments, glucose is injected at the level of the recycle loop and
microbial cells are thus exposed to glucose fluctuations. In our case, these fluctuations tend
Applicability of GFP Microbial Whole Cell Biosensors to
Bioreactor Operations: Mathematical Modeling and Related Experimental Tools
615
to slow down the induction dynamics of the promoters associated to the carbon starvation
network. The rpoS promoter induces the expression of the sigma S factor, i.e. the master
regulator of the general stress response when E. coli is carbon limited or starved (Storz,
2000). Interestingly, the csiE promoter is sigma S dependent (Marschall, 1995) and exhibits
also a significant difference of level of induction when the corresponding reporter strain is
cultivated in SDR. The uspA reporter strain shows no significant difference at the level of the
GFP intensity when the culture is performed in classical bioreactor or in SDR. In all cases,
the three stress promoters (the cyaA being considered as constitutive) show a significant
increase in their level of induction when cultures are shifted to fed-batch mode. This
observation can be attributed to the fact that the rpoS, cisE and uspA promoters are known to
be induced in carbon limiting conditions which is the case in our fed-batch experiments. At
this stage, it is important to relate biosensor response to environmental perturbations
experienced in SDR. This point will be discussed in the next section.
5. Mathematical modelling of the local heterogeneities met by microbial cells
in scale-down bioreactors
The characterization of the environmental fluctuations perceived by microbial biosensors is
an essential step in order to understand the dynamics of GFP expression. However, the
extracellular perturbations perceived at the single cell level involve several components
including bioreactor hydrodynamics, but also the displacement of the microbial cells
themselves along the gradient field. The purpose of the next two sections is to provide the
reader with basic and advanced mathematical tools in order to simulate concentration
fluctuations perceived at the single cell level in a SDR.
5.1 Simulation of the concentration gradient fields inside bioreactors
The appearance of concentration gradients (substrate, dissolved oxygen, pH,…) in large-
scale bioreactors can have severe consequences at the level of the viability of the
microorganisms and thus at the level of the bioprocesses performances. The characterization
of these gradients in function of the bioreactor design modification and the up-scaling
procedures is of particular importance and is generally achieved by the aim of structured
hydrodynamic models that can be classified into three distinct classes with increasing level
of complexity (Guillard F., 1999). The simplest structured hydrodynamic model is based on
a rough compartimentalisation of the bioreactor in a few virtual fluid zones. This kind of
model has been used with success to characterize axial concentration gradient in multi-
impeller systems (Mayr B., 1993, Vrabel P., 2001, Machon V., 2000, Cui Y.Q., 1996,
Vasconcelos J.M.T., 1995). The advantage of such model relies on its simple physical and
mathematical representation, i.e. respectively mass balance and ordinary differential
equations, for the expression of the time evolution of a given chemical species in each
compartment, allowing to connect the hydrodynamic modeling procedure with complex
microbial growth model (Vrabel P., 2001). However, the compartment model is limited by
its poor spatial resolution. This problem has been overcome by the use of network-of-zones
(NOZ) models. The NOZ model is based on the same physical and mathematical principles
than for the compartment model, but in this case the number of virtual fluid zones has been
significantly increased, allowing a higher spatial discretization of the bioreactor domain.
NOZ models comprising up to 36,000 fluid zones have been used (Hristov H.V., 2004) and