Biosensors for Health Environment and Biosecurity Part 6 docx
Bạn đang xem bản rút gọn của tài liệu. Xem và tải ngay bản đầy đủ của tài liệu tại đây (2.47 MB, 35 trang )
Biosensors for Health, Environment and Biosecurity
166
antibodies was observed with an optical technique. Although this original 'immunosensor'
was over 59 years old at the time, the concept of a biosensor was first brought forward in
1995 by Jin and Hans and used to study biomolecular interactions (Jin et al., 1995, 1996). A
biomolecule layer composed of a common protein, such as fibrinogen, human serum
albumin, or human immunoglobulin G, was spread on the surface of the sensor. The
interaction between general proteins such as fibrinogen and an antibody against fibrinogen
was then investigated. However, biosensor detection of clinical samples was only recently
developed, such as detection of disease markers and viruses and investigation of
interactions between antibodies and antigens related to clinical diagnoses (Jin et al., 2011; Qi
et al., 2009a).
2.2 Technical characteristics of the biosensor based on ellipsometry
The principle of the biosensor has been discussed in several reports (Jin et al., 2011; Z.H.
Wang et al., 2006). Here, we list some key technical characteristics of biosensors based on
ellipsometry:
• Label-free
When the interaction between biomolecules occurs, the variation of the molecular mass surface
concentration on the surface is identified by the biosensor based on ellipsometry without label
(e.g., the horseradish peroxidase used in enzyme-linked immunosorbent assays).
• High-throughput
Combined with a microfluidic array reactor, which fabricates the chips, the biosensor based
on ellipsometry has become an automatic and high-throughput system by adding ligand,
washing, blocking, and reacting samples. Recently, an 8×6 biomolecule reactor-array was
developed as a promising technique for a parallel protein assay. The 48 protein arrays in the
8×6 matrix are shown in Figure 1 (Jin, 2008). Interaction of common protein, detection of five
hepatitis B virus markers in patient serum, detection of different ladder concentrations, and
the detection sensitivity of CD146 (known as the melanoma cell adhesion molecule or cell
surface glycoprotein MUC18) (Guezguez B, 2007) are presented on the chip.
• Rapid
Using the automatic program of the microfluidic array reactor to add ligands, washing,
blocking, and reacting samples, ligands screening and detection of markers can be
accomplished in 1 to 2 h.
• Low sample consumption
Consumption of ligands and samples is on the microliter level. For example, in hepatitis B
virus detection, hepatitis B virus ligand consumption is 10 μl/area (The area is a small
squareness area, see Figure 1.), and hepatitis B virus serum consumption is 40 μl/area (Qi, et
al. 2009a). Enzyme-linked immunosorbent assays in milliliter level require a larger volume
of the same concentration.
• Low damage to the biomolecules
The biosensor works via an optical, reflection-based technique that uses polarized light to
determine the optical properties of a sample (Z.H. Wang, et al., 2003a). It is almost “touch-
free” to read the detection result, so there is a decreased effect to bioactivity than, for
instance, atomic force microscopy and surface-enhanced laser desorption/ionization.
• High sensitivity
The biosensor displays different detection sensitivity toward different samples. For
example, the sensitivity of the biosensor for detecting antigen markers, such as hepatitis B
Label-free Biosensors for Health Applications
167
virus surface antigen, reaches 1 ng/ml (Qi, et al. 2009a), while the detection sensitivity of
CD146 is < 1 ng/ml (see Figure 1: F5, F6, and F7 areas).
Fig. 1. Forty-eight protein arrays in a matrix. Left: The visual result of a protein micro-array.
Right: The detailed reactants relative to the left graph (Jin, 2008).
• Automatic control
Some parameters of the microfluidic array reactor, such as the position number of the
sample plate, flow velocity in the microfluidic array reactor of sample or ligand, time of
immobilization or reaction, and number of cycles, can be edited in the automatic program.
• Visualization of results
Visualized gray-scale images are offered by imaging ellipsometry in several seconds, which
is shown on a computer screen. The target interacting ligands on the surface can be
identified by values in gray-scale with associated software.
• Quantitative detection
Combined with the calibration curve method, disease markers and viruses in samples can
be detected easily and quantitatively with the label-free biosensor.
2.3 Operational process of the biosensor based on ellipsometry
The operational process of the biosensor, which includes surface modification, ligand
immobilization, biomolecule interaction, and result reading, is shown in Figure 2.
Surface modification is a process by which chemical reagents for reactive groups on the
silicone surface for biomolecule immobilization Surface modification has two obvious
functions: one is the presentation of ligand on the biosensing surface; and the other is to
prevent nonspecific binding (Jin, 2008). Presently, surface modification methods include
physical adsorption, chemical covalent immobilization, and biologic modification. Physical
adsorption is seldom used because the immobilized proteins suffer partial denaturation and
tend to leach or wash off of the surface and compete with adsorption (Bhatia, et al., 1989).
Biosensors for Health, Environment and Biosecurity
168
Chemical covalent immobilization is often used to immobilize proteins due to the strong,
stable linkage, and biological modification is a future direction because it provides oriented
immobilization and better biological compatibility. Aldehyde modification, carboxyl
modification, and biologically oriented immobilization are often used in biomedical
applications (Qi, et al., 2010, 2009b; Z.H. Wang & Jin, 2004, 2003a).
Fig. 2. Operational process of the biosensor based on ellipsometry. Antibodies (or antigens)
can be immobilized as ligands to each patterned area as a bio-probe on the modified surface
of a silicon substrate. Each bio-probe can capture its corresponding antigens (or antibodies)
in a test sample pumped by microfluidic reactor. When the corresponding antigens (or
antibodies) in the solution interact with the bio-probes, forming a complex, the surface
concentration becomes higher than the initial bio-probe layer. The distribution of the lateral
protein layer pattern is simultaneously detected by imaging ellipsometry, which may
further point to the existence of antigens (or antibodies) in the tested solution (Jin, 2008).
3. Applications in the health field
In the field of human health, there is an increasing demand for inexpensive and reliable
sensors to quickly detect and analyze various and rapidly changing disease markers. For
example, patients frequently display rapid variations in biochemical levels of disease
markers such as C-reactive protein that require instant assays to detect. Indeed, early
detection and diagnosis can be used to greatly reduce the cost of patient care associated with
the advanced stages of many diseases. More than a hundred types of proteins recognized as
diseases markers can be detected by traditional analytical techniques such as enzyme-linked
immunosorbent assays. However, based on the above features of the ellipsometry-based
biosensor, it has also been widely used to detect and monitor biomolecule interactions,
especially for biomedical applications. A sample focusing on tumor marker detection is
shown in Figure 3.
The ability to detect pathogenic and physiologically relevant biomolecules in the body with
high sensitivity and specificity offers the opportunity for early diagnosis and treatment of
diseases.
Label-free Biosensors for Health Applications
169
Fig. 3. Application of the biosensor. The use of biosensors to detect tumor markers in serum
has spread widely (Jin, 2011).
3.1 The interaction of antigens with antibodies in healthy and diseased subjects
The initial impetus for advancing biosensors based on ellipsometry came from detection of
the interaction of general antibodies and antigens, and some basic methods have been
established, such as the ligand immobilization, high specificity probe screening, protein
delivery, biomolecule affinity presentation on a chip, specific interactions, the influence of
nonspecific binding, detection sensitivity, sample consumption, and calibration curves for
quantitative detection.
3.1.1 Detection of antigen-antibody interactions
In biomedicine, human fibrinogen, hepatitis B surface antigen, human immuoglobulin G,
and human serum albumin are often used as mode proteins. Using the aforementioned
proteins as models with the biosensor, the feasibility is shown in Figure 4. Significant
increases of gray-scale value appear in the square areas exposed to the corresponding target
(Jin, et al., 2003). These results demonstrate that target samples can be identified by the
ellipsometry-based biosensor.
3.1.2 Real-time detection of the antibody-antigen interaction
The biosensor based on ellipsometry can monitor protein interactions in situ and in real time
to provide protein interaction kinetics information, such as association rate, dissociation
rate, and affinity constants. Some special operation details of real-time detection are shown.
• Model proteins were prepared and immobilized on the substrate;
• The chip was inserted into the reaction cell;
• A mixture of antiserum containing corresponding antibody was poured into the
reaction cell;
Biosensors for Health, Environment and Biosecurity
170
• A series of images (in gray-scale) of several binding processes between antibodies in
solution and antigens were recorded by the biosensor; and
• The surface concentrations of analytes in the analytical areas of each image were
measured and plotted versus time to determine the real-time binding curves.
Fig. 4. Detection of several model proteins using the biosensor based on ellipsometry. Model
proteins Fib, AntiHBsA, IgG and HSA were immobilized in four different columns,
respectively. Phosphate-buffered saline was added to one area as a reference control.
Corresponding target was then added to the other two areas in the column. (Z.H. Wang &
Jin, 2003b)
Fig. 5. Binding curves of anti-fibrinogen/fibrinogen (■), anti-human
immunoglobulin/human immunoglobulin (●), and anti-human serum albumin/human
serum albumin (▲) obtained by the biosensor (Z.H. Wang & Jin, 2003b).
The real-time binding curves are shown in Figure 5. Detailed data processing and kinetics
analysis was performed according to the method described in the literature (Malmborg, et
al., 1992). In a clinical setting, a patient’s serum is a mixture similar to that used to generate
Label-free Biosensors for Health Applications
171
Figure 5, containing antibodies against fibrinogen, human serum albumin, and human
immunoglobulin. A chip contains many immobilized ligands that bind to the same marker
in serum but with different binding affinities. The biosensor offers a convenient way to
compare these ligands’ binding affinities under the same conditions, and ligands with high
affinity can be screened. The convenient way comparing these ligands’ binding affinities
might compare the effectiveness of drug and screen drug, so the ability to sense multiple
interactions in real-time makes the biosensor particularly well suited for monitoring disease
progress, screening for highly effective drugs, and understanding disease mechanisms.
The interaction of antigens and antibodies produced in healthy and diseased subjects (e.g.,
hepatitis B markers antibodies and antigens (Qi, et al., 2009a), severe acute respiratory
syndrome virus particles and antibodies (Qi, et al., 2006a), ricin antibody screening (ricin
found in castor beans is one of the most potent plant toxins) (Niu, et al., 2010), and others)
has been studied by the biosensor based on ellipsometry. These studies demonstrate the
biosensor’s use for health applications.
3.2 Disease markers and virus detection
Protein markers should be specific and sensitive and have prognostic value. Efforts to
discover disease markers have focused on elucidating serum molecules that have diagnostic
and prognostic value (Schena, 2005). High-throughput biosensors, including the biosensor
based on ellipsometry, may shorten the time required to find disease markers. In this
respect, biosensors are the best choice among the current techniques.
3.2.1 Qualitative detection of five hepatitis B virus markers
Hepatitis B virus is a human hepadnavirus that causes acute and chronic hepatitis and
hepatocellular carcinoma (Bai, et al., 2003). The detection of hepatitis B virus markers is
clinically important for the diagnosis of infection with this virus (Chen, et al., 2006). Five
markers of hepatitis B virus (including hepatitis B surface antigen, the hepatitis B surface
antibody, hepatitis B e antigen, hepatitis B e antibody, and hepatitis B core antibody) are a
group of general markers used in the monitoring of hepatitis B virus infection. Following
key steps of detection markers were operated for clinical application:
• Screening for highly effective probes;
• Detection sensitivity; and
• Optimization of detection conditions.
Presently, several probes can be simultaneously compared by the biosensor on one chip,
which is shown in Figure 6. For the same target, different probes present different values in
the grayscale, which indicates that the various probes have different bioactivities. Thus,
highly effective probes were found for sensitive clinical diagnosis.
Sensitivity is important for hepatitis B marker detection. Hepatitis B surface antibody and
hepatitis B surface antigen national positive reference samples (from the National Institute
for the Control of Pharmaceutical and Biological Products (China)) were detected by the
biosensor in 2009. The detection sensitivity of hepatitis B surface antigen is 1 ng/ml, and the
detection sensitivity of hepatitis B surface antibody is > 1 IU/ml. Thus, the sensitivity has
already reached clinical standards.
The biosensor based on ellipsometry permits multiplexed analysis. It can detect the five
Hepatitis B markers of several patients simultaneously in about 1 h, proving its feasibility in
clinical diagnosis. High affective probes increase sensitivity and resolving power. Other
Biosensors for Health, Environment and Biosecurity
172
biosensor advantages, such as higher sensitivity, a simplified process, and short test time,
are also significant for rapid diagnosis.
Fig. 6. Screening of hepatitis B ligands. (a) Screening of hepatitis B surface antibody and
hepatitis B surface antigen. Different lots of hepatitis B surface antibody (sAb) and antigen
(sAg) ligands were first immobilized in different rows. After blocking with BSA, the first
row was used as a control. Different lots of hepatitis B surface antigen and hepatitis B
surface antibody markers were detected in different rows. (b) Screening for hepatitis B e
antibody and hepatitis B e antigen. The italics indicate results with the largest variation in
gray-scale values, which in turn indicate that the ligands had higher bioactivity (Qi, et al.,
2009a).
3.2.2 Quantitative detection of breast cancer marker: Carbohydrate antigen 15-3
In 2008, an estimated 636,000 cases of breast cancer were diagnosed in high resource
countries, while an additional 514,000 cases were diagnosed in low and middle resource
countries, where it has now become the most common female cancer (El Saghir, et al., 2011).
Carbohydrate antigen 15-3 is frequently measured as a breast cancer marker test using the
biosensor based on ellipsometry (Zhang, et al., 2005). According to Figure 2, quantitative
analysis of carbohydrate antigen 15-3 was performed using the calibration curve method:
• A serum sample with a known concentration of carbohydrate antigen 15-3 was serially
diluted;
• These various concentrations were detected;
• A calibration curve was drawn using the 15-3 concentration as the abscissa and the
gray-scale value as the vertical axis;
• An unknown sample was analyzed; and
• The concentration of 15-3 in the unknown sample was determined with the calibration
curve.
The concentration of carbohydrate antigen 15-3 in a serum sample had been determined by
an electrochemiluminescence immunoassay. The serum sample with known concentration is
used as standard sample to make a calibration curve of the biosensor. The calibration curve
of carbohydrate antigen 15-3 detection is shown in Figure 7. The index period of the curve is
0~20 kIU/L, corresponding to gray-scale values of 58~99. If the concentration exceed the
Label-free Biosensors for Health Applications
173
detection scope (0~20 kIU/L), the unknown test samples must be diluted; the lower limit of
detection is 1 kIU/L. The realization of quantitative label-free detection of a cancer marker
may aid in earlier diagnosis, monitoring the course of the disease, even exploring the
mechanism of cancer.
Fig. 7. Calibration curve for carbohydrate antigen 15-3 concentration detection (Zhang, et al.,
2005).
3.2.3 Detection of tumor markers
Analyzing only one tumor marker is insufficient to diagnose cancer in 2010, a review
exhibited a novel co-detection of three common tumor markers: alpha-fetoprotein, alpha-L-
fucosidase, and ferritin (Jin, 2011). Thus, quantitative analysis was performed by the
biosensor with the following calibration curve method:
• A chip was designed to simultaneously detect three markers in a sample;
• A calibration curve for the biosensor was plotted;
• A cut off value was determined by the receiver operating characteristic; and
• The three markers in a clinical serum sample were examined on a chip.
Detection results of several patients’ markers were compared and analyzed. Sensitivity
reached the ng/ml or U/L level. Thirty-two normal sera and 24 liver cancer patient sera
were quantitatively analyzed. The realization of simultaneous detection of several markers
by the biosensor may increase diagnostic specificity in a clinical setting.
3.2.4 Detection of phage M13KO7 for building virus a detection model
Phages are estimated to be the most widely distributed and diverse entities in all reservoirs
populated by bacterial hosts. In 2009, Phage M13KO7 was detected by the biosensor based
on ellipsometry as a model for virus detection. A highly versatile and powerful virus
detection platform has been established (Qi, et al., 2009b). Based on common
antibody/antigen or disease marker detection, three key steps (e.g., ligand immobilization,
sensitivity detection, and microscopic confirmation) were optimized.
Biosensors for Health, Environment and Biosecurity
174
The avidin/biotin method (Fig. 8) was chosen to immobilize the antibody bio-GP3 against
phage M13KO7. The avidin/biotin immobilization method is often used in other
immunoassays (Vijayendran & Leckband, 2001). It has several advantages: 1) ligands are
strongly immobilized because biotin and avidin can specifically interact with stronger
affinity (~10
15
M
−1
) than the antibody-antigen interaction (~10
5
-10
12
M
−1
) (Friguet, et al., 1985;
Malmborg, et al., 1992); 2) immobilization is oriented, which helps antibody display its Fab
domain for improved sensitivity; and 3) it may offer a more physiological environment.
Fig. 8. Avidin/biotin immobilization method (Vijayendran & Leckband, 2001).
The sensitivity of phage M13KO7 detection can reach 10
9
plaque forming units/ml. Phage
detection results by the biosensor have been confirmed with atomic force microscope.
Imaging indicates that the biosensor can capture whole viruses, not just fragments. Thus, the
virus detection biosensor platform has potential applications for human health.
3.2.5 Detection of avian influenza virus
According to World Health Organization statistics, the number of cases of avian influenza
virus H5N1 directly crossing barriers and infecting humans was 534, causing 316 deaths by
March 2011 (World Health Organization, 2011). Avian influenza virus subtype H5 can be
detected with the biosensor based on ellipsometry using the above virus detection platform.
The oriented immobilization of probe was realized using protein A and antibody for avian
influenza virus detection. Figure 9 (A) shows the probe immobilization method. This is a
kind of biological immobilization, which also offers a more physiologically relevant
environment to maintain the bioactivity of the probe (Qi, et al., 2010). The results show that
4A4 antibody can react specifically with avian influenza virus subtype H5N1, while CAM4
can interact with both H5N1 and H9N2.
The sensitivity of H5N1 detection is 2.56×10
−3
tissue culture infectious dose/ml, which is
more sensitive than a lateral-flow immunoassay (Remel Inc.). The corresponding areas were
scanned with near-field optical microscopy. The microscopic evidence is presented in Figure
10, showing that intact avian influenza virus particles were bound. Direct virus detection
may help with earlier diagnosis than disease marker detection.
3.2.6 Detection of other disease markers and viruses
C-reactive protein (Zhu, et al., 2007), soluble angiopoietin receptor Tie-2 (C.L. Wang, et al.,
2009), thymidine phosphorylase (Li, et al., 2004), Alzheimer's disease tau protein (Qi, et al.,
2006b), and others had also been detected using the biosensor. These diseases markers are
closely related to human health. Thus, qualitative or quantitative detection with the
biosensor can aid in earlier disease diagnosis and improve health.
Label-free Biosensors for Health Applications
175
Fig. 9. Detection of avian influenza virus samples using the biosensor based on ellipsometry.
(A) Schematic illustration. Avian influenza virus antibody is immobilized on the substrate.
(B) Experimental image in gray-scale and a 3-D gray-scale distribution map. Antibody
CAM4 was immobilized in columns ‘a’ and ‘b’; 4A4 in columns ‘c’ and ‘d’; H5N1, H9N2 and
the control are shown in rows ‘1’, ‘2’, and ‘3’, respectively (Qi, et al., 2010).
Fig. 10. Near-field optical microscopy images of H5N1. (A) and (B) Shear force mode images
for H9N2 and H5N1, respectively. (C) Reflection mode image of H5N1. (D) 3-D reflection
mode image of H5N1 (Qi, et al., 2010).
3.3 Clinical diagnosis and control of emerging infectious diseases
The ability of the biosensor based on ellipsometry to detect antibodies or antigens, disease
markers, and viruses from patient samples with high sensitivity and specificity offers a
Biosensors for Health, Environment and Biosecurity
176
powerful opportunity in early diagnosis and treatment of diseases. Related clinical
applications have begun.
3.3.1 Clinical diagnosis of hepatitis B patients’ sera
Hepatitis B virus infection is the most common cause of chronic liver diseases; an estimated
350 million people are chronically infected with hepatitis B virus worldwide (Sun, et al.,
2002). Further, hepatitis B virus infection plays an important role in the development of
hepatocellular carcinoma (De Mitri, et al., 2010). A rapid, simple, and direct method is
urgently needed for clinical hepatitis B diagnosis. In section 3.2.1, the screening probe,
standard national reference sample detection, and highly sensitive hepatitis B detection
results demonstrated that the biosensor based on ellipsometry is feasible for clinical
diagnosis of the disease (Z.H. Wang, et al., 2006; Jin, et al., 2004). Thus, the application of the
biosensor based on ellipsometry could greatly enhance hepatitis B detection speed.
Cut-off values are important for clinical diagnosis of hepatitis B and it detection by the
biosensor based on ellipsometry. The cut-off value can help us to distinguish between strong
positive, near cut-off, and negative samples. Other diagnosis techniques, such as enzyme-
linked immunosorbent assays, have cut-off value instructions included in the assay kits (Qi,
et al., 2009a). The cut-off value of the biosensor was determined with a receiver operating
characteristic curve. With the cut-off value, the detection of five hepatitis B virus markers by
the biosensor was consistent with enzyme-linked immunosorbent assays.
Sera from 169 patients were analyzed with the biosensor for the purpose of clinical
diagnosis. Samples from 60 patients included clinical information of hepatitis B from
Shandong Provincial Hospital from qualitative enzyme-linked immunosorbent assay
detection results (the assay kit was produced by Shanghai Rongsheng Biotech Co. Ltd). The
remaining samples were from patients from the Tientsin Blood Disease Hospital and also
included clinical information of hepatitis B (the assay kit was produced by Beijing Wantai
Co Ltd.) Figure 11 shows the detection results of 109 hepatitis B patients’ sera samples from
Fig. 11. Comparison of hepatitis B surface antigen detection by the biosensor based on
ellipsometry (■) and by enzyme-linked immunosorbent assays (△) (Qi, et al., 2009a).
Label-free Biosensors for Health Applications
177
the Tientsin Blood Disease Hospital. The hepatitis B surface antigen detection results using
the biosensor are compared with those of enzyme-linked immunosorbent assays. Regression
analysis revealed that the results are in good agreement between the two methods
(r=0.67>r
0.01
=0.247).
The biosensor based on ellipsometry allows the multiplexed analysis and detection of five
hepatitis B virus markers in clinical samples. The biosensor has a simplified process and
short test time, which can detect the five markers from several patients simultaneously in
about 1 h. The higher throughput of the biosensor may enable improved setup for detection
sensitivity, time, and accuracy in the future.
3.3.2 Quantitative detection of clinical sera from breast cancer patients
Breast cancer incidence rates vary widely across the world, from 19.3 per 100,000 women
per year in Eastern Africa to 89.9 per 100,000 women per year in Western Europe (Ferlay, et
al., 2010). Carbohydrate antigen 15-3 is particularly valuable for treatment monitoring in
patients that have breast cancer that cannot be evaluated using existing radiological
procedures. Carbohydrate antigen 15-3 is also used during the postoperative surveillance of
asymptomatic women who have undergone surgery for invasive breast cancer.
Using the quantitative calibration curve in section 3.2.2, 60 clinical patients’ serum samples
were quantitatively analyzed with the biosensor, including 24 women with intraductal
carcinoma, 15 with mucinous carcinoma, 5 with in situ lobular carcinoma, 2 with medullary
carcinoma, and 14 with breast diseases but no evidence of cancer (Zhang, et al., 2005). Thirty
healthy sera were also collected. The median patient age was 48.5 years. These clinical sera
samples were examined with both the biosensor based on ellipsometry and
electrochemiluminescence immunoassays (Elecsys 2010 system, Roche Diagnostics) via the
double-blinded method. The electrochemiluminescence immunoassay is the gold standard
of breast cancer marker carbohydrate antigen 15-3 detection. A receiver operating
characteristic plot curve (Handley, et al., 1982) was used to determine the result of the
biosensor based on ellipsometry, which is shown in Figure 12.
Fig. 12. Receiver operating characteristic curve analysis of the data from the biosensor based
on ellipsometry and electrochemiluminescence immunoassays (Zhang, et al., 2005).
Biosensors for Health, Environment and Biosecurity
178
The result of this analysis proved that the biosensor results are consistent with those of the
electrochemiluminescence immunoassay, reaching the clinical diagnosis standard level.
3.3.3 Clinical detection of sera from severe acute respiratory syndrome coronavirus
(SARS-CoV)-infected patients
The outbreak of SARS in late 2002 in southeast China spread rapidly to over 30 countries
and resulted in more than 800 deaths (Poutanen, et al., 2003; Feng & Gao, 2007). In 2003, the
biosensor based on ellipsometry was used to detect the infectious pathogens.
Before analyzing clinical SARS patients’ sera, some antibodies from a phage-display library
were identified by the biosensor. SARS-CoV virions were used as a probe by the biosensor
to assess the efficiency of the antibodies b1 and h12. The identification of new and effective
antibodies is significant for more accurate diagnosis of the illness and the development of a
vaccine.
Ten SARS patients and 12 healthy volunteers (controls) were tested with the biosensor.
SARS-CoV virions were immobilized on the surface as the probe to detect antibodies in the
patients’ sera (Figure 13). From the analysis of the results, different patients had different
antibody contents, which might help doctors estimate disease progress. The entire detection
process only requires approximately 40 min.
Fig. 13. Analysis of SARS patients’ serum samples using the biosensor based on imaging
ellipsometry. a1~12 are negative samples; b1~12 are SARS patients; and c1~12 are blank
controls (Qi, et al., 2005).
The real-time function of the biosensor was mentioned above in section 3.1.2. The kinetic
process of interaction between the antibodies and SARS virus was analyzed with the
biosensor. The affinity of antibodies b1 and h12 for SARS virus are 9.5×10
6
M
−1
and 1.36×10
7
M
−1
, respectively. Real-time detection revealed that antibody h12 has a higher affinity for the
virus than antibody b1.
As a label free method, the biosensor based on ellipsometry is a competent mechanism for
analyzing clinical serum samples from SARS patients and the affinity between these
antibodies and the SARS coronavirus. Compared with surface plasmon resonance (SPR), a
fairly widely applied optical detection method for real-time detect interaction of
biomolecules (Hall, et al., 2010), the biosensor also allows label-free samples and crude
samples to be used directly without previous purification. The biosensor based on
ellipsometry has advantages such as: 1) lower cost (e.g., a piece of the biosensor based on
ellipsometry silicon wafer is about $1, while a piece of surface plasmon resonance glass slide
costs about $70-80); 2) the biosensor can provide 24 real-time curves simultaneously,
Label-free Biosensors for Health Applications
179
allowing high-throughput detection; and 3) multiplex microarray was imaged and offered
an image.
3.4 Market potential for scientific research related to the health field
The continual development of the biosensor based on ellipsometry shows both market
potential for scientific research related to the health field and an increasing number of
applications for basic biology research. The following are two applications of the biosensor
on vesicular membrane proteins, demonstrating its value to general biology.
3.4.1 Detection of interaction among vesicular membrane fusion proteins
Membrane-associated proteins provide the minimal fusion machinery necessary for cellular
vesicles to fuse to target organelle membranes in eukaryotic cells (Jahn & Scheller, 2006).
The qualitative and quantitative identification of membrane-associated proteins interactions
is the key to understanding the mechanisms of membrane fusion, which is vital for cell
division, cellular structure organization, and biological information processing (Zhang, et
al., 2009). To investigate the characteristics of these newly discovered membrane-associated
protein pairs such as: Sec22, Ykt6, Sso2 and Sso1, the biosensor based on ellipsometry was
used to detect the interactions among soluble N-ethylmaleimide-sensitive factor attachment
protein receptors (SNAREs, a kind of protein that assembles into coiled-coil tetramers to
promote membrane fusion). The interactions among several SNAREs (i.e., Sec22, Ykt6, Sso1,
and Sso2) were analyzed by the biosensor based on ellipsometry. The in vitro detection
results from the biosensor are consistent with the results of yeast two-hybrid assays at the
domain level in vivo (Zhang, et al., 2009; Jin et al., 2011). Further, the kinetic binding process
of two SNAREs (Ykt6 and Sso2) was measured using the real-time function of the biosensor.
The rapid detection and identification of vesicular protein–protein interactions is essential
for understanding vesicle trafficking and for understanding the system-level organization of
cellular structure, biological information processing, and molecular mechanisms.
3.4.2 Vesicle adsorption visualization
Recently, a type of total internal reflection imaging ellipsometry was developed for real-time
detection of biomolecular interactions (Jin, et al., 2011). This method was used to
visualization the of vesicles adsorption process. Non-specific adsorption and desorption on
a poly-L-lysine-modified gold surface was analyzed with real-time curves by the biosensor.
The biosensor results were consistent with a phase contrast microscopy (NIKON, TI-U,
Japan) results. The vesicle adsorption and desorption processes visualized by the biosensor
are significant to the study of cell membrane properties. Micron target detection is the future
aim of the biosensor based on total internal reflection imaging ellipsometry. Therefore, we
expect that the biosensor based on ellipsometry has a yet-unexploited huge market potential
for application in biological basic research related to the health field.
4. Summary
In the human health field, the biosensor based on ellipsometry is widely used to monitor or
detect biological molecules for applications ranging from common infectious diseases to
cancers. Some adaptations of this system for biomedical and clinical applications (e.g.,
disease marker detection, virus detection, and real-time monitoring) have been developed.
Biosensors for Health, Environment and Biosecurity
180
With recent progress on vesicular membrane proteins, the biosensor based on ellipsometry
technology also shows significant promise in basic biological research. Furthermore,
through miniaturization, it is possible to fabricate the biosensors that are portable, low-cost,
high-throughput, and highly sensitive for diseases such as HIV/AIDS. As the biosensor
based on ellipsometry becomes simpler and more widely available, we expect to see a
proliferation of uses in conjunction with telecommunications equipment. Wide application
of the biosensor based on ellipsometry will be explored in monitoring personal health, the
food we consume, and our environment in the future.
5. Acknowledgements
Work in GFG’s laboratory is supported by China Ministry of Science and Technology
(MOST Project 973, Grant No. 2011CB504703). GFG is a leading principal investigator of
Innovative Research Group of National Natural Science Foundation of China (NSFC, Grant
No. 81021003). JG and QC acknowledges financial support from the National Basic Research
Program of China 2009CB320300, the National Basic Research Program (Project 973) of
China (2007CB310505) Chinese Academy of Sciences (KJCX2-YW-Mo3 and -M04), Nature
Science Foundation of Shandong Province (Q2007C07), the Basic Scientific Research Special
Foundation of Chinese Academy of Inspection and Quarantine (2010JK002).
6. References
Bai, Y.J.; Zhao, J.R.; Lv, G.T.; Zhang, W.H.; Wang, Y. & Yan, X.J. (2003). Rapid and high
throughput detection of HBV YMDD mutants with fluorescence polarization. World
J Gastroenterol 9(10): 2344-2347.
Bhatia, S.K.; Shriver-Lake, L.C.; Prior, K.J.; Georger, J.H.; Calvert, J.M.; Bredehorst, R. &
Ligler, F.S. (1989). Use of thiol-terminal silanes and heterobifunctional crosslinkers
for immobilization of antibodies on silica surfaces. Anal Biochem 178(2): 408-413.
Chen, Y.; Wu, W.; Li, L.J.; Lou, B.; Zhang, J. & Fan, J. (2006). Comparison of the results for
three automated immunoassay systems in determining serum HBV markers. Clin
Chim Acta 372(1–2): 129–133.
De Mitri, M.S.; Cassini, R, & Bernardi, M. (2010). Hepatitis B virus-related
hepatocarcinogenesis: molecular oncogenic potential of clear or occult infections.
Eur J Cancer 46(12): 2178-2186.
El Saghir, N.S.; Adebamowo, C.A.; Anderson, B.O.; Carlson, R.W.; Bird, P.A.; Corbex, M.;
Badwe, R.A.; Bushnaq, M.A.; Eniu, A.; Gralow, J.R.; Harness, J.K.; Masetti, R.;
Perry, F.; Samiei, M.; Thomas, D.B.; Wiafe-Addai, B.& Cazap, E.(2011). Breast
cancer management in low resource countries (LRCs): Consensus statement from
the Breast Health Global Initiative. Breast. Pressing
Feng, Y. & Gao, G.F. (2007). Towards our understanding of SARS-CoV, an emerging and
devastating but quickly conquered virus. Comp Immunol Microbiol Infect Dis 30(5-6):
309-327.
Ferlay, J.; Shin, H.R.; Bray, F.; Forman, D.; Mathers, C. & Parkin, D.M. (2010). Estimates of
worldwide burden of cancer in 2008: GLOBOCAN 2008. Int J Cancer 127(12): 2893-
2917
Label-free Biosensors for Health Applications
181
Friguet, B.; Chaffotte, A.F.; Djavadi-Ohaniance, L. & Goldberg, M.E. (1985). Measurements
of the true affinity constant in solution of antigen-antibody complexes by enzyme-
linked immunosorbent assay. J Immunol Methods 77(2): 305-19.
Guezguez, B.; Vigneron, P.; Lamerant, N.; Kieda, C.; Jaffredo, T. & Dunon, D. (2007). Dual
role of melanoma cell adhesion molecule (MCAM)/CD146 in lymphocyte
endothelium interaction: MCAM/CD146 promotes rolling via microvilli induction
in lymphocyte and is an endothelial adhesion receptor. J Immunol 179(10):6673-
6685.
Hall, K. & Aguilar, M.I. (2010). Surface plasmon resonance spectroscopy for studying the
membrane binding of antimicrobial peptides. Methods Mol Biol 627(2): 13-23.
Handley, J.A. & McNeil, B.J. (1982). The meaning and use of the area under a receiver
operating characteristic (ROC) curve. Radiology 143(1): 29–36.
Jahn, R.& Scheller, RH. (2006). SNAREs engines for membrane fusion. Nat Rev Mol Cell Biol
7(9):631-43.
Jin, G.; Tengvall, P.; Lundstrom, I. & Arwin, H. (1995). Abiosensor concept based on
imaging ellipsometry for visualization of biomolecular interactions. Anal Biochem
232(1):69–72.
Jin, G.; Jansson, R. & Arwin, H. (1996). Imaging ellipsometry revisited: developments for
visualization of thin transparent layers on silicon substrates. Rev Sci Instrum 67(8):
2930-2936.
Jin,G.; Wang,Z.H.; Qi,C.; Zhao,Z.Y.; Chen,S.; Meng,Y.H.; Ying,P.Q.; Xia, L.H.& Wan,L.J.
(2003). Immune-microassay with optical proteinchip for protein detection.
Proceedings of the 25th annual international conference of the IEEE EMBS, Cancun
Mexico, 3575-3577. Sep 17-21, 2003.
Jin, G.; Zhao, Z.Y.; Wang, Z.H.; Meng, Y.H.; Ying, P.Q.; Chen, S.; Chen, Y.Y.; Qi, C.& Xia,
L.H. (2004). The development of biosensor with imaging ellipsometry. Proceedings
of 26th Annual International Conference of the IEEE Engineering in Medicine and Biology
Society, ISSN: 05891019. San Francisco, CA, United states. September 1-5, 2004.
Jin, G. (2008). Development of biosensor based on imaging ellipsometry. Phys Stat Sol 205(4):
810–816.
Jin, G.; Meng, Y.H.; Liu, L.; Niu, Y.; Chen, S.; Cai, Q.& Jiang, T.J. (2011). Development of
biosensor based on imaging ellipsometry and biomedical applications. Thin Solid
Films 519(9): 2750-2757.
Langmuir, I & Schaefer, VJ. (1936). Optical measurements of the thickness of a film adsorbed
from a solution. J Am Chem Soc 59: 1406
Li, A.L.; Li, H.W.; Zhang, J. & Xiu, R.J. (2004). Initial Study on Thymidine Phosphorylase in
Breast Cancer Tissue by Optical Protein Chip. J of Chinese Microcirculation 8(4): 257-
260.
Malmborg, A.C.; Michaëlsson, A.; Ohlin, M.; Jansson, B. & Borrebaeck, C.A. (1992). Real
time analysis of antibody-antigen reaction kinetics. Scand J Immunol 35(6): 643-650.
Niu, Y.; Zhuang, J.; Liu, L.; Yan, X.Y. & Jin, G. (2011). Two kinds of anti-ricin antibody and
ricin interaction evaluated by biosensor based on imaging ellipsometry. Thin Solid
Films 519(9): 2768-2771.
Poutanen, S.M.; Low, D.E.; Henry, B.; Finkelstein, S.; Rose, D.; Green, K.; Tellier, R.; Draker,
R.; Adachi, D.; Ayers, M.; Chan, A.K.; Skowronski, D.M.; Salit, I.; Simor, A.E.;
Slutsky, A.S.; Doyle, P.W.; Krajden, M.; Petric, M.; Brunham, R.C.; McGeer, A.J.;
National Microbiology Laboratory, Canada.& Canadian Severe Acute Respiratory
Biosensors for Health, Environment and Biosecurity
182
Syndrome Study Team.(2003).Identification of severe acute respiratory syndrome
in Canada. N Engl J Med 348(20):1995-2005.
Qi, C. Duan, JZ. Wang, Z.H., & et al. (2006a). Investigation of interaction between two
neutralizing monoclonal antibodies and SARS virus using biosensor based on
imaging ellipsometry. Biomed Microdevices 8(3): 247–253.
Qi, C.; Hao, R.Q. & Jin, G. (2006b) Detection Alzheimer's disease (AD) tau protein using
protein chip biosensor. Acta Biophysica Sinica 22: 17
Qi, C.; Zhu, W.; Niu, Y.; Zhang, H.G.; Zhu, G.Y.; Meng, Y.H.; Chen, S.& Jin, G. (2009a).
Clinical HBV markers detection with biosensor based on imaging ellipsometry. J
Viral Hepat 16(11):822-832.
Qi, C.; Lin, Y.; Feng, J.; Wang,Z.H.; Zhu, C.F.; Meng, Y.H.; Yan, X.Y.; Wan, L.J.& Jin, G.
(2009b). Phage M13KO7 detection with biosensor based on imaging ellipsometry
and AFM microscopic confirmation. Virus Res 140(1-2): 79-86.
Qi, C.; Tian, X.S.; Chen, S.; Yan, J.H.; Cao, Z.; Tian, K.G.; Gao, G.F.& Jin, G. (2010) . Detection
of avian influenza virus subtype H5 using a biosensor based on imaging
ellipsometry. Biosens Bioelectron 25(6): 1530-1534.
Schena, M. (2005). Protein microarrays. Jones and Bartlett Publishers,Inc. ISBN 0-7637-3127-7.
Canada.
Sun, Z.; Ming, L.; Zhu, X. & Lu, J. (2002). Prevention and control of hepatitis B in China. J
Med Virol 67(3): 447-450.
Vijayendran, R.A. & Leckband, D.E. (2001). A quantitative assessment of heterogeneity for
surface- immobilized proteins. Anal Chem 73(3): 471-480.
Wang, C.L.; Li, J.Q.; Li, H.W.; Jin, G; Wang, Z.H.; Meng, Y.H. & Xiu, R.J. (2009). Soluble
angiopoietin receptor Tie-2 in patients with acute myocardial infarction and its
detection by optical protein-chip. Artif Cells Blood Substit Immobil Biotechnol 37(4):
183-186.
Wang, Z.H. & Jin, G. (2003b). A label-free multisensing immunosensor based on imaging
ellipsometry. Anal chem 75(22):6119-6123.
Wang, Z.H. & Jin, G. (2003a). Feasibility of protein A for the oriented immobilization of
immunoglobulin on silicon surface for a biosensor with imaging ellipsometry. J
Biochem Biophys Methods 57(3): 203-211.
Wang, Z.H. & Jin, G. (2004). Covalent immobilization of proteins for the biosensor based on
imaging ellipsometry. J Immunol Meth 285(2): 237-243.
Wang, Z.H.; Meng, Y.H.; Ying, P.; Qi, C. & Jin, G. (2006). A label-free protein microfluidic
array for parallel immunoassays. Electrophoresis 27(20):4078–4085.
World Health Organization [WHO]. (2011). Available from: March 2011.
/>16/en/index.html
Yan X, Lin Y, Yang D, & et al. (2003). A novel anti-CD146 monoclonal antibody, AA98,
inhibits angiogenesis and tumor growth. Blood 102(1):184-191.
Zhang, H.; Chen, J.; Wang, Y.; Peng, L.; Dong, X.; Lu, Y.; Keating, A.E. & Jiang, T. (2009). A
computationally guided protein-interaction screen uncovers coiled-coil interactions
involved in vesicular trafficking. J Mol Biol 392(1): 228-241.
Zhang, H.G.; Qi, Cai.; Wang, Z.H.; Jin, G.& Xiu, R.J. (2005). Evaluation of a New CA15-3
Protein Assay Method: Optical Protein-Chip System for Clinical Application.
Clinical Chemistry 51(6): 1038-1040.
Zhu, W.; Sun, H.L.; Jin, G.; Qi, C. & Zhao, Z.Y. (2007). Study on ellipsometry-imaging
protein-chip for CRP quantitative detection.
lnt J Lab Med 28
(7): 577-582.
8
Preparation and Characterization of
Immunosensors for Disease Diagnosis
Antonio Aparecido Pupim Ferreira, Cecílio Sadao Fugivara, Hideko
Yamanaka and Assis Vicente Benedetti
Instituto de Química, UNESP - Univ Estadual Paulista
Brazil
1. Introduction
The antigens are viruses, bacteria or part of, toxin or any molecules (organic or inorganic)
that is antigenic (may induce an immunological response and can be recognized by
antibody). The antibody is a glycoprotein which is produced in response of antigenic attack.
Reaction between antigen and antibody by structural complementation is the base of
immunoassay. If the immunological receptor is immobilized on a transducer for detecting a
target analyte the device is called immunosensor. Either antibody or antigen could be
immobilized on the transducer which converts the biological signal into electrical signal.
The immunosensor is classified as optical, mass-sensitive or electrochemical according to the
technique. The electrochemical immunosensor, according to the transducer, is classified as
amperometric, potenciometric, impedimetric, condutometric.
The cells or organs release trace levels of specific glicoprotein, enzymes and hormones into
health patients’ serum but the concentrations increase when they are injured. It means that
the methodology for clinical diagnosis must be sensitive and with high reproducibility and
repeatability. The interaction between antibody and antigen is usually selective presenting
high affinity constant (around 10
15
). Therefore immunosensors are being applied for
diagnosis of various diseases states and also to improve effective drug administration.
Studies on immunosensors like potenciometric (Tang et al., 2005), condutometric (Lu et al.,
2009), piezeletric (Ren et al., 2008, Sener et al., 2010, Pohanka et al., 2007), fiber optic (Kwon
et al., 2002), scanning tunnelling microscopy (Lee et al., 2009) have been published for
disease diagnosis. State of immunoassay technologies for tumor diagnosis (Wu et al., 2007)
and environmental analysis have been reviewed recently (Farre´ et al., 2009).
The results obtained by immunosensor must have reproducibility and repeatability in order
to diagnose the disease or to monitor the disease treatment. Such properties are reached
when the system is well optimized and characterized. On this chapter the amperometric and
impedimetric devices will be focused on the preparation and characterization of the
immunosensor in order to improve its performance.
Usually the complex formed by the affinity reaction between the antigen-antibody is not
electrochemically active. It is possible to monitor the reaction by amperometric technique by
using an enzyme as tracer like classical ELISA (enzyme-linked immunesorbed assay); in this
case instead of absorbance the current intensity is measured. The immunosensor where the
affinity reaction is monitored by tracer is indirect and the format could be classified as
Biosensors for Health, Environment and Biosecurity
184
sandwich, competitive or indirect (Tijssen, 1985). On the other hand, the impedimetric
immunosensor is based on impedance measurement of the electrical equivalent circuit of the
oscillator. Consequently no label is necessary to monitor the affinity reaction.
The kind of electrochemical transducer and technique of receptor immobilization play an
important role on the selectivity of the immunosensor. For instance, gold screen printed
electrode was used for Trypanosoma cruzi (T. cruzi) protein immobilization through self
assembled monolayer (SAM) in order to diagnose Chagas disease (Ferreira et al., 2005).
Anti-human cardiac myoglobin antibody immobilized on carbon screen printed electrode by
passive adsorption (O’Regan, et. al, 2002) was applied as biochemical marker for acute
myocardial infarction (myoglobin) detection; carbon screen printed electrode modified by
multiwall carbon nanotubes (MWCNT) and gold nanoparticles was the platform to
immobilize the antibody P. falciparum for malaria diagnose (Sharma et al., 2008). Glassy
carbon electrode (GCE) was modified by Nafion
®
for competitive detection of anti-
schistosoma japonicum antibody (Zhou et al., 2003); modified with multiwall carbon
nanotubes integrated with microfluidic systems for quantification of prostate specific
antigen in human serum samples (Panini et al., 2008); Fe
3
O
4
magnetic
nanoparticles/chitosan composite film modified GCE for ferritin determination (Wang &
Tan, 2007); GCE functionalized Au nanoparticles for cancer cells detection (Wang & Tan,
2007); bi-layer nano-Au and nickel hexacyanoferrates nanoparticles modified GCE for
determination of carcinoembryonic antigen (Yuan et al., 2009). Phenylboronic acid
conjugated thiol-mixed monolayer on gold wire (Wang et al., 2008) was proposed for alfa
fetoprotein (AFP) detection; such antigen was also detected by microfluidic cell (Maeng et
al., 2008); gold nanowire to differentiate between lung and colon cancer (Patil et al., 2008).
Graphite–epoxy composite (GEC) electrodes as a platform to immobilize tissue
transglutaminase were employed for the autoimmune disorder celiac disease (Pividori et al.,
2009), silver epoxy–graphite composite for cardiac troponins detection (Silva et al., 2010).
Cellular products over-expressed by malignant cells have been used as tumor markers but
one marker could not be specific to a particular tumor. In this case an array of
immunosensor could be the solution (Wu et al., 2007).
Electrochemical impedance spectroscopy (EIS) has been used as a technique for
characterization of electrode surface modification but the analysis of interfacial property
changes is useful also to monitor the biorecognition events involving antibody-antigen
interaction for disease diagnosis. Silver electrodes for interleukin-12 correlated to the
diagnosis of multiple sclerosis (La Belle et al., 2007); electropolymerized nanocomposite film
containing polypyrrole, polypyrrolepropylic acid and Au nanoparticles was developed for
Interleukin 5 which is associated with several allergic diseases (Chen et al., 2008). Gold and
platinum electrodes were investigated to diagonose Chagas disease (Diniz et al., 2003) as
well as gold screen printed electrodes (Ferreira et al., 2010). The transglutaminase was
immobilized on gold screen printed electrode through polyelectrolyte to diagnose celiac
disease (Balkenhohl &Lisdat 2007); the impedance signal after the interaction between the
Ag and Ab was amplified by using secondary HRP-labelled antibody; the main advantage
of impedimetric methodologies (direct immunosensor) was not applied.
Most of amperometric and impedimetric immunosensors published on the literature have
no detailed electrode surface characterization which is important for the reproducibility and
stability of the device.
Preparation and Characterization of Immunosensors for Disease Diagnosis
185
2. Preparation and handling of electrodes
Conventional gold and graphite electrodes, screen-printed electrodes (SPE), electrodes
prepared from CD-Rs (CDtrodes), gold and magnetic nanoparticles, carbon-on-metal,
carbon nanotubes, carbon paste and others substrates have been used as support matrices
(transducers) to immobilize biological compounds. The manner of preparation and handling
of electrodes are very important for the stability and packing of self-assembled monolayers
(SAM) or films and subsequent modifications steps of the analytical methodology.
On cleaning screen-printed electrodes for sensors some recommendations, before the first
modification step, were previously described in the literature: washing the SPE gold-
based electrode with ethanol or acetone (Ferreira et al., 2010; Navrátilová & Skaládal,
2004; Kaláb & Skládal, 1995), or surface pretreatments for the immunosensors
development (Escamilla-Gomez et al., 2009). Carpini et al. gave the following information
about pretreatment of SPE gold-based electrodes: “Although mechanical or electrochemical
cleaning of the gold surface is usually recommended, both thiol-tethered DNA probe
immobilization and naphthol electrochemistry are not significantly affected by surface
pretreatments. Thus, screen-printed gold electrodes were used as produced” (Carpini et al., 2004);
Xu et al. also used as received SPE gold-based electrode for HRP immobilization (Xu et
al., 2003).
Recently, García-González et al. characterized different SPE-gold electrodes used for sensors
preparation and the electrodes were used without pretreatment (García-González et al.,
2008). Escamilla-Gomez et al. used gold screen-printed electrodes (AuSPEs) pretreated with
acid solution (H
2
SO
4
) for impedimetric immunobiosensors. AuSPES were obtained from
different manufacturers, then various cyclic voltammograms were recorded and the
electrodes washed with deionized water (Escamilla-Gomez et al., 2009). The SPE gold-based
electrode, depending on the manufacturing, is not exactly a gold electrode, so the acid
treatment used for cleaning their surfaces cannot be applied. Sometimes modifications may
occur mainly on the surface of the reference electrode and for this reason aggressive
medium cannot be used for cleaning this type of SPE electrodes (Ferreira et al., 2010).
It is important to know that the SPE used in the immunosensors construction must be in
an aluminum sealed package in which each electrode is individually isolated from the
atmosphere, or in special boxes also protected from the atmosphere. In the case of the
locked package of one electrode, it should only be opened just before use and the surface
must be protected against any contamination. Obviously, if this care is not taken in
consideration the SPE electrodes are improper to use for sensors preparation and even for
electrochemical studies. SPE electrodes stored in aluminum sealed package or in other
way can sometimes undergo oxidation and then they must be rejected. Another important
factor to be considered on the SPE use for one specific study is the utilization of electrodes
which belong to the same manufacturing batches. Differences between batches are linear.
It means that different batches result in different output signal by scale not by shape. If
the response is calibrated by internal standard, such calibration will be valid for all
batches (production in series). Using different batches absolute reproducibility of the
immunosensors cannot be ensured.
When conventional gold surface is used, the pretreatment procedures can be mechanical,
chemical and electrochemical (Campuzano et al., 2002, 2006; Hoogvliet et al., 2000). The
influence of the different surface pretreatments on the immunosensor response of a
polycrystalline gold electrode should be studied (Carvalhal et al., 2005). Gold transducers
Biosensors for Health, Environment and Biosecurity
186
are very often used because of the facility to obtain a stable assembled layer. Thiol and
disulphide groups quickly adsorb on gold surfaces, and over longer periods covalent bonds
are formed (Godínez, 1999). Cysteamine (HS-CH
2
-CH
2
-NH
2
), for example, a thiol with a
short chain length, has two functional groups that can be used as a bridge between the
electrode and other kinds of layers. The stability and organization of monolayer depend on
the length of the chains between the terminal and free groups and also on the lateral
interactions between chains. Short chains can lead to the formation of a less stable and more
disorganized layer (Mendes et al., 2008). SBZA (4-(methylmercapto)-benzaldehyde) can also
be used to produce self-assembled monolayers to prepare gold surfaces for further
modification and presents the advantage that it substitutes, for instance, cysteamine and
glutaraldehyde since both S-H and CHO groups are present in this molecule. However,
special care is needed with its incubation due to its high solubility in ethanol, and also the
monolayer must be formed under refrigeration and humid atmosphere (Conoci et al., 2002).
Many other kinds of molecules may form self-assembled monolayers to immobilize
biological molecules or materials in order to develop immunosensors: fullerene-C
60
,
ferrocene, ionic liquid (1-siobutyl-3-methylimidazolium bis(trifluoromethylsulfonyl)amine)
(Xiulan et al., 2011), electropolymerized thionine (Tang et al., 2008), lysine (Wang et al.,
2010), hydroquinone (Xuan et al., 2003), aminosilane (Parker et al., 2009).
Biological molecules or materials can be immobilized on the SAMs or modified SAMs or, in
some cases directly on the electrode surface. In the latest case, special attention should be
given to the loss of activity due to some steric impediment involving electroactive sites.
The influences of the immobilization processes on the immunossensor performance were
evaluated with different transducers, antigens and antibodies. Considering the various steps
involved in the immunosensor construction, very important details must be considered in
the analytical procedure of antigen incubation. The results obtained for shorter antigen
incubation times may be a consequence of some partial leaching of antigen due to an
unstable self-assembled monolayer formation, while those for longer incubation times may
indicate a possible degradation of the modified electrode surface, with loss of layer integrity.
Therefore, a detailed study to optimize the incubation time of antigen in the development of
biosensors is strongly recommended (Ferreira et al., 2010).
The immobilization of antibodies on solid-phase materials has been used for the
development of the immunosensor and different procedures were described in the
literature. Problems associated with biological activity of the antibodies on immobilization
have been observed in many cases (Lu et al., 1996). The interactions antigen-antibody are
complexes by nature and the reproducible response characteristic of immunosensors
requires that the affinity reaction is minimally disturbed by the fabrication procedure. The
random orientation of the asymmetric macromolecules on transducers is one of the main
reasons for such loss. Protein A, produced by Staphylococcus aureus, is a highly stable
receptor capable of binding to the Fc fragment of immunoglobulins and the Fab binding
sites of IgG antibody are thus oriented for immuassays reactions (Sjoquist et al., 1972; Lee et
al., 2004). Therefore, these binding characteristics of the protein A can be used as an affinity
surface in immunosensors construction (Campanella et al., 1999).
Magnetic nanoparticles as substrate for biomolecules immobilization are a special
alternative used in recent years for the construction of immunosensors (Wang & Tan, 2007;
Tang et al., 2008). Due to their attractive properties, magnetic nanoparticles have been used
in immunology (Ao et al., 2006), cell separation processes or purging processes (Bittencourt
Preparation and Characterization of Immunosensors for Disease Diagnosis
187
et al., 2006; Sonti & Bose, 1995). Several applications of magnetic nanoparticles in the
immobilization of immunoglobulines have also been reported (Pham & Sim, 2010; Smith et
al., 2006).
Other conditions affecting the immunosensor response characteristics must be critically
examined: they include the purity of the reagents, incubation temperature in different steps
of immunoassay, ionic strength and solution composition, working pH range, condition of
the electrode surface and the oxygen content of the solution.
3. Techniques for surface control and immunosensor characterization
The preparation and control of the substrate surface and its modification constitute critical
steps of the immunosensor development since they must permit the immobilization of
biological molecule or material on the electrode surface and the interaction between the
modified surface and the sample. The optimization of the incubation time is very critical on
the different steps of the immunosensor development.
A detailed characterization of the various steps involved in the immunosensor development
can be useful for understanding the contribution of each step on the behavior of the global
system, and for further improvement of the analytical process. So, it is strongly
recommended that each step of the immunosensor construction be carefully evaluated using
different electrochemical and non-electrochemical techniques.
The interpretation of the results obtained by applying, in an adequate manner, appropriate
experimental techniques can provide information on the distribution of structural defects,
redox properties and the kinetics and mechanism of the monolayer formation or other
modifications introduced on the surface, such as ions incorporation, water uptake and so on.
The different electrochemical techniques can help understanding the electron transfer and
mass transfer processes after each different step of immunosensor building. The non-
electrochemical ones may inform on the morphology and topography of the bare and
modified surface, on the interaction between the modifier and the surface, on the chemical
nature of the bonds and molecules attached on the surface and on the interaction of energy
(special by light) with the different entities constituting the system which is being studied,
allowing their identification and the knowledge and applications of their properties.
3.1 Electrochemical techniques
Electrochemical techniques are largely used by researchers of different scientific fields due
to the fact that the equipment used is of low cost, simple, and easy to utilize and have the
advantage of being in situ techniques, which allows monitoring the studied system in real
time. Many different electrochemical techniques have been used to monitor the response of
different surfaces such as gold, graphite, carbon nanotubes, gold nanowires, gold
nanoparticles, metallic oxide nanoparticles, spin-on glass surfaces, carbon paste, which can
be modified with different modifiers to form SAMs and composites to incorporate active
materials and built the desired immunosensor. Each step of this process may be carefully
characterized using cyclic voltammetry (CV), electrochemical impedance spectroscopy (EIS),
quartz crystal microbalance, chronoamperometry and amperometry, square wave
voltammetry (SWV), differential pulse voltammetry (DPV), ellipsometry, and measurements
of electrical resistances.
Biosensors for Health, Environment and Biosecurity
188
3.1.1 Cyclic voltammetry
For a better understanding of cyclic voltammetry and its general applications the readers
can refer to some text books (Noel & Vasu, 1990; Gasser Jr., 1993; Compton & Banks, 2009).
As indicated above, cyclic voltammetry (CV) is the electrochemical technique most
frequently used to get the first information on the nature of the electrode surface, such as its
purity (Angerstein-Kozlowska et al., 1973), stability (Cabot et al., 1991; Benedetti et al., 1991),
reproducibility and repeatability (Horta et al., 2009). Sometimes CV is used for cleaning the
electrode surface (Calvo et al., 2004); for activating (Tang et al., 2006); and for reconstructing
the electrode surface, or to determine the electrode active surface area for small molecules
(hydrogen, methanol, CO, ethanol, etc.), which adsorb on the electrode surface (Biegler et
al., 1971; Godoi et al., 2009). Cyclic voltammograms obtained for large molecules can be
used to determine the real surface area of an electrode, resulting in an area similar to the
geometric one (Noel & Vasu, 1990). Such large molecules can be coordination and other
inorganic compounds (ferro/ferricyanide, ferrocene/ferrocinium, etc.) and highly solvated
ions which may stay in solution without adsorbing on the electrode surface. CV is very often
to help establish the global mechanism of an electrochemical process occurring in solution
(Naal et al., 1994) or occurring at a surface as nucleation (Noel & Vasu, 1990).
This technique may also indicate some contamination of the electrolyte used as in the case of
a phosphate buffer solution, pH 7.4, containing the redox pair Fe(CN)
6
-3
/Fe(CN)
6
-4
which
was used to characterize the gold electrodes prepared from CDs (CDtrodes). This was
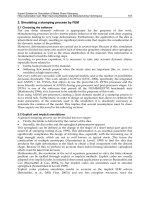
observed in our laboratory. Fig. 1 shows the cyclic voltammograms of this system obtained
using the same experimental conditions except that the phosphate buffer solution for
recording the cyclic voltammogram of Fig. 1b was changed. It is clearly seen that the cyclic
voltammogram in Fig. 1a was distorted probably by some impurity that came from the
solution that adsorbed on the electrode surface and partially blocked it. This conclusion was
drawn after testing all the other possibilities, such as checking cables and all electrical
connections, cleaning the electrochemical cell and its components, recording CVs in other
equipment, trying several CDtrodes and changing both ferro/ferricyanide salts. The
conclusion was that phosphate salts of the buffer solution had been contaminated.
However, it is possible that the main reasons for the large use of cyclic voltammetry is the
simplicity of equipment, facilities to scan a large energy range and also a large potential scan
rate (from microvolt to hundreds of megavolts per second) which can be coupled with
changes in the temperature of the electrochemical cell to study the kinetic of chemical
coupled reactions, and mainly its didactical presentation. But sometimes the results of CV
are misinterpreted causing some confusing regarding the irreversibility generated by fast
chemical coupled reaction or by slow charge transfer reaction. This confusion can be
normally distinguished experimentally by changing the scan rate (ν) and / or the
temperature of the system. Another common misinterpretation is related to the effect of
ohmic drop on the anodic and cathodic peak potentials separation since the ohmic drop
presents similar effect as a quasi-reversible process (Taconni et al., 1973). In this case it is
important, after checking the position of the electrodes in the cell and the Luggin capillary
position respect to the surface of the working electrode, to increase the solution conductivity
in order to diminish the uncompensated solution resistance.
A simple example of uncompensated resistance effect (ohmic drop effect) can be observed in
Fig. 2 for 4 x 10
-3
mol L
-1
Fe(CN)
6
4-
ion in KCl aqueous solution where the concentration of
the supporting electrolyte was 0.5 or 0.05 mol L
-1
at different scan rates. Typical E/I profile
Preparation and Characterization of Immunosensors for Disease Diagnosis
189
can be seen for the redox couple studied with anodic (E
ap
) and cathodic (E
cp
) current peaks
well-defined. Also, no current peaks appear in the absence of potassium ferrocyanide. The
experimental conditions were the same except for the supporting electrolyte concentration,
which varied.
-0.4 -0.2 0.0 0.2 0.4 0.6
-15
-10
-5
0
5
10
15
(b)
(a)
I / μA
E / V vs Ag|AgCl|KCl
(Sat.)
Fig. 1. Cyclic voltamograms of gold CDtrode in 1.0 × 10
-3
mol L
-1
Fe(CN)
6
3-/4-
phosphate
buffer solution 0.1 mol L
-1
, pH 7.4, at 50 mV s
-1
. The CDtrode was cycled in 2.0 mol L
-1
H
2
SO
4
solution at 50 mV s
-1
: (a) contaminated phosphate buffer solution; (b) cleaned
phosphate buffer solution (Reproduced by permission of M.V. Foguel).
The main differences between these cyclic voltammograms were the separations between
the anodic and cathodic peaks (ΔE
p
) and the difference between the anodic or cathodic
current peaks. For 0.5 mol L
-1
KCl the values of ΔE
p
were around 60 mV in 0.5 mol L
-1
KCl
(Fig. 2a) for all scan rates measured, while in 0.05 mol L
-1
KCl, ΔE
p
varied from 80 to 120 mV
for 5 ≥ ν/mV s
-1
≥ 100 (Fig. 2b). CVs recorded in 0.05 mol L
-1
KCl aqueous solution present
all the characteristics of an increase in the uncompensated solution resistance as ν increases:
augment in the peak potential separation, decrease in current peaks and rounding of the
peaks. The effect of current migration is very low for 0.05 mol L
-1
KCl and completely
negligible for 0.5 mol L
-1
KCl in aqueous solution (Bard & Faulkner, 1980). In a parallel
experiment, CVs were recorded for a solution containing 2.0 × 10
-2
mol L
-1
Fe(CN)
6
3-
+ 2.0 ×
10
-2
mol L
-1
Fe(CN)
6
4-
in the absence of KCl salt. The peak potentials were separated by more
than 150 mV at 50 mV s
-1
and the peak current was lower than the current measured when
KCl was present. It means that the sum of migration and diffusion currents was unable to
overcome the influence of the ohmic drop, leading to a lower instead of a higher total
current. The decrease in the peak current was caused by the solution resistance.
Biosensors for Health, Environment and Biosecurity
190
Feldberg (Feldberg, 2008) simulated the effect of uncompensated resistance on the cyclic
voltammetric response of an electrochemically reversible surface-attached redox couple
assuming an uniform current and potential distribution across the electrode surface. The
similarity of the effect of voltammetric responses for a slow electrochemical reaction and the
uncompensated resistance is evident, which may cause misinterpretation of the mechanism
of the electrode process. It is also common to attribute the linear current peak, I
p
– v
½
relationship to diffusion, but sometimes nucleation or other processes can follow the same
relationship (Noel & Vasu, 1990).
-0.2 0.0 0.2 0.4 0.6 0.8
-20
-15
-10
-5
0
5
10
15
20
25
I / μ A
__ 100 mV s
-1
75
__ 50
__ 30
__ 20
__ 10
__ 5
E /V vs Ag/AgCl
A
a
b
h
b
c
d
e
f
g
h
-0.2 0.0 0.2 0.4 0.6 0.8
-12
-8
-4
0
4
8
12
16
I / μ A
__ 100 mV s
-1
__ 75
__ 50
__ 30
__ 20
__ 10
__ 5
E /V vs Ag/AgCl
(b)
a
b
c
d
e
f
g
h
b
h
Fig. 2. Cyclic voltammograms for Pt in 4 x 10
-3
mol L
-1
Fe(CN)
6
4-
ion + KCl aqueous solution
(a) 0.5 and (b) 0.05 mol L
-1
, at 25
o
C, geometric area of the working electrode of 0.027 cm
2
and
at
different scan rates.
As seen above, the CV has been often used to characterize immunosensors and many times
a phosphate-based buffer solution is used, which may present effect of uncompensated
resistance due to its low conductivity, resulting in cyclic voltammograms for Fe(CN)
6
3-
/Fe(CN)
6
4-
redox couple away from that expected for a one-electron reversible process
under diffusion control. For this reason, phosphate buffer saline solution shows cyclic