Biosensors for Health Environment and Biosecurity Part 9 potx
Bạn đang xem bản rút gọn của tài liệu. Xem và tải ngay bản đầy đủ của tài liệu tại đây (2.11 MB, 35 trang )
Quartz Crystal Microbalance in Clinical Application
271
Jung, C., Dannenberger, O., Xu, Y., Buck, M., Grunze, M. (1998). Self-assembled monolayers
from organosulfur compounds: A comparison between sulfides, disulfides, and
thiols. Langmuir, Vol. 14, No. 5, (February 1998), pp. 1103-1107, ISSN 0743-7463.
Kang, I.K., Kwon, B.K., Lee, J.H., Lee, H.B. (1993). Immobilization of proteins on
poly(methyl methacrylate) films. Biomaterials, Vol. 14, No. 2, (August 1993), pp. 787-
792, ISSN 0142-9612.
King, W.H. (1964). Piezoelectric sorption detector. Anal Chem, Vol. 36, No. 9, (August 1964),
pp. 1735-1739, ISSN 0003-2700.
Kuijpers, A.J., van Wachem, P.B., van Luyn, M.J., Brouwer, L.A., Engbers, G.H., Krijgsveld,
J., Zaat, S.A., Dankert, J., Feijen, J. (2000). In vitro and in vivo evaluation of gelatin-
chondroitin sulphate hydrogels for controlled release of antibacterial proteins.
Biomaterials, Vol. 21, No. 2, (September 2000), pp. 1763-1772, ISSN 0142-9612.
Laibinis, P.E., Nuzzo, R.G., Whitesides, G.M. (1992). The structure of monolayers formed by
coadsorption of two n-alkanethiols of different chain lengths on gold and its
relation to wetting. J Phys Chem, Vol. 96, No. 12, (June 1992), pp. 5097-5105, ISSN
0022-3654.
Laibinis, P.E., Whitesides, G.M. (1992). Self-assembled monolayers of n-alkanethiolates on
copper are barrier films that protect the metal against oxidation by air. J Am Chem
Soc. Vol. 114, No. 23, (November 1992), pp. 9022-9028, ISSN 0002-7863.
Laibinis, P.E., Whitesides, G.M., Allara, D.L., Tao, Y.T., Parikh, A.N., Nuzzo, R.G. (1991).
Comparison of the structures and wetting properties of self-assembled monolayers
of n-alkanethiols on the coinage metal surfaces, copper, silver, and gold. J Am Chem
Soc, Vol. 113, No. 2, (September 1991), pp. 7152-7167, ISSN 0002-7863.
Lestelius, M., Liedberg, B., Tengvall, P. (1997). In vitro plasma protein adsorption on ω -
functionalized alkanethiolate self-assembled monolayers. Langmuir, Vol. 13, No. 2,
(October 1997), pp. 5900-5908, ISSN 0743-7463.
Lowry, O.H., Rosebrough, N.J., Farr, A.L., Randall, R.J. (1951). Protein measurement with
the Folin phenol reagent. J Biol Chem, Vol. 193, No. 2, (November 1951), pp. 265–
275, ISSN 0021-9258.
Mariani, G., Strober, W., Keiser, H., Waldmann, T.A. (1976). Pathophysiology of
hypoalbuminemia associated with carcinoid tumor. Cancer, Vol. 38, No. 2, (August
1976), pp. 854-860, ISSN 1097-0142.
Morgan, C.L., Newman, D.J., Price, C.P. (1996). Immunosensors: technology and
opportunities in laboratory medicine. Clin Chem, Vol. 42, No. 2, (February 1996), pp.
193-209, ISSN 0009-9147.
Morhard, F., Schumacher, J., Lenenbach, A., Wilhelm, T., Dahint, R., Grunze, M., Everhart,
D.S. (1997). Optical diffraction – a new concept for rapid on-line detection of
chemical and biochemical analytes. Proc Electrochem Soc, Vol. 97, No. 19, (August
1997), pp. 1058-1065, ISSN 0161-6374.
Moshage, H.J., Janssen, J.A., Franssen, J.H., Hafkenscheid, J.C., Yap, S.H. (1987). Study of the
molecular mechanism of decreased liver synthesis of albumin in inflammation. J
Clin Invest
, Vol. 79, No. 6, (June 1987), pp. 1635-1641, ISSN 0021-9738.
Muramatsu, H., Tamiya, E., K
arube, I. (1988). Computation of equivalent circuit parameters
of quartz crystals in contact with liquids and study of liquid properties. Anal Chem,
Vol. 60, No. 2, (October 1988), pp. 2142-2146, ISSN 0003-2700.
Nie, L.H., Zhang, X.T., Yao, S.Z. (1992). Determination of quinine in some pharmaceutical
preparations using a ring-coated piezoelectric sensor. J Pharm Biomed Anal, Vol. 10,
No. 2, (July 1992), pp. 529-533, ISSN 0731-7085.
Biosensors for Health, Environment and Biosecurity
272
O'Sullivan, C.K., Guilbault, G.G. (1999). Commercial quartz crystal microbalances - theory
and applications. Biosens Bioelectron, Vol. 14, No. 2, (December 1999), pp. 663-670,
ISSN 0956-5663.
Peters, T.J. (1996). All About Albumin: Biochemistry, Genetics, and Medical Applications.
Academic Press, ISBN 978-0125521109, San Diego, CA, USA.
Phillips, A., Shaper, A.G., Whincup, P.H. (1989). Association between serum albumin and
mortality from cardiovascular disease, cancer, and other causes. Lancet, Vol. 16, No.
2, (December 1989), pp. 1434-1436, ISSN 0140-6736.
Prinsen, B.H. & de Sain-van der Velden, M.G. (2004). Albumin turnover: experimental
approach and its application in health and renal diseases. Clinica Chimica Acta, Vol.
347, No. 1-2, (September 2004), pp. 1-14, ISSN 0009-8981.
Rothschild, M.A., Oratz, M., Schreiber, S.S. (1998). Serum albumin. Hepatology, Vol. 8, No.
2, (March 1988), pp. 385-401, ISSN 1665-2681.
Schertel, A., Wöll, C., Grunze, M. (1997). Identification of mono- and bidentate carboxylate
surface species on Cu(111) using x-ray absorption spectroscopy. J Phys IV, Vol. 7,
No. C2, (April 1976), pp. 537-538, ISSN 1155-4339.
Smith, E.L., Alves, C.A., Anderegg, J.W., Porter, M.D., Siperko, L.M. (1992). Deposition of
metal overlayers at end-group-functionalized thiolate monolayers adsorbed at
gold. 1. Surface and interfacial chemical characterization of deposited copper
overlayers at carboxylic acid-terminated structures. Langmuir, Vol. 8, No. 2,
(November 1992), pp. 2707-2714, ISSN 0743-7463.
Tyan, Y.C., Liao, J.D., Klauser, R., Wu, I.D., Weng, C.C. (2002). Assessment and
characterization of degradation effect for the varied degrees of ultra-violet
radiation onto the collagen-bonded polypropylene non-woven fabric surfaces.
Biomaterials, Vol. 23, No. 2, (January 2002), pp. 65-76, ISSN 0142-9612.
van Delden, C.J., Lens, J.P., Kooyman, R.P., Engbers, G.E., Feijen, J. (1997). Heparinization of
gas plasma-modified polystyrene surfaces and the interactions of these surfaces
with proteins studied with surface plasmon resonance. Biomaterials, Vol. 18, No. 2,
(June 1997), pp. 845-852, ISSN 0142-9612.
Voinova, M.V., Jonson, M., Kasemo, B. (2002). Missing mass effect in biosensor's QCM
applications. Biosens Bioelectron, Vol. 17, No. 2, (October 2002), pp. 835-841, ISSN
0956-5663.
Wei, X., Wei, Y., Xing, D., Chen, Q. (2008). A novel chemiluminescence technique for
quantitative measurement of low concentration human serum albumin. Analytical
Science, Vol. 24, No. 2, (January 2008), pp. 115-119, ISSN 1394-2506.
Weng, C.C., Liao, J.D., Wu, Y.T., Wang, M.C., Klauser, R., Grunze, M., Zharnikov, M. (2004).
Modification of aliphatic self-assembled monolayers by free-radical-dominant
plasma: The role of the plasma composition. Langmuir, Vol. 20, No. 2, (October
2004), pp. 10093-10099, ISSN 0743-7463.
Weng, C.C., Liao, J.D., Wu, Y.T., Wang, M.C., Klauser, R., Zharnikov, M. (2006).
Modification of monomolecular self-assembled films by nitrogen-oxygen plasma. J
Phys Chem B, Vol. 110, No. 2, (June 2006), pp. 12523-12529, ISSN 1089-5647.
West, J.B. (1990). Physiological Basis of Medical Practice. Williams & Wilkins, ISBN 978-
0683089479, Baltimore, MD, USA.
Yan, C., Zharnikov, M., Gölzhäuser, A., Grunze, M. (2000). Preparation and characterization
of self-assembled monolayers on indium tin oxide. Langmuir, Vol. 16, No. 15, (June
2000), pp. 6208-6215, ISSN 0743-7463.
12
Using the Brain as a Biosensor
to Detect Hypoglycaemia
Rasmus Elsborg, Line Sofie Remvig,
Henning Beck-Nielsen and Claus Bogh Juhl
Hypo-Safe A/S, Odense University Hospital, Sydvestjysk Sygehus Esbjerg
Denmark
1. Introduction
1.1 Definition of hypoglycaemia and its clinical importance
Hypoglycaemia can be defined as an abnormally low blood glucose concentration. This
rather open definition implies that a strict biochemical definition may be easy and
convenient but insufficient. In biochemical terms, blood glucose lower than 3.5 mmol/l will
often be considered low in diabetes patients treated with insulin or oral hypoglycaemia
agents. Both in diabetes patients and in healthy persons, however, spontaneous blood
glucose values lower than this threshold may frequently be measured. Blood glucose values
down to 2.7 mmol/l or even lower with limited or no symptoms can be measured following
long term fasting in healthy humans (Hojlund et al., 2001). Diabetes patients with tight
glucose control and recurrent episodes of hypoglycaemia may lack symptoms of
hypoglycaemia even at very low glucose levels down to 1 mmol/l. Consequently, many
different definitions of biochemical hypoglycaemia can be found in the literature regarding
hypoglycaemia in diabetes.
In clinical terms, hypoglycaemia can be differentiated into mild, moderate or severe events.
Mild hypoglycaemia is present when a diabetes patient experiences symptoms of
hypoglycaemia such as sweating, shivering or palpitations. The patient is able to react
appropriately by eating or drinking and thereby re-establish a normal blood glucose level,
avoiding progression into severe hypoglycaemia. Moderate hypoglycaemia is present when
the patient may or may not experience hypoglycaemia symptoms but may require help to
take action. This could entail simply guiding the patient to eat or drink or a more active
approach of giving the patient the food or drink. Severe hypoglycaemia is present when the
patient loses consciousness and an active medical approach is needed such as glucose
infusion or glucagon injection. The correlation between biochemical and clinical
hypoglycaemia is very poor in type 1 diabetes patients (Pramming et al., 1990).
Events of mild hypoglycaemia are not dangerous per se. Diabetes patients often expect this
to be a consequence of a strict insulin treatment regime. The problem, however, is that
frequent events of mild hypoglycaemia reduce the patient’s awareness of hypoglycaemia,
initiating a vicious cycle of recurrent events and thereby increasing the risk of severe
hypoglycaemic events. Episodes of severe hypoglycaemia are associated with both risk and
fear of recurrent episodes, which may result in the patient striving for a higher glucose
Biosensors for Health, Environment and Biosecurity
274
target, and thereby, increased risk of late diabetes complications. In addition,
hypoglycaemia related visits to the emergency room and hospitalization constitute a heavy
economic burden (Hammer et al., 2009; Lammert et al., 2009). Clearly, there are several
reasons to consider alternative methods of reducing this risk of hypoglycaemia events.
1.2 Sympato-adrenal warning symptoms and hormonal counter regulation
Healthy humans have two major supplementary mechanisms to avoid severe
hypoglycaemia. The first line of defence is the hormonal counterregulation. When blood
glucose falls below 3.5 mmol/l, insulin release will be suppressed and the pancreatic alpha
cells will release glucagon. This results in an increased glucose release from the hepatic
store. Also adrenalin, cortisol and human growth hormone are released as a consequence of
hypoglycaemia and contribute to re-establish euglycaemia. The second line of defence arises
from an activation of the sympathetic nervous system resulting in the hypoglycaemic
symptoms described above. Awareness of these symptoms alerts the patient and enables an
appropriate reaction.
1.3 Hypoglycaemia unawareness
In newly diagnosed diabetes, hormonal counterregulation resembles that of a healthy
person despite the fact, of course, that insulin release cannot be suppressed since this is
externally delivered. With increased duration of diabetes, hormonal counterregulation may
fail. Within five years of diabetes onset, most patients have lost their ability to release
glucagon upon hypoglycaemia. Although the release of human growth hormone and
cortisol may persist, these hormones are less effective and slower acting and do not prevent
the development of severe hypoglycaemia.
With increased diabetes duration the sympato-adrenal activation may likewise fail resulting
in impaired awareness of hypoglycaemia and ultimately, hypoglycaemia unawareness
(Howorka et al., 2000). This is defined by a severe cognitive impairment occurring without
subjective symptoms of hypoglycaemia.
A number of factors contribute to deterioration of the hypoglycaemic defences: Recent
hypoglycaemic events, tight glycaemic control, sleep, a supine position and alcohol
consumption all tend to reduce the hypoglycaemic defences due to the mechanisms
described above, thereby increasing the risk of severe hypoglycaemia (Amiel et al., 1991;
Geddes et al., 2008; Howorka et al., 2000). Approximately 25% of all type 1 diabetes patients
suffer from hypoglycaemia unawareness and most events of severe hypoglycaemia take
place within this group of patients (Pedersen-Bjergaard et al., 2004). The risk of severe
hypoglycaemia is estimated to be five to ten times higher in patients suffering from
hypoglycaemia unawareness (Geddes et al., 2008; Gold et al., 1994; Pedersen-Bjergaard et
al., 2004). The term hypoglycaemia associated autonomic failure (HAAF) has been proposed
for the concomitant lack of counterregulatory hormonal release and the lack of
sympatoadrenal symptoms (Cryer, 2005).
1.4 How to reduce the risk of severe hypoglycaemia
Assuming that the risk and fear of hypoglycaemia is a major hindrance in achieving an
optimal glucose control, all possible efforts should be done to reduce them. The first priority
must be to optimize the insulin regime. Often a thorough interview with the patient
including a review of blood glucose measurements can uncover risk factors for severe
Using the Brain as a Biosensor to Detect Hypoglycaemia
275
hypoglycaemic events in the individual patient. Adjustment of the insulin dose and timing
may consequently reduce the risk. Switching from one insulin type to another may ensure a
better convergence between insulin concentration and insulin need. The long acting insulin
analogues insulin glargine and insulin detemir reduce the risk of hypoglycaemia
particularly at night-time (Monami et al., 2009). Use of continuous insulin infusion (insulin
pump therapy) rather than multiple injection therapy has been shown to enable a more strict
diabetes regulation and also a significant reduction in the risk of severe hypoglycaemia
(Pickup et al., 2008). However, severe hypoglycaemia is still a common and feared
complication in type 1 diabetes (Anderbro et al., 2010).
Much effort has been put into the development of continuous glucose monitoring (CGM)
systems. Ideally, CGM will provide a better protection against severe hypoglycaemia by
frequent glucose measurements in the interstitial tissue and alarms based on actual glucose
measurements or prediction algorithms. Large clinical studies have shown that the use of
CGM enables a more tight glucose control without increased risk of hypoglycaemia, but so
far CGM has not been shown to reduce the risk of severe hypoglycaemic events (The
Diabetes Control and Complication Trial, 2009; Bergenstal et al., 2010; Tamborlane et al.,
2008). Still, CGM studies have taught us that hypoglycaemia is much more common than
previously thought and is likely to be significantly underreported (JDRF CGM Study Group,
2010). One shortcoming of CGM is that adherence to therapy seems to decline with long
term use, so use of the device calculated as hours per week was reduced to 35-70%
depending on age group already after six months of use in clinical trials (JDRF CGM Study
Group, 2008).
2. EEG for hypoglycaemia detection
2.1 The concept of an EEG based biosensor as a hypoglycaemia alarm
While hormonal counterregulation and sympatoadrenal symptoms often diminish or
disappear with long term diabetes, the devastating effect of low blood glucose on organ
function persists. The most important dysfunctions arise from the glycopenic effects on the
brain and the heart. Neuroglycopenia results in a gradual loss of cognitive functions. In the
early stage, this may only be apparent during systematic cognitive testing. As the glucose
concentration falls, the cognitive function continues to decline resulting in slower speed of
reaction, blurred speech, loss of consciousness, seizures and ultimately death. The effect of
hypoglycaemia on the heart is less well described but comprises prolongation of the QT-
interval which is a known cause of cardiac arrhythmia. In fact death among younger patients
with insulin treated diabetes is assumed often to be related to malignant cardiac arrhythmia.
The blood glucose threshold at which the organ function is affected varies both between and
within diabetes patients. Diabetes patients with tightly controlled blood glucose and
frequent hypoglycaemic events may not be severely affected despite a blood glucose level as
low as 1.5 mmol/l or even lower. This means, however, that just a slight further reduction in
the glucose concentration will result in the serious effects of severe hypoglycaemia.
The concept of a hypoglycaemia alarm based on biosensing involves continuous monitoring
of organ function, a real-time signal processing and an alarm device. Preferably, such a
biosensor should be able to sense subtle change in brain function (e.g.
electroencephalography), cardiac function (e.g. electrocardiography) or any other organ
changes preceding cognitive dysfunction which will preclude the patient from taking action
and thereby avoid severe hypoglycaemia.
Biosensors for Health, Environment and Biosecurity
276
This chapter focuses on the possibility to construct a hypoglycaemia alarm system based on
continuous EEG monitoring and real-time data processing by means of a multi-parameter
algorithm. Such a device may comprise an alternative to self-glucose testing or continuous
glucose monitoring as a guard against severe hypoglycaemia. Analysis of EEG changes as a
predictor of severe hypoglycaemia was already proposed by Regan et. al. in 1956 (Reagan et
al., 1956). Iaione published the development of an automated algorithm using digital signal
processing and artificial neural networks with the aim of developing a hypoglycaemia
detector system, and achieved a fair sensitivity and specificity in the detection of
hypoglycaemia (Iaione et al., 2005). Our aim is to develop this further to a portable real-time
hypoglycaemia alarm device, which can be used by type 1 diabetes patients with
hypoglycaemia unawareness. For such a device to be suitable for clinical use, it must fulfil a
number of criteria: It must have a high sensitivity with low occurrence of false positive
alarms, preferably it should require little or no calibration, and it must be suitable for use
over long periods with minimal discomfort for the patient.
2.2 Hypoglycaemia related EEG changes
The electroencephalogram (EEG) is usually measured on the scalp, using surface electrodes
that are glued to the scalp with conducting gels. The surface EEG represents the electrical
activity taking place inside the brain and originates from the firing neurons, mainly in the
superficial part of the brain. When a neuron fires, a very small electrical charge is released,
which in itself cannot be measured on the scalp. But the macro pattern that appears when
many neurons fire in a synchronized manner, builds up larger electrical signals, which can
be measured on the scalp. When measuring the EEG, all the micro changes in the firing
pattern disappear due to the averaging effect through the scalp, and only the macro changes
remain. The EEG, which is measured outside the scalp, can therefore be used to detect
macro changes in the electrical behaviour of the brain. In general, during daytime, the
healthy brain is less synchronized than during sleep, and only few daytime phenomena can
be characterized and detected. During sleep, the brain is more synchronised and emits many
characteristic wave patterns that reflect the different sleep phases (Iber et al., 2007). Many
brain related diseases, like e.g. epilepsy, do result in synchronization of the brain waves,
which can be seen in the EEG patterns. This is also the case for patients experiencing
hypoglycaemia.
Glucose is an essential substrate for brain metabolism. Accordingly, low blood glucose
resulting in neuroglycopenia can be assumed to result in EEG changes. In the 1950’s, the
first studies of hypoglycaemia related EEG changes (HREC) were published (Ross et al.,
1951; Regan et al., 1956) and already by then, it was proposed that EEG might add
information on whether a patient's blood glucose concentration falls below a critical
threshold (Regan et al., 1956). Pramming et al studied EEG changes during insulin induced
hypoglycaemia in type 1 diabetes patients (Pramming et al., 1988). They found that the EEG
was unaffected when the blood glucose concentration was above 3 mmol/l. Following a
gradual decline in blood glucose the EEG changes became apparent in all the patients. At a
median blood glucose concentration of 2.0 mmol/l the alpha activity (8-12 Hz) decreased
while theta activity (4-8 Hz) increased, reflecting a cortical dysfunction. Importantly, HREC
disappeared when the blood glucose was normalized and a normal EEG was re-established
when the blood glucose concentration exceeded a level of 2.0 mmol/l. It was concluded that
“changes in electroencephalograms during hypoglycaemia appear and disappear at such a
Using the Brain as a Biosensor to Detect Hypoglycaemia
277
narrow range of blood glucose concentrations that the term threshold blood glucose
concentration for the onset of such changes seems justified”.
A number of studies have further characterized the EEG-changes associated with
hypoglycaemia (Bedtsson et al., 1991; Bjorgaas et al., 1998; Hyllienmark et al., (2005); Juhl et
al., (2010); Tamburrano et al., 1988; Tribl et al., 1996). Although some discrepancy exists
with respect to the spatial location of the EEG changes (see section 2.4) and the persistence
of these changes after restoration of euglycaemia, it is well established that hypoglycaemia
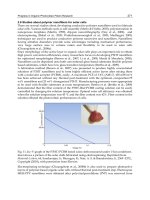
is associated with an increased power in the low frequency bands. Figure 1 shows an
example of a single channel EEG recorded during euglycaemia and hypoglycaemia during
daytime. Comparing the two signals, it is evident that the hypoglycaemic EEG originates
from a process of lower frequency, which is more synchronized, leading to EEG of higher
amplitude.
Fig. 1. Representative examples of single channel EEG recorded during euglycaemia and
hypoglycaemia in the same person.
Bendtson et al. studied type 1 diabetes patients during sleep and found widespread
occurrence of low frequency waves which could be differentiated from the delta and theta-
band by the frequency (Bentson et al., 1991). These changes were only detectable in patients
with lack of glucagon response. This observation has been challenged by our research team
which found EEG changes irrespective of glucagon response (Juhl et al., 2010).
Though the two signals in Figure 1 are very easy to distinguish and the HREC paradigm is
relatively well established, the HREC detection problem is not as trivial as it seems. The
illustrated signals constitute textbook examples, and the exact signal characteristics vary
considerably between subjects – both during euglycaemia and hypoglycaemia. In addition,
many everyday activities induce EEG activity in the same frequency band as the HREC
paradigm. Examples of this are low-frequency deep sleep patterns and broadband noise
signals.
2.3 Long-term EEG recording: scalp vs. subcutaneous EEG
Using the brain as a biosensor for hypoglycaemia detection throughout the day requires a
stable long-term EEG recording system. The usual 10/20 EEG system (Crespel et al., 2005)
Biosensors for Health, Environment and Biosecurity
278
with surface electrodes glued to the scalp is not an option, since surface electrodes are
highly exposed to movement artefact. Therefore, in our setting, the EEG is measured by
electrodes placed in the subcutaneous layer, a few millimetres below the skin, thereby
giving the advantage of being more robust to noise and artefact signals. The subcutaneous
measurements were tested compared to scalp electrodes and were found to be very similar,
showing very high correlation.
In the initial experiments, four single subcutaneous electrodes were placed, while in the
sleep studies a single electrode with three measuring points were inserted in the temporal
area and connected to an EEG device.
2.4 Spatial considerations
In general, EEG patterns have different characteristics depending on the spatial location of
the measurement. While some EEG changes are generalized and apparent on the entire
surface of the brain, some paradigms are only present in smaller areas, which make detailed
measurements in certain locations necessary.
Regarding the spatial distribution of the HREC, some discrepancy exists. The topographic
maximum has been demonstrated to be located in the lateral frontal region during mild
hypoglycaemia. This shifts towards the centroparietal and parieto-occipital region in deeper
hypoglycaemia (Tribl et al., 1996). Hyllienmark et al on the other hand studied type 1
diabetes patients with a history of recurrent hypoglycaemia, and the EEG recording was
conducted during a period of normal blood glucose. They found similar HREC
characteristics as previously described, however predominantly in the frontal region.
(Hyllienmark et al., 2005). In addition, this could indicate that EEG changes in some cases
may become permanent.
In order to be able to detect HREC with a single or a few electrodes we investigated the
spatial distribution of the changes. The hypoglycaemia changes are generally present on
most of the scalp area. The spatial distribution of the artefacts particularly derived from
muscle activity during facial mimicking, eating, eye movement and sleep related
movements, should be taken into account when the optimal electrode placement is to be
defined. In contrast to the HREC, these artefacts are more localized, making the location
important. Artefact related to electrode movements and the mechanics of the electrode
contact are not dependent on the spatial location. The ability to detect the HREC when
artefact signals are present is illustrated in Figure 2, where the HREC signal is detected from
a single electrode channel on five diabetes patients.
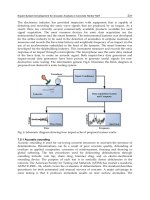
Fig. 2. Illustration of the spatial influence on the ability to detect the HREC paradigm. The
red areas in the figure indicate that the HREC paradigm detection performance is high,
whereas green areas indicate low performance.
Using the Brain as a Biosensor to Detect Hypoglycaemia
279
Taking into consideration the spatial influence and the electrode type we have chosen the
final measurement location shown in Figure 3.
Fig. 3. Location of the subcutaneous EEG electrode. The subcutaneous electrode is inserted
in a location behind the ear towards vertex cranii between Cz and Pz. The measurement
points are shown in red, giving one differential channel.
3. The development of the algorithm
In the following paragraphs we describe in detail the development of the algorithm, which
distinguishes HREC from normal daytime and sleep EEG. This process required a series of
insulin-induced hypoglycaemia experiments with continuous improvements of the
algorithm and repetitive testing. The series of clinical trials from which the data were
obtained are outlined in Figure 4.
The measurement system used to acquire EEG data, samples the EEG at a sampling
frequency of 512 Hz. The EEG is filtered so that all the frequency components above 32 Hz
are removed, leaving us with a signal bandwidth of 32 Hz and a sampling frequency of 64
Hz for the HREC detection algorithm. The dynamic range of the measured signal is ± 512µV
with a signal resolution (1 LSB) of 1µV. The internal noise level in the analogue data
acquisition system is 1.3µV RMS.
Fig. 4. Illustration of the flow of clinical studies leading to the development of the algorithm.
Continuous optimizations were conducted on the basis of consecutive daytime and sleep
experiments.
Biosensors for Health, Environment and Biosecurity
280
The HREC can be detected by visual inspection by a neurophysiologist, who inspects the
waveforms of the EEG. However, if the EEG of the diabetes patients is to be analysed in
real-time throughout the day this must be done automatically using an algorithm. The
algorithm structure for hypoglycaemia detection is shown in Figure 5.
Fig. 5. Structure of the hypoglycaemia detection algorithm.
Overall, the algorithm works in four sequential levels that process the EEG signal and
determines whether sufficient evidence of hypoglycaemia is present for an alarm to be
triggered. At the first level, the feature extraction process maps the raw EEG into an
appropriate feature space in which it is possible to distinguish HREC from normal EEG. The
second level consists of three blocks, each of which analyses the features to determine if
there is evidence of impending hypoglycaemia, deep sleep patterns, or noise contamination,
respectively. At the third level, hypoglycaemia evidence is rejected when deep sleep
patterns and/or noise are present. Lastly, taking the recent history into account it is
determined whether or not a sufficient amount of hypoglycaemia evidence is present to
constitute an alarm. Each of the algorithm blocks will be described in the following sections.
3.1 Feature extraction
The raw EEG signal waveform can easily be analysed by the trained human eye, which
interprets the shape of the waves and draws a conclusion based on this. However, the raw
waveform representation is not directly interpretable for a machine decision network, which
needs the EEG in a different presentation. The feature extraction part of the algorithm maps
the raw EEG into another form that represents the distribution of different kinds of
waveforms. Since the hypoglycaemia paradigm in EEG is characterized by the existence of
waveforms of specific frequency content, the features calculated are designed to reflect this.
The EEG waveforms are transformed to features by sending the EEG through an IIR filter
bank, taking the 1-norm of the filtered signals, integrating the values in another filter, and
by finally subsampling the integrated signal.
When analysing EEG, the signal is traditionally split into 5 frequency bands (delta, theta,
alpha, beta, and gamma). However, this frequency resolution is not sufficient for an optimal
performance of the hypoglycaemia detection system.
Our IIR filter bank consists of 32 filters where each filter has a bandwidth of 1Hz and a sub-
band attenuation of 30 dB or more. In Figure 6, a 20-minute sample of EEG is represented in
feature space.
Using the Brain as a Biosensor to Detect Hypoglycaemia
281
Fig. 6. Feature space representation of an EEG signal during a transition from euglycaemia
(first 10 min) to hypoglycaemia (last 10 min), where HREC’s are present. It is evident that a
strong 7-8 Hz activity is present during hypoglycaemia in this sample.
We will see later (Figure 9) that many of the filter bands are irrelevant for the overall
performance of the algorithm, but all bands have been included here to give a better
understanding of the importance of each band. It should be noted that the fast Fourier
transform (FFT) algorithm could easily substitute the IIR filter bank, if the process memory
requirements are of no concern. Each filter in the filter bank consists of four sequential direct
form-2 transpose 2
nd
order filter sections (Van den Enden et al., 1989). The direct form-2
transpose filters maintain the dynamic range of the signal in the fixed-point filter structure
that we have chosen.
The output of the filters are normalized by the 1-norm and then integrated over a certain
amount of time to get an estimate of the signal energy during this time period. We have
used an IIR filter to facilitate the integration, which is a processing-wise cheap way of
carrying this out. The integrator remembers the history approximately one second back in
time. The integrator output is finally subsampled into a 1 Hz feature interval to eliminate
redundant information. In this manner, feature vectors representing 1-second epochs are fed
into the classifier.
3.2 Classifying evidence of hypoglycaemia
An important part of the algorithm is the classifier, which determines if there is evidence of
hypoglycaemia in a small part of the EEG signal. The classifier bases its judgment on the
extracted features, which represent the statistical properties of the EEG during 1-second
epochs. The classifier combines the input statistics in a mathematical expression that results
in either a “1” if the EEG has a hypoglycaemia pattern or a “0” otherwise.
There are many ways of setting up the mathematical classifier expression, and depending on
this expression, the ability to classify the hypoglycaemia pattern varies. We have
experimented with different kinds of classifier methods and found that the performance
variation between them is small. The more advanced non-linear classifiers like support
vector machines (SVM) (Joakims, 2002) and artificial neural networks (ANN) do however
have small performance advantages over the more simple classifiers such as linear classifiers
or the Bayes classifier with a Gaussian kernel (Bishop, 1998).
Based on our results, we have chosen to use a two-layer feed-forward ANN classifier
structure to do all classification tasks in the hypoglycaemia alarm system. The ANN has a
number of hidden units and uses the tanh sigmoid function for non-linear mappings.
Biosensors for Health, Environment and Biosecurity
282
Fig. 7. Structure of the artificial neural network that detects HREC. It consists of a number of
inputs and hidden layers, but only one final output determining whether or not the input
epoch contains HREC.
The input layer values (x
0
- x
5
) contain the feature values, where x
0
is a bias. The ANN
classifier expression is shown in equation (1),
y
n
= az
h
gw
h,i
x
n,i
i=0
N
i
h=0
N
h
(1)
where x
n,i
is the input feature number i at time n, w
h,i
is the input feature weight for the
mapping to the hidden unit h, N
h
is the number of input features, g is the nonlinear
mapping function (tanh), z
h
is the output weight for the hidden unit h, N
h
is the number of
hidden units, a is the output activation function and y
n
is the classifier output at time n. In
our setting, the output activation function is simply a logic expression that determines
whether or not the contained value has exceeded a threshold. The output y
n
is shown as “1”
if a HREC is detected, or otherwise, as “0”.
3.3 Classifier training
The optimal parameters of the classifier (w
h,i
and z
h
) can be estimated by using the back-
propagation method (Bishop, 1998), based on a training set of labelled data points. We have
used a neural network toolbox that applies a maximum a posteriori approach when finding
the optimal weights (Sigurdsson et al., 2002). The precise classifier parameter optimization
approach is of little importance in this application. Instead, the data labelling method
impacts the classifier performance more. We have experimented with two data labelling
approaches, where the first approach is based on expert labelling of experiment data, and
the second approach is a flexible automatic labelling based on standard experiment
parameters.
In the first data labelling approach, a neurophysiologist labelled a training set of EEG data,
based on visual inspection of the raw EEG. The visual inspection is rather time consuming
and is not feasible when larger amounts of data are used for training of the classifier. During
the process of marking the data, the neurophysiologist was blinded to the timeline and
Using the Brain as a Biosensor to Detect Hypoglycaemia
283
associated blood glucose sample values that had been measured while sampling the EEG.
The neurophysiologist only knew that the EEG originated from a diabetes patient where
both euglycaemia and hypoglycaemia situations were present in each experiment EEG
dataset.
The second approach to data labelling is automatic and based on parameters that are
associated with the experiment timeline and glucose values measured during the
experiment. One direct advantage of using this approach is that all data can be used for
modelling, and not just the data marked by the neurophysiologist. This allows for better
modelling of the inter-subject variability. When using the second approach, the labelling is
not predefined. Instead, time intervals with different reward functions are defined. Within
such a time interval, the number of positive and negative labels rather than the exact
timestamp of the label is used to determine the cost function of the classifier model. The
time segments with different reward functions are shown in Figure 8, where β is the glucose
threshold of 3.5 mmol/l that determines when an alarm may, but not necessarily will, be set
off. T
0
is the point in time when cognition has deteriorated too much for the subject to be
able to react to an alarm, T
0-
τ
is 10 minutes prior to T
0
and T
GL<
β
are the times where the
glucose level passes the threshold of 3.5 mmol/l.
Fig. 8. Reward function time segments used to train the classifier.
In segment A and E, the classifier cost function is punished for detecting HREC, while
rewarded in segment B and C. In segment D, the classifier is neither rewarded nor punished
for its behaviour. The exact expression for the cost function is given in equation (2).
C =− y
n
A
+ y
n
B
+ 2y
n
C
− y
n
E
(2)
When the cost function expression is applied to a linear classifier with a single hidden unit,
and optimized, we get the basic influences of the features. The classifier input weights w
h,i
Biosensors for Health, Environment and Biosecurity
284
show the importance of each feature. In Figure 9 the weights are shown for the linear
classifier.
Fig. 9. Coefficients of a linear HREC classifier.
Many of the coefficients have small values and could be disregarded and many features
could be joined since they have similar influence on the classifier output. It is evident that
the HREC paradigm is characterized by high 6-8 Hz activity and some alpha activity.
3.4 Integration of evidence
Single events detected by the classifier do not make up sufficient evidence to trigger an
alarm. The brainwaves are contaminated with noise and artefacts, leading to false
detections. Furthermore, brainwaves similar to those seen during hypoglycaemia also
appear sporadically during euglycaemia. It is therefore necessary to take the history of
detected events into account before giving a hypoglycaemia alarm. We used the history by
integrating the events that were detected during the past 10 minutes. The integrator is
implemented as an IIR filter which makes it computationally cheap while only consuming
little memory. The integration structure is shown in Figure 10.
Fig. 10. Filter structure used for integration of evidence.
The coefficients P1-P8 are set to make the resulting time-function resemble a 5-minute
square window. The shape of the integrator can easily be changed to have different weight
and time perspectives, by changing the coefficients.
Using the Brain as a Biosensor to Detect Hypoglycaemia
285
An example of the integrator output is shown in Figure 11, where a diabetes patient
undergoes hypoglycaemia and recovers from the situation.
Fig. 11. Example of integrated evidence of the HREC. The red dots are blood glucose sample
values sampled during the experiment. The solid line shows the value of the integration
function, which alarms the subject when exceeding the predefined threshold of 2.5. The
lower graph displays the events. One red vertical line represents an epoch in which HREC is
detected.
3.5 Deep sleep algorithm
Initially, the hypoglycaemia algorithm was based on EEG from daytime experiments only.
Figure 12 shows the output when it is applied on EEG recorded during sleep. The result is
repeated detections of EEG changes compatible with hypoglycaemia during the night.
Fig. 12. Integrated events of EEG changes compatible with hypoglycaemia in a diabetes
patient exposed to hypoglycaemia during the daytime and continued EEG recorded during
sleep. The algorithm clearly detected repeated episodes during sleep as being consistent
with hypoglycaemia.
Nocturnal hypoglycaemia thus encompasses a distinctive challenge with respect to a
hypoglycaemia alarm. Not only do approximately half of all hypoglycaemic events take
place during sleep (Woodward et al., 2009), but also the nocturnal EEG is distinctly different
from the daytime EEG. During stages of deep sleep, the EEG pattern is characterized by
slow wave patterns much like the hypoglycaemia EEG. It is therefore a challenge to
Biosensors for Health, Environment and Biosecurity
286
distinguish deep sleep EEG patterns from HREC. In order to suppress falsely detected
hypoglycaemia events, we used a learning process that is similar to learning the HREC to
construct a classifier that can detect when deep sleep patterns are contaminating the EEG
signal. It should be noted that during the 27 insulin-induced hypoglycaemia night
experiments that we have conducted so far, no deep sleep patterns have been present
simultaneously with HREC.
3.6 Noise and artefact suppression
In an everyday life environment, the presence of noise and artefacts is substantial. Some of
these operate in the same frequency band as the HREC, potentially leading to false alarms.
Figure 13 shows an example of a false alarm detected during euglycaemia and normal
daytime activities. The false alarm is caused by muscle activity when chewing. Many other
daytime activities also come close to setting off false alarms.
Fig. 13. Integrated HREC evidence during normal everyday activity. A false alarm is
declared just before 20:00.
In order to suppress falsely detected hypoglycaemia events due to noises and artefact, we
have constructed a classifier that can detect when noise and artefacts are contaminating the
EEG signal using a learning process similar to learning the HREC. When this noise/artefact
detection system is applied to the algorithm, the false alarm in Figure 13 is removed, and
other false events are handled. The result is displayed in Figure 14. The integrated evidence
is now generally lower during the normal situation, allowing us to make the HREC classifier
more sensitive.
4. Clinical results
The following paragraph will focus on the clinical studies we have conducted. The focus of
these studies has been the development of the algorithm for an EEG-based hypoglycaemia
alarm device. The results we have achieved give an indication of the clinical applicability of
the device. Here we will briefly summarize the results from the clinician’s point of view.
Altogether, we have studied more than 50 patients. An important observation is that all
patients studied so far have developed EEG changes compatible with previously described
hypoglycaemia associated changes. This has allowed us to develop a general algorithm for
EEG analysis, which can be applied to all diabetes patients.
Using the Brain as a Biosensor to Detect Hypoglycaemia
287
Fig. 14. Integrated HREC evidence after suppression of noise and artefacts. The vertical lines
in the lower graph display the detected hypoglycaemia (red) and noise (green) events.
Initially, continuous EEG was recorded during insulin-induced hypoglycaemia experiments
in 15 type 1 diabetes patients during daytime. Four subcutaneous electrodes located in the
temporal region were applied along with a standard scalp 10/20 system recording. The
cognitive function was evaluated by repeated cognitive testing (a backward counting test
and a minus-seven test). Insulin infusion was terminated when plasma glucose reached 1.8
mmol/l or when the subjects showed obvious signs of cognitive dysfunction such as
severely reduced speech velocity or heavy sweating. EEG was analysed post hoc by the
automated mathematical algorithm. HREC were detected in all 15 subjects. Plasma glucose
at the time of EEG changes above the threshold value indicating hypoglycaemia, ranged
from 2.0 to 3.4 mmol/l and occurred 29±28 minutes (mean±SD)(range 3 – 113 minutes)
before termination of insulin infusion. In this study, patients did not receive a real-time
alarm, and therefore, it is not possible to state if they would have been able to react
following an alarm. In 12 of 15 patients, however, EEG changes occurred before severe
neuroglycopenia was apparent as evaluated by the cognitive testing. In three cases, the
patients were moderately cognitively impaired at the time of EEG changes, they were,
however, still awake. The presence and the time of alarm were independent of age, diabetes
duration and glucose regulation (Juhl et al., 2010). Although this study did not prove that an
alarm could be given in time for the patient to react, it indicated that it would in most cases.
Due to the characteristic EEG pattern during sleep, occasionally resembling HREC, it is
essential to study the applicability of the algorithm during sleep. Initially, we performed a
number of pilot experiments in type 1 diabetes patients exposed to insulin-induced
hypoglycaemia during sleep. The original algorithm was trained on these data, and the
algorithm was optimized to distinguish hypoglycaemia from deep sleep. Ten type 1 diabetes
patients (mean age 47 years, diabetes duration 23.7 years, HbA1c 7.5%) all suffering from
hypoglycaemia unawareness, were subsequently subjected to induced hypoglycaemia by
graded insulin infusion both during daytime and during sleep at night-time. EEG was
recorded from a single electrode with three measurement points placed subcutaneously in
the temporal region and was analysed real-time. The patient received an auditory alarm
when EEG-changes met a predefined threshold. The patients were instructed beforehand to
consume a sandwich and a juice at the time of alarm. Figure 15 illustrates the procedure of a
night experiment.
Biosensors for Health, Environment and Biosecurity
288
Fig. 15. Representative example of a night-time experiment. The upper panel shows the
blood glucose profile (red circles) and the curve for integrated EEG-events of
hypoglycaemia (black line). The integration curve rose steeply following hypoglycaemia.
The patient received an alarm at blood glucose 1.8 mmol/l, where the integration curve
crossed the threshold (blue dotted line). Blood glucose increased following ingestion of the
meal, and the integration curve normalized accordingly. The middle panel shows the sleep
stage according to AASM scoring. The patient clearly went through all stages of sleep
during the night. After a short awake period following the hypoglycaemia event, the patient
went back to sleep. The lower panels show two-second epochs of EEG while awake (B),
REM sleep (D), stage three sleep (A) and hypoglycaemia (C).
If blood glucose fell to 1.7 mmol/l without triggering the alarm or if the patient was not able
to react at the time of the alarm, hypoglycaemia was ceased by glucose infusion. The alarm
was triggered for seven out of nine patients during daytime (mean blood glucose (BG) 2.7
mmol/l). Six of these seven patients were able to reverse hypoglycaemia by carbohydrate
ingestion. During sleep, the alarm was triggered in nine out of ten subjects (mean BG 2.0
mmol/l) and eight awoke due to the alarm. Four corrected hypoglycaemia by food ingestion
(mean BG 2.2 mmol/l) while the remaining four (mean BG 1.9 mmol/l) were supplemented
with glucose due to cognitive impairment. Two events of false alarm were observed. EEG
was also recorded from surface electrodes placed according to the 10/20 system and
analysed by the American Academy of Sleep scoring manual to determine sleep stages (Iber
et al., 2007). HREC occurred irrespective of the sleep stages and seemed to overrule
physiological sleep related patterns.
By post hoc improvements of the algorithm (e.g. inclusion of hypoglycaemia evidence
rejection due to deep sleep patterns and/or noise artefacts) it was possible to detect
hypoglycaemia in all patients, while eliminating the false alarms. In addition, hypoglycaemia
could be detected on average three (daytime experiments) and six (sleep experiments) minutes
earlier than with the original algorithm, improving the sensitivity of the alarm.
Using the Brain as a Biosensor to Detect Hypoglycaemia
289
Overall, it seems possible to detect hypoglycaemia in diabetes patients irrespective of the
time of the day, duration of diabetes, awareness status and hormonal counter-regulation.
The core question is whether this detection precedes serious cognitive impairment, allowing
the patient to react. This is currently being tested in clinical trials.
5. An EEG based hypoglycaemia device for permanent use
The EEG based hypoglycaemia alarm system consists of two main parts: An implanted
device that captures the EEG signal, and a non-implanted device, which stores and
processes the EEG signal. This is illustrated in Figure 16.
The inner device is implanted subcutaneously, with the main part behind the ear and the
electrode pointing towards the top of the head. The electrode has three measurement points,
a length of 8 cm and a diameter of 1.1 mm.
Data is transmitted from the inner device to the outer device through a near field
communication link. Therefore, the two devices have to be closely aligned for the system to
function. The outer device is designed as an ear hanger, illustrated on the right panel of
Figure 16. It is therefore easy to wear with a minimum of discomfort for the user. The outer
device contains a sound generator and a light indicator to inform the user of critical events,
e.g. impending hypoglycaemia.
The outer device contains a power source. When the outer device is placed behind the ear,
the power source is shared with the inner device through the communication link. When the
power source in the outer device is depleted, it must be recharged in a charging station. A
full recharge allows for approximately 18 hours of use.
Fig. 16. The EEG based hypoglycaemia alarm system consisting of an inner and an outer
device.
The implantation procedure is simple and takes approximately 15 minutes. The implanted
device must be replaced only after two years of use.
6. Conclusion
Type 1 diabetes patients suffering from hypoglycaemia unawareness are significantly
disposed to episodes of severe hypoglycaemia. This is associated with a risk of glucose
metabolic dysregulation and a reduced quality of life (Anderbro et al., 2010; Barnard et al.,
2010; Frier, 2008). Despite self-monitoring of blood glucose, the use of insulin analogues and
increased knowledge of the mechanisms of unawareness, the risk of hypoglycaemia remains
Biosensors for Health, Environment and Biosecurity
290
a major barrier to optimized glucose control. If just one of the two components of
hypoglycaemia associated autonomic failure (Cryer, 2005) (i.e. hypoglycaemia unawareness
or reduced hormonal counter-regulation) could be re-established, these patients would be
much less prone to severe hypoglycaemia.
The initial clinical studies of continuous EEG recording and real-time data processing
during insulin-induced hypoglycaemia in type 1 diabetes patients indicate that it will be
possible to predict incidents of severe hypoglycaemia before the patients are severely
cognitive impaired both during daytime and sleep. The studies conducted so far, though,
have taken place in clinical research units. We are now testing the hypoglycaemia alarm in
an out-patient setting.
It is of utmost importance that an alarm device has a high sensitivity and specificity. False
alarms may be annoying to the patients yet they are not dangerous. Missed alarms, on the
other hand, may render the patient with a false feeling of security. On the other hand, a
sensitive and reliable alarm device will allow the patient to achieve a better glucose control
with less fear of hypoglycaemia events. The studies conducted so far hold promises that an
EEG based device might fulfil these goals.
7. Acknowledgement
First of all, we would like to thank the patients who volunteered to participate in the clinical
trials. Conducting these studies was essential in the development of the algorithm. Thanks
to Marianne Bötcher, Lone Jensen, and Charlotte Olsen for excellent technical assistance
during the conduction of the hypoglycaemia studies. Thanks to Poul Jennum and Michaela
Gjerstadt for analyses of and advice regarding the recording and analysis of sleep EEG.
8. References
Amiel, SA.; Pottinger, RC.; Archibald, HR.; Chusney, G.; Cunnah, DT.; Prior, PF. & Gale, EA.
(1991). Effect of antecedent glucose control on cerebral function during
hypoglycemia. Diabetes Care, Vol.14, No.2, pp. 109-118.
Anderbro, T.; Amsberg, S.; Adamson, U.; Bolinder, J.; Lins, PE.; Wredling, R.; Moberg, E.;
Lisspers, J. & Johansson UB. (2010). Fear of hypoglycaemia in adults with Type 1
diabetes. Diabet Med, Vol.27, No.10, pp. 1151-1158.
Barnard, K.; Thomas, S.; Royle, P.; Noyes, K. & Waugh, N. (2010). Fear of hypoglycaemia in
parents of young children with type 1 diabetes: a systematic review. BMC Pediatr,
10:50.
Bendtson, I.; Gade, J.; Rosenfalck, AM.; Thomsen, CE.; Wildschiodtz, G & Binder, C. (1991).
Nocturnal electroencephalogram registrations in type 1 (insulin-dependent)
diabetic patients with hypoglycaemia. Diabetologia, Vol. 34, No.10, pp. 750-756.
Bergenstal, RM.; Tamborlane, WV.; Ahmann, A.; Buse, JB.; Dailey, G.; Davis, SN.; Joyce, C.;
Peoples, T.; Perkins, BA.; Welsh, JB.; Willi, SM. & Wood, MA. (2010). Effectiveness
of sensor-augmented insulin-pump therapy in type 1 diabetes. N Engl J Med,
Vol.363, No.4, pp.311-320.
Bjorgaas, M.; Sand, T.; Vik, T. & Jorde, R. (1998). Quantitative EEG during controlled
hypoglycaemia in diabetic and non-diabetic children. Diabet Med, Vol. 15, No.1, pp.
30-37.
Using the Brain as a Biosensor to Detect Hypoglycaemia
291
Bishop, CM. (1998). Neural Networks for Pattern Recognition. 1st ed. Oxford University Press,
New York, USA.
Crespel, A. & Gélisse, P. (2005). Altas of Electroencephalography. 1st ed. John Libbey Eurotext,
Montrouge, France.
Cryer, PE. (2005). Mechanisms of hypoglycemia-associated autonomic failure and its
component syndromes in diabetes. Diabetes, Vol.54, No.12. pp. 3592-3601.
Frier BM. (2008). How hypoglycaemia can affect the life of a person with diabetes. Diabetes
Metab Res Rev 2008 Vol. 24, No.2, pp. 87-92.
Geddes, J.; Schopman, JE.; Zammitt, NN. & Frier, BM. (2008). Prevalence of impaired
awareness of hypoglycaemia in adults with Type 1 diabetes. Diabet Med, Vol.25,
No.4, pp. 501-504.
Gold, AE.; MacLeod, KM. & Frier, BM. (1994). Frequency of severe hypoglycemia in patients
with type I diabetes with impaired awareness of hypoglycemia. Diabetes Care,
Vol.17, No.7, pp. 697-703.
Hammer, M.; Lammert, M.; Mejias, SM.; Kern, W. & Frier, BM. (2009). Costs of managing
severe hypoglycaemia in three European countries. J Med Econ, Vol. 12, No.4, pp.
281-290.
Hojlund, K.; Wildner-Christensen, M.; Eshoj, O.; Skjaerbaek, C.; Holst, JJ.; Koldkjaer, O.;
Møller Jensen, D. & Beck-Nielsen, H. (2001). Reference intervals for glucose, beta-
cell polypeptides, and counterregulatory factors during prolonged fasting. Am J
Physiol Endocrinol Metab, Vol.280, No.1, pp. E50-E58.
Howorka, K.; Pumprla, J.; Saletu, B.; Anderer, P.; Krieger, M. & Schabmann, A.
(2000). Decrease of vigilance assessed by EEG-mapping in type I diabetic patients
with history of recurrent severe hypoglycaemia. Psychoneuroendocrinology, Vol. 25,
No.1, pp. 85-105.
Hyllienmark, L.; Maltez, J.; Dandenell, A.; Ludvigsson, J. & Brismar T. (2005). EEG
abnormalities with and without relation to severe hypoglycaemia in adolescents
with type 1 diabetes. Diabetologia, Vol.48, No.3, pp. 412-419.
Iaione, F. & Marques, JL. (2005). Methodology for hypoglycaemia detection based on the
processing.; analysis and classification of the electroencephalogram. Med Biol Eng
Comput, Vol.43, No.4, pp. 501-507.
Iber, C.; Ancoli-Isreal, S.; Chesson, A.; & Quan, SF. (2007). The AASM Manual for the
Scoring of Sleep and Associated Events, Rules, Terminology and Technical
Specifications. 1
st
ed. American Academy of Sleep Medicine, Westchester, Illinois.
JDRF CGM Study Group. (2010). Prolonged nocturnal hypoglycemia is common during 12
months of continuous glucose monitoring in children and adults with type 1
diabetes. Diabetes Care, Vol. 33, No.5. pp. 1004-1008.
JDRF CGM Study Group. (2008). Continuous glucose monitoring and intensive treatment of
type 1 diabetes. N Engl J Med, Vol. 359, pp. 1464–1476.
Joakims, T. (2002). Leaning to Classify test using Support Vector Machines. 1st ed. Kluwer
Academic Publishers. Boston, USA.
Juhl, CB.; Hojlund, K.; Elsborg, R.; Poulsen, MK.; Selmar, PE.; Holst, JJ.; Christiansen, C &
Beck-Nielsen, H. (2010). Automated detection of hypoglycemia-induced EEG
changes recorded by subcutaneous electrodes in subjects with type 1 diabetes-The
brain as a biosensor. Diabetes Res Clin Pract, Vol.88, No.1, pp. 22-28.
Biosensors for Health, Environment and Biosecurity
292
Lammert, M.; Hammer, M. & Frier, BM. (2009). Management of severe hypoglycaemia:
cultural similarities.; differences and resource consumption in three European
countries. J Med Econ, Vol.12, No.4, pp. 269-280.
Monami, M.; Marchionni, N. & Mannucci, E. (2009). Long-acting insulin analogues vs. NPH
human insulin in type 1 diabetes. A meta-analysis. Diabetes Obes Metab, Vol. 11,
No.4, pp. 372-378.
Pedersen-Bjergaard, U.; Pramming, S.; Heller, SR.; Wallace, TM.; Rasmussen, AK.;
Jorgensen, HV.; Matthews, DR.; Hougaard, P & Thorsteinsson, B. (2004). Severe
hypoglycaemia in 1076 adult patients with type 1 diabetes: influence of risk
markers and selection. Diabetes Metab Res Rev, Vol.20, No.6, pp. 479-486.
Pickup, JC. & Sutton, AJ. (2008). Severe hypoglycaemia and glycaemic control in Type 1
diabetes: meta-analysis of multiple daily insulin injections compared with
continuous subcutaneous insulin infusion. Diabet Med, Vol.25, No.7, pp. 765-774.
Pramming, S.; Thorsteinsson, B.; Stigsby, B. & Binder, C. (1988). Glycaemic threshold for
changes in electroencephalograms during hypoglycaemia in patients with insulin
dependent diabetes. Br Med J (Clin Res Ed) Vol.296, No.6623, pp.665-677.
Pramming, S.; Thorsteinsson, B.; Bendtson, I.; & Binder, C. (1990). The relationship between
symptomatic and biochemical hypoglycaemia in insulin-dependent diabetic
patients. J Intern Med, Vol.228, No.6, pp. 641-646.
Regan, PF. & Browne-Mayers, AN. (1956). Electroencephalography, frequency
analysis and consciousness, a correlation during insulin-induced hypoglycemia. J
Nerv Ment Dis, Vol.124, No.2, pp.142-147.
Ross, IS. & Loeser, LH. (1951). Electroencephalographic findings in essential hypoglycemia.
Electroencephalogr Clin Neurophysiol, Vol.3, No.2, pp. 141-148.
Sigurdsson, S.; Larsen J.; Hansen LK.; Philipsen PA. & Wulf, HC. (2002). Outlier estimation
and detection: Application to Skin Lesion Classification. Proceedings of IEEE
International conference on acoustics.; speech and signal processing.
Tamborlane, WV.; Beck, RW.; Bode, BW.; Buckingham, B.; Chase, HP.; Clemons, R.; Fiallo-
Scharer, R.; Fox,LA.; Gilliam,LK.; Hirsch, IB.; Huang, ES.; Kollman, C.; Kowalski,
AJ.; Laffel, L.; Lawrence, JM.; Lee, J.; Mauras, N.; O'Grady, M.; Ruedy, KJ.; Tansey,
M.; Tsalikian, E.; Weinzimer, S.; Wilson, DM.; Wolpert, H.; Wysocki, T. & Xing, Dl.
(2008). Continuous glucose monitoring and intensive treatment of type 1 diabetes.
N Engl J Med, Vol.359, No.14, pp.1464-1476.
Tamburrano, G.; Lala, A.; Locuratolo, N.; Leonetti, F.; Sbraccia, P.; Giaccari, A.; Busco, S. &
Porcu, S. (1988). Electroencephalography and visually evoked potentials during
moderate hypoglycemia. J Clin Endocrinol Metab, Vol.66, No.6, pp. 1301-1306.
The Diabetes Control and Complications Trial Research Group. (2009). The effect of
continuous glucose monitoring in well-controlled type 1 diabetes. Diabetes Care,
Vol.32, No.8, pp. 1378-83.
Tribl, G.; Howorka, K.; Heger, G.; Anderer, P.; Thoma, H. & Zeitlhofer, J. (1996). EEG
topography during insulin-induced hypoglycemia in patients with insulin-
dependent diabetes mellitus. Eur Neurol, Vol.36, No.5, pp. 303-309.
Van Den Enden, AWM. & Verhoeckx, NAM. (1989). Discrete-time signal
processing. Prentice Hall. Hertfordshire, UK.
Woodward, A.; Weston, P.; Casson, IF. & Gill, GV. (2009). Nocturnal hypoglycaemia in type
1 diabetes-frequency and predictive factors. QJM, Vol.102, No.9, pp. 603-607.
13
Electrochemical Biosensor for Glycated
Hemoglobin (HbA1c)
Mohammadali Sheikholeslam, Mark D. Pritzker and Pu Chen
University of Waterloo
Canada
1. Introduction
Diabetes is recognized as a group of heterogeneous disorders with the common elements of
hyperglycaemia and glucose intolerance due to insulin deficiency, impaired effectiveness of
insulin action or both (Harris & Zimmet, 1997). If left untreated or improperly managed,
diabetes can result in a variety of complications, including heart disease, kidney disease, eye
disease, impotence and nerve damage. Diagnosis and management of the disease require a
tight monitoring of blood glucose levels that serves a number of purposes:
provides a quick measurement of blood glucose level at a given time.
determines if a diabetic person has a high or low blood glucose level at a given time.
demonstrates the link between lifestyle, medication and blood glucose levels.
helps diabetics and diabetes health-care teams make changes to lifestyle and medication
that will improve blood glucose levels.
Electrochemical biosensors for glucose (glucose meters) play a leading role for this purpose.
For the purpose of measuring daily glucose levels to control food intake and insulin usage,
these glucose meters work although some difficulties exist. For example, blood glucose level
measurements are recommended three to four times per day. Due to the large fluctuations
in glucose levels that naturally occur over the course of a day, measurements on an empty
stomach and within 2 h of eating are required for comparison purposes. These problems are
more prominent for the diagnosis of diabetes and determining the link between lifestyle and
medication once a patient has been diagnosed with this disease.
Historically, measurement of glucose levels has been the method universally used to
diagnose diabetes. Laboratory methods such as fasting plasma glucose (FPG) or 2-h plasma
glucose (2HPG) level have been used for this purpose. However, this approach still suffers
from the same problems and difficulties associated with glucose biosensors such as the need
for fasting, biological variability and the effects of acute perturbations (e.g., stress- or illness-
related) on glucose levels. It has recently been concluded that the best marker for long term
glycaemic control is whole blood glycated hemoglobin (i.e., hemoglobin A1c denoted as
HbA1c) since its levels respond to the long-term progression of diabetes without the short-
term fluctuations characteristic of glucose (Berg & Sacks, 2008). Also, the use of this
approach solves many of the problems associated with FPG or 2HPG methods based on
glucose measurements such as no need for fasting, substantially less biological variability
and relative insensitivity of HbA1c levels to acute perturbations. On the other hand with
advances in instrumentation and standardization, the accuracy and precision of A1C assays
Biosensors for Health, Environment and Biosecurity
294
at least match those of glucose assays. Consequently, the decision was made by the
International Expert Committee (with members appointed by the American Diabetes
Association, the European Association for the Study of Diabetes, and the International
Diabetes Federation) that the A1c assay should be considered as the primary method for the
diagnosis of diabetes (Nathan, 2009).
HbA1c is a stable glycated hemoglobin derivative formed by the non-enzymatic reaction of
glucose with the N-terminal valine of the β-chain of normal adult Hb (HbA). Since it reflects
the average blood glucose level over the preceding 2–3 months and is not affected by the
daily fluctuation of the glucose level, the HbA1c level provides a more accurate index for
diagnosis and long term control of the disease. Traditionally, clinical laboratory assays for
HbA1c have been obtained by ion-exchange chromatography, immunochemical methods,
electrophoresis and boronate affinity chromatography. However, these methods are time-
consuming, require trained personnel and expensive equipment and have limited
availability in many areas of the world. So point-of-care (POC) devices are needed for
diabetes diagnosis and management. Point-of-care testing (POCT) is defined as diagnostic
testing at or near the site of patient care (Kost, 2002). The driving notion behind POCT is to
bring the test conveniently and immediately to the patient. This increases the likelihood that
the patient will receive the results in a timely manner. Such devices would allow for
immediate availability of A1C measurements and greatly enhance diabetes care. Currently,
eight HbA1c POC devices are available commercially with generally accepted performance
criteria for HbA1c, but only one of them has met the acceptance criteria of NGSP
1
with two
different reagent lots. Also, the reproducibility of production of the different reagent lots of
the POC instruments investigated appears inadequate at this moment for optimal clinical
use (Lenters-Westra & Slingerland, 2010). As a result, the American Diabetes Association
(ADA) recently decided to exclude POC methods from their list of recommended methods
for HbA1c diagnosis, stating that they are not yet accurate enough (NGSP, 2010). Also,
among these POC instruments, only one is designed for patient use at home, whereas the
others are suitable only for clinics and physician offices due to their high price ($1000-$3000)
and complicated operation. Consequently, considerable work is still needed for the
development of accurate, simple and cheap HbA1c biosensors. Although an HbA1c
measurement is recommended quarterly and not as frequently as in the case of glucose, its
role in prevention, diagnosis and management of diabetes is critical.
2. Electrochemical biosensors
A biochemical sensor is a small device consisting of a transducer covered by a biological
recognition layer which interacts with the target analyte. The chemical changes resulting
from this interaction are converted by the transducer into electrical signals. Electrochemical
biosensors combine the analytical power of electrochemical techniques with the specificity
of biological recognition processes to produce an electrical signal that is related to the
concentration of an analyte (Wang, Analytical Electrochemistry, 2006). In electrochemical
biosensors, the transducer is an electrode. Based on the nature of the biological recognition
process, two general categories of electrochemical biosensors can be defined: biocatalytic
devices (utilizing enzymes, cells or tissues as immobilized biocomponents) and affinity
1
National Glycohemoglobin Standardization Program
Electrochemical Biosensor for Glycated Hemoglobin (HbA1c)
295
sensors (based on antibodies, membrane receptors or nucleic acids) (Wang, Analytical
Electrochemistry, 2006). Electrochemical biosensors can be further divided into the sub-
categories of potentiometric, amperometric and impedimetric biosensors depending on their
mode of operation (Pohanka & Skládal, 2008). Electrochemical biosensors are widely used in
the medical field. One of the most important applications of such devices is for the diagnosis
and management of diabetes, a topic which has received a great deal of interest due to its
urgent need and as a model system for sensor development.
2.1 Glucose biosensors
Glucose biosensors are one of the key elements in treating and management of diabetes.
Many diabetics use these devices to measure their blood glucose level every day. In fact,
glucose biosensors occupy 85% of the entire biosensor market. Such huge market size has
made diabetes a model disease for developing new biosensing concepts (Wang,
Electrochemical Glucose Biosensors, 2008). It is has been about 36 years since the first
commercial glucose biosensor was introduced into the commercial market (Pohanka &
Skládal, 2008). From that date, different approaches have been explored and many devices
have been designed for individual diabetes control. In spite of the huge development in
glucose biosensors, diabetes control still has problems and so efforts are still being made to
further improve their use. Issues such as in vivo glucose measurement and insulin delivery
and long-term glucose level measurement are some areas of interest. As mentioned
previously, the problems associated with the measurement of long-term blood glucose
levels are leading to the development of HbA1c biosensors. HbA1c biosensors integrated
with personal glucose biosensors can greatly improve management and treatment of
diabetes.
3. HbA1c biosensors
3.1 Biosensors based on Fructosyl Valine (FV)
As mentioned previously, the problems associated with the measurement of long-term
blood glucose levels are leading to the development of HbA1c biosensors. HbA1c biosensors
integrated with personal glucose biosensors can greatly improve management and
treatment of diabetes. As mentioned previously, HbA1c is formed through the non-
enzymatic glycation of the terminal valine of beta sheets in hemoglobin. This HbA1c can be
digested to small glycated peptide fructosyl valine (FV) that can be further oxidized by the
enzyme fructosylamine oxidase (FAO). Enzymatic assay of HbA1c is based on the oxidation
of FV (as a model compound).
In one of the first studies on FV enzyme sensors, Sode et. al. used an isolated fructosyl
amine oxidase from marine yeast (Tsugawa, Ishimura, Ogawa, & Sode, 2000). They
fabricated 2 types of sensors: a mediator-type enzyme sensor (using carbon paste electrode)
and a hydrogen peroxidise–based enzyme electrode. Although lower potentials (150 mV vs.
Ag/AgCl) were applied for the mediator-type probe than for the other one (600 mV vs.
Ag/AgCl), the sensitivity of the hydrogen peroxidise sensor was found to be higher (0.42
μA mM
-1
cm
-2
). Consequently, further optimization of the operating conditions was needed
as well as the sensor design. In a subsequent study, this group developed an FAO-
peroxidase-ferrocene sensor and a Prussian blue-based FAO sensor (Tsugawa, Ogawa,
Ishimura, & Sode, 2001). The sensitivities of these probes were found to be similar to that of
the earlier hydrogen peroxidise sensor but the applied potentials were lowered dramatically