Expert Systems for Human Materials and Automation Part 9 ppt
Bạn đang xem bản rút gọn của tài liệu. Xem và tải ngay bản đầy đủ của tài liệu tại đây (1.11 MB, 30 trang )
Expert System Development for Acoustic Analysis in Concrete Harbor NDT
231
The electronics industry has provided inspectors with equipment that is capable of
detecting and recording the sonic wave signals that are produced by an impact. As a
result, there are currently several commercially available products available for such
signal acquisition. The most common devices for sonic data acquisition are the
instrumented hammer and the smart hammer. The instrumented hammer was developed
for the airline industry to be used in the detection of anomalies in airplane materials. It
measures and records the force-time history and amplitude frequency of an impact via the
use of an accelerometer embedded in the head of the hammer. The smart hammer was
developed for the shipbuilding industry. This instrument measures and records the sonic
response of an impact through a microphone. The microphone uses the sonic data, instead
of the force data, to create an acoustic signal. Both impact-force data generators and
impact-sound data generators have been proven to generate useful signals for non-
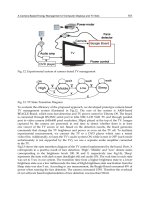
destructive sonic testing. The information gained. Fig.6. illustrates the block diagram of
proposed non destructive sonic testing system.
Fig. 6. Schematic diagram showing how impact-echo of proposed system works
7.5.1 Acoustic sounding
Acoustic sounding is used for surveying concrete structures to ascertain the presence of
delaminations. Delaminations can be a result of poor concrete quality, debonding of
overlays or applied composites, corrosion of reinforcement, freezing and thawing or
global softening. The test procedures used for delineating delaminations through
sounding include: coin tap, chain drag, hammer drag, and an electro-mechanical
sounding device. The purpose of each test is to sonically detect deficiencies in the
concrete. The American Society for Testing and Materials (ASTM) has created a standard,
ASTM D 4580 – 86, which covers the evaluation of delaminations. The standard describes
procedures for both automated and manual surveys of concrete. A major advantage to
sonic testing is that it produces immediate results on near surface anomalies. The
Expert Systems for Human, Materials and Automation
232
effectiveness of sonic testing relies heavily on the user's expertise in signal interpretation
and consistency.
Soundings are taken by striking the concrete surface to locate areas of internal voids or
delamination of the concrete cover. Although the results are only qualitative in nature, the
method is rapid and economical and enables an expeditious determination of the overall
condition. The inspector’s ability to hear sound in water is reduced by waves, currents, and
background noise. Soundings are the most elementary of NDT methods (Wu T et al 2000).
7.5.1.1 Impact hammer
A standard impact hammer (ASTM C 805), modified for underwater use, can be used for
rapid surveys of concrete surface hardness. The underwater readings, however, are
generally higher than comparable data obtained in dry conditions. These higher readings
could be eliminated by further redesigning of the Schmidt hammer for underwater use.
Data also can be normalized to eliminate the effect of higher underwater readings.
7.5.1.2 Coin-tap test
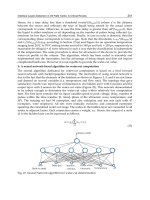
This important method of testing the concrete is one of the deepseated and most widely
researched ways of sonic testing. The test procedure requires the inspector or operator to tap
on the concrete sample with a small hammer, coin, or some other rigid object (impactor)
while listening or recording the sound resulting from the impact. Areas of nondelaminated
concrete will create a clear ringing sound upon impact while regions of delaminated,
disbonded, or softened concrete will create a dull or hollow sound (Fig.7). This change in
sonic characteristics is a direct result of a change in effective stiffness of the material. As a
result, the force-time function of an impact and its resulting frequencies of an impact differ
between areas of good and poor quality concrete (Cawley & Adams 1988)
Fig. 7. Spectra of time histories for a typical tap test results
8. Spectru & cepstrum analysis
The vibration spectrum can be expressed on a linear frequency scale with constant
bandwidth. This type of spectrum provides fine resolution at higher frequencies but a poor
resolution at lower frequencies. Whereas a constant percentage bandwidth analyzer uses
Expert System Development for Acoustic Analysis in Concrete Harbor NDT
233
logarithmic frequency scale and cover three decades with equal resolution. It is for this
reason that the best analysis method for the comparison of spectra and fault detection is the
use of constant percentage bandwidth with a logarithmic frequency scale (Farid Uddin
2003).
Cepstrum analysis is carried out to identify a series of harmonics or sidebands in the
spectrum. Cepstrum may be considered to be the frequency analysis of frequency analysis.
The power cepstrum is defined as:
()
()
{
}
-1
pxx
C τ = F lo
g
F
f
(1)
Where f
x
(t) is the time signal and its Fourier transform is
()
xx
Ff.
Fig. 8. shows a spectrum from a concrete structure in its deteriorated condition. It contains
several harmonics. It is not possible to detect from this spectrum that there are two series of
harmonics indicating two different phenomena.
Fig. 8. The spectrum from a concrete structure in its deteriorated condition
Cepstrum of this spectrum is also give in the side. It may be seen that the cepstrum
identifies these two families of harmonics (with a spacing of 48.5 Hz and 119.4 Hz
respectively). Fig. 9 shows the edited spectrum such that frequencies below that of half of
the impactor frequency are removed. The cepstrum of this spectrum is then calculated.
The cepstrum does not show the 119.4 Hz component at all. It indicates that this
component originates from the lower frequency range. The cepstrum does retain the 48.5
Hz component indicating its origin in the medium frequency range. It may thus be
concluded that the impactor effect on the tested structure at 49.8 Hz may have an
incipient fault while the recorded components at 119.4 Hz indicates delamination, voids
or other fault.
Expert Systems for Human, Materials and Automation
234
Fig. 9. Frequencies below that of half of the impactor frequency are removed.
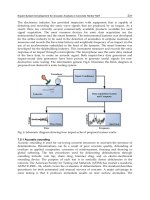
In this research the Acousto – Vibration (AV) technology utilized to detect defects, such as
voids and mix separations in the constructed pats.
9. Conclusion
The Reinforced Concrete Structure Diagnosis Expert System is implemented through this
research work as a prototype rule based system using the Professional expert system shell. It
is apparent that in the proposed method, the perfect undersea concrete structure should not
produce vibration signals more than the normal value. This is never the case, for it is
impossible to eliminate all asymmetries in the materials and geometry of the concrete and
steel armor in the structure. It results from the measurements having been carried out that
several predominant frequencies arise in the specimens under test.
To extract knowledge from the expert the knowledge engineer must become familiar with
problem of vibration and acoustic analysis. The rule base system is goal driven using
backward chaining strategy to test the collected structure vibration and acoustic properties
information is true. The case specific data plus the above information with the help of
explanation subsystem, allows the program to explain its reasoning to the user and will
provide the expert system shell requirements. Significant difference can exist between the
Expert System Development for Acoustic Analysis in Concrete Harbor NDT
235
signals created by subsea concrete defects. The respective amplitudes of the mentioned
signals may exceed each other in a different way in repeated measurements of the same
specimen. This device serves as a base for development of expert system monitoring
module. The change of reference signal with proposed expert system implies that something
within the subsea concrete structure has altered and diagnosis is made.
By integrating the different modules, the proposed system has the power to provide
diagnosis of problems in reinforced concrete harbor structures. This can assist civil
engineering trainees, inspectorate staff, professional engineers as well as their top harbor
management personnel regarding the likely problems so that early action can be taken.
The present work will be particularly of great assistance to new comers who are not familiar
with the field and will facilitate them in gaining a better understanding of the causes of the
problems and in making decisions about any necessary actions
10. References
British Standards Institution, (1985) "BS 8110: Part 1, Structural Use of Concrete", ,London.
British Standards Institution, (1991) "BS 5328: Parts 1 to 4, Specification of Concrete",
London.
Cawley, P. and Adams, R.D. (1988) 'The Mechanics of the Coin-Tap Method of Non-
Destructive Testing', J. Sound and Vibration, Vol 122, pp.299-316
Dym, Clive L. and Levitt, Raymond E.,(1991)"Knowledge Based Systems in
Engineering",McGraw-Hill, New York, 1991, pp. 15& 404 ISBN. O-O7-018563-8.
Filippetti F., et al.(1992).Development of expert system knowledge base to on-line diagnosis
of rotor electrical faults of induction motors. IEEE-Industry Applications Society
Annual Meeting, Bologna, pp. 92-99
Farid Uddin A. K. M., Ohtsu M, Hossain K. M. A., and Lachemi M (2007).Simulation of
reinforcement-corrosion-induced crack propagation in concrete by acoustic
emission technique and boundary lement method analysis. Canadian J. of Civil
Engineering, Oct , vol. 34, , no. 10, pp. 1197-1207
Graham-Jones, P. J., Mellor B. G. (1995) "Expert and knowledge-based systems in failure
analysis" Engineering Failure Analysis, Volume 2, Issue 2, June, pp.137-149
Hughes, D.M. (1972) "Underwater inspection of offshore structructurs – method and results.
Proc. Offshore Tech. Conf.,V.I, pp.541-546
Hedayati M. R. (2004).On-line condition monitoring of locomotives. Proceeding 7thRailway
conf., Tehran, Iran. pp. 217-223
Hedayati M.R., (2009). Sub-sea fiber optic cable maintenance using a ROV-based flux
leakage expert system. Journal of Artificial Life and Robotics 14(4):pp511-514
Korenska M, Chobola Z., Mikulková P., and Martinek J.(2003). On the application of impact-
echo method to assess the quality of ceramic roofing tiles. IV. Conf. MATBUD,
Krakow, pp. 239 – 244
Roddis, W. M. Kim, and Pasley, Gregory P., (1993) "Knowledge-Based Expert Systems in
Concrete Materials: Uniting Specifications, Data, and Models," Presentation at the
1993 Fall Convention, American Concrete Institute
Expert Systems for Human, Materials and Automation
236
Skala J. and Chobola Z (2005), “Frequency Inspection as a Tool to Assess the Armature
Corrosion. Workshop NDT 2005 Non- Destructive Testing at Engineering, Brno,pp.
159-161
WU, T. T. et al., (2000).On the Study of Elastic Wave Scattering and Rayleigh Wave Velocity
Measurement of Concrete with Steel Bar. vol. 33, UK: NDT & E International, pp.
401-407
Part 3
Automation & Control
0
Conceptual Model Development for a Knowledge
Base of PID Controllers Tuning in Open Loop
José Luis Calvo-Rolle
1
, Ramón Ferreiro García
1
, Antonio Couce Casanova
1
,
Héctor Quintián-Pardo
1
and Héctor Alaiz-Moreton
2
1
University of Coruña
2
University of León
Spain
1. Introduction
In the area of control engineering work must be constant to obtain new methods of regulation,
to alleviate the deficiencies in the already existing ones, or to find alternative improvements
to the ones that were being used previously. This huge demand of control applications is due
to the wide range of possibilities developed to this day.
Regardless of this increasing rhythm of discovery of different possibilities, it has been
impossible at this moment to oust relatively popular techniques, as can be the ’traditional’
PID control. Since the discovery of this type of regulators by Nicholas Minorsky (Mindell
(2004) and Bennett (1984)) in 1922 to this day, many have been the works carried out about
this controller. In this period of time there was an initial stage, in which the resolution of the
problem was done analogically and in it the advances were not as notable as have been since
the introduction of the computer, which permits to implement the known direct digital control
structure Auslander et al. (1978), illustrated in figure 1.
Since then, the regulators have passed from being implemented in an analogous way to
develop its algorithm control digitally, by signal digital processors. As well as carrying out the
classic PID control in digital form, its development based on computer allows adding features
to the regulator that with difficulty could have been obtained analogically.
Fig. 1. Structure of direct digital control
13
2 Will-be-set-by-IN-TECH
It must be said there exist usual control techniques for the processes in any area, in which
innovations have been introduced. But nevertheless, the vast majority of these techniques
in their implementation employ PID traditional controllers, although in an improved way,
increasing the percentage of use around 95% Astrom & Hagglund (2006). Its use is still very
high due to various reasons like: robustness, reliability, relative simplicity, fault, etc.
The great problem of the PID control is the adjustment of the parameters that it incorporates.
Above all in its topology Astrom & Hagglund (2006) Feng & Tan (1998), as a consequence
of the investigations carried out in the area, the contributions made by specialists have
been many, existing among them many methods to obtain the parameters that define this
regulator, achieved through different ways, and working conditions pertaining to the plant
being controlled. It must be highlighted that the methods developed to obtain the terms
which in occasions are empiric if they are always directed to optimise defined specifications;
the negative thing is that frequently when some are improved others get worse.
It is necessary to highlight that the empirical methods have been the first in to be discovered
and normally they are the ones who are first learnt, in the training of technicians in this
discipline. In this sense the parameters obtained in this manner through the application
of formulas of different authors, are a starting point of adjustment of the regulator, being
normally necessary to have to do fine adjustment.
Regardless of what has been said, in practice there is a big variety of regulators working in the
industry with an adjustment far from what can be considered optimum Astrom & Hagglund
(2006). This fact is originated among other reasons due to a lack of adjustment techniques by
the users.
This fact creates the necessity to employ intelligent systems, due to the demand of a
better performance and resolution of complex problems both for men as well as for the
machines. Gradually the time restrictions imposed in the decision making are stronger and the
knowledge has turned out to be an important strategic resource to help the people handling
the information, with the complexity that this involves. In the industry world, intelligent
systems are used in the optimization of processes and systems related with control, diagnosis
and repair of problems. One of the techniques employed nowadays are knowledge based
systems, which are one of the streams of artificial intelligence.
The development of knowledge based systems is very useful for certain knowledge domains,
and also indispensable in others. Some of the more important advantages that the knowledge
based systems offer are the following:
• Permanence: Unlike a human expert, a knowledge based system does not grow old, and
so it does not suffer loss of faculties with the pass of time.
• Duplication: Once a knowledge based system is programmed we can duplicate countless
times, which reduces the costs.
• Fast: A knowledge based system can obtain information from a data base and can make
numeric calculations quicker than any human being.
• Low cost: Although the initial cost can be high, thanks to the duplication capacity the final
cost is low.
• Dangerous environments: A knowledge based system can work in dangerous or harmful
environments for the human being.
• Reliability: A knowledge based system is not affected by external conditions, a human
being yes (tiredness, pressure, etc).
240
Expert Systems for Human, Materials and Automation
Conceptual Model Development for a Knowledge Base of PID Controllers Tuning in Open Loop 3
• Reasoning explanation: It helps justify the exits in the case of problematic or critical
domain. This quality can be employed to train personnel not qualified in the area of the
application.
Up to now the existing knowledge based systems for resolution of control systems have
reduced features (Pang (1991) Wilson (2005) Zhou & Li (2005) Epshtein (2000) Pang et al.
(1994) Pang (1993)), summarizing, in application of the method known as "Gain Schedulling"
?, which is based in programming the profits of the regulator with reference to the states
variables of the process. For the cases in which the number of control capacities have
increased, the knowledge based system, is applicable to specific problems. There is the
possibility to implement knowledge based systems programming them in the devices, but
without taking advantage of the existing specific tools of Knowledge Engineering Calvo-Rolle
(2007) Calvo-Rolle & Corchado (n.d.).
In accordance with what has been said, the development of a PID conceptual model is
described in this document to obtain the parameters of a regulator PID with the empirical
adjustment method in an open loop; feasible in the great majority of cases in which such
method is applicable. The model has been developed for six groups of different expressions
(formulas) with highly satisfactory results, and of course expandable to more following the
same methodology.
The present document is structured starting with a brief introduction topology PID regulator
employed, along with the traditional technique of which the conceptual method is derived,
an explanation of the method proposed that is divided in three parts: In the first part the
tests done to representative systems are explained, in the second part how the rules have
been obtained and in the third how the knowledge has been organised. It concludes with the
validation of the proposed technique.
2. PID controller
There are multiple forms of representation of the PID regulator, but perhaps the most extended
and studied one is the one given by equation 1.
u
(t)=K
e(t)+
1
Ti
t
0
e(t)dt + Td
de
(t)
dt
(1)
where u is the control variable and e is the error of control given by the e
= y
SP
−y (difference
between the specified reference by the entry and exit measured of the process). Therefore, the
variable of control is the sum of three different terms: P which is proportional to the error, I
which is proportional to the integral of the error and D which is proportional to the derivative
of the error (expression 2). The parameters of the controller are: the gain proportional K,
the integral time T
i
and the derivative time T
d
. If the function transfer of the controller is
obtained and a representation of the complex variable is done, the form is the one illustrated
in expression 2.
G
C
(s)=
U(s)
E(s)
=
K
1 +
1
T
i
·s
+ T
d
·s
(2)
There are several forms for the representation of a PID regulator, but for the implementation
of the PID regulator used, defined in the previous formula and more commonly known as the
Standard format Astrom & Hagglund (2006) Feng & Tan (1998), shown in the form of blocks
in figure 2.
241
Conceptual Model Development for a Knowledge Base of PID Controllers Tuning in Open Loop
4 Will-be-set-by-IN-TECH
Fig. 2. PID regulator in standard topology
Infinite are the industrial processes whose normal function is not the adequate for certain
applications. This problem, in many cases, is resolved through the employment of this
regulator, with which defined specifications are obtained in the control of processes leading
to optimum values for what was being done. The adjustment of this controller is carried out
varying the proportional gain and the integral and derivative times.
3. Adjustment of the open loop of PID regulators
It is true that to this day there are analytical methodologies to obtain the parameters of a
PID regulator, with the aim of obtaining an improved one or various specifications. From
a chronological point of view, the empirical procedures were born before the obtaining of
the parameters, and currently they are still used for various reasons like: the parameters are
obtained in an empiric way, they are simple techniques, a given characteristic is optimized,
good results are obtained in many cases, there is usually always a rule for the case that is
trying to be controlled, etc.
3.1 Steps to obtain the parameters
The empiric techniques are based on the following steps:
1. Experimental establishment of certain characteristics of the response of the process that
can be carried out with the plant working in open loop.
2. Application of formulas depending on the data previously obtained, to get the parameters
of the regulator, with the aim that the function of the plant with the controller is within
certain desired specifications.
3.2 Adjustment criteria
In the second stage the fact of situating the process within some desired specifications is
stressed. From the point of view of the empiric adjustment it makes sense to talk about
two types of principal specifications of the system in open loop, which are the ones stated
hereafter:
1. Set point control: this specification indicates the capacity of the regulated system to achieve
the changes made in the reference value.
2. Load disturbance: consists in the capacity of the system to attenuate possible noises or
disturbances the charge/ load in a constant value of the reference value desired.
In figure 3 two examples can be observed of a system regulated by two PID controllers,
adjusted to optimize both specifications previously mentioned. To the regulated systems a
unit step is introduced, and after some time a disruption is provoked. As can be seen in the
242
Expert Systems for Human, Materials and Automation
Conceptual Model Development for a Knowledge Base of PID Controllers Tuning in Open Loop 5
Fig. 3. Comparative between the Set point and Load disturbance response methods
curve identified as A corresponds to an adjusted regulator to improve the load disturbance
criterion and, clearly the disturbance has less effect than in the set point response. With
reference to curve B, the object was to regulate the system to improve set point control
criterion, and it is done in a more effective way, because in the case of the initial step
the temporary response is better than curve A, however it must be highlighted that in the
disturbance the sensitivity is higher for curve B.
If various formulas are employed in the tuning, the one chosen will be the one with a more
prudent response within the specification that is intended to achieve, and after that increasing
or decreasing the influence of the parameters of the controller until the response requested is
reached, avoiding to take the plant to a non desired functioning area.
After this, most different tuning criteria are discussed, making a classification according to
experimental testing of the response features of the system carried out in open loop.
3.3 Measurements of the characteristics of the response of the process
Within the steps to follow mentioned earlier, to obtain the parameters of the PID regulator, of
them, in which the purpose is to measure characteristics of the response of the process, can
be done in different ways, by obtaining different results in some cases and very similar in
others. These ways to obtain process characteristics are explained in the next sections called
Measurement A and MeasurementB.
3.3.1 Measurement A
The first method to get the parameters is based on the response of a system with a unit step
input, similar to the one shown in figure 4.
This is the typical output of industrial processes with a unit step input, and that can be usually
known as reaction curve. It gets near the response of a first order model with delay whose
transfer function is the one shown in expression 3.
243
Conceptual Model Development for a Knowledge Base of PID Controllers Tuning in Open Loop
6 Will-be-set-by-IN-TECH
Fig. 4. Measurement A
Fig. 5. Measurement B
G
(s)=
K
1 + T · s
e
−s·L
(3)
The parameters L and T come from drawing a straight line in the point of maximum slope of
the curve. L is found where the mentioned straight line cuts the axis of X and T comes from
prolonging the straight line up to the cut with the corresponding horizontal to 63.2% of the
value of the gain K of the system (steady state value with a unit step input), cutting point in
which is situated the sum of the L and T in its X coordinate.
3.3.2 Measurement B
In this case, there is the same response than in the last case, what occurs is that the
measurement is made for a different approximation. The graphic in which the measurement
is made is shown in figure 5.
As it can be observed what is done in this case is prolong the line with the greater slope up
to its cut with the Y axis, value which is defined as "a". And so a model with two parameters
244
Expert Systems for Human, Materials and Automation
Conceptual Model Development for a Knowledge Base of PID Controllers Tuning in Open Loop 7
is obtained, with one transfer function represented by an integrator with a pure delay. In this
case the system gets close to the transfer function according to the expression 4.
G
(s)=
a
L · s
e
−s·L
(4)
3.4 Parameters calculation through application of formulas
Once the characteristics of the response of the process have been measured and it is
acknowledged what specification wants to be optimized, the following is to apply formulas
developed to fulfil the description sought, bearing in mind the scopes of application for which
they were obtained. The application range for the case of empiric adjustment in an open loop
comes defined usually by the existing relationship between the time delay L, and the time of
increase T of the system with unit step input.
Different authors propose expressions, in function of the characteristics of the transient
response measured, for the achievement of the parameters of the regulator. It must be
highlighted that there are multiple expressions given, that work in an adequate form in
certain cases for which they were developed. It is frequent also that the manufacturers of
controllers deduce their own expressions that work satisfactory above all with the products
that they manufacture and especially for those applications to which they are destined. Is
must highlighted that there are no general equations that always work well, because of this it
will be necessary to select the expressions that best adjust in each specific case to the control
that is intended.
In this case study there are gathered those more known and usual ones Ziegler (1942) Kaya
(1988) Chien (1952) that are employed in the achievement of the parameters of the PID
regulators, even though the methodology followed can be used for any case. In table 1 the
different expressions are used in the present study are shown, together with the scope of
application in each case.
4. Design rules of PID regulators in open loop
In the first part of this section it is made a sweep at the different expressions of achievement
of parameters of the PID regulator previously mentioned, in which the systems are controlled
with this type of regulator, with the aim of obtaining some generic design rules, or in their
case particular rules for certain types of systems.
Due to the general character of the rules it will be necessary to employ for them significant
systems. In this aspect it has been opted to use a known source in this scope, which is the
Benchmark of systems to control PID developed by Åström and Hagglund Astrom (2000). In
this source a collection of systems is presented that: are usually employed in the testing of PID
controllers, these systems are based in countless sources of importance and also the immense
majority of the existing systems adapt to some of those included in this source.
4.1 Benchmark systems to which open loop empiric adjustment is not applicable
There are a set of systems included in the Benchmarking to which the empiric adjustment in
open loop is not applicable. If for instance there is a system whose transfer function is the
expression 5, which deals with a system of first order.
G
(s)=
1
s + 1
(5)
245
Conceptual Model Development for a Knowledge Base of PID Controllers Tuning in Open Loop
8 Will-be-set-by-IN-TECH
Method K
p
T
i
T
d
Application range
Ziegler-Nichols
1.2
a
2
·
L 0.5
·
L 0.1
≤
L
T
≤
1
Kaya-Scheib Set
point regulation
minimize IAE
0.95
K
T
L
1.04432
T
0.9895
+
0.09539
L
T
0.50814
·
T
L
T
1.08433
0
≤
L
T
≤
1
Kaya-Scheib Set
point regulation
minimize ISE
0.71959
K
T
L
1.03092
T
1.12666
−
0.18145
L
T
0.54568
·
T
L
T
0.86411
0
≤
L
T
≤
1
Kaya-Scheib Set
point regulation
minimize ITAE
1.12762
K
T
L
0.80368
T
0.99783
−
0.02860
L
T
0.42844
·
T
L
T
1.0081
0
≤
L
T
≤
1
Chien, Hrones
y Reswick load
disturbances (0%
overshoot)
0.95
a
2.4
·
L 0.42
·
L 0.11
≤
L
T
≤
1
Chien, Hrones
y Reswick load
disturbances (20%
overshoot)
1.2
a
2.0
·
L 0.42
·
L 0.11
≤
L
T
≤
1
Chien, Hrones y
Reswick Set point
regulation (0%
overshoot)
0.6
a
T 0.5
·
L 0.11
≤
L
T
≤
1
Chien, Hrones
y Reswick (20%
overshoot)
0.95
a
1.4
·
T 0.47
·
L 0.11
≤
L
T
≤
1
Table 1. Expressions of parameters of authors and scopes of application
Analyzing its output after introducing unit step, as can be seen in figure 6, the delay time L
is inexistent. This leads to two consequences: the first is that it would be out of range for all
the cases contemplated in the case study, and the second is that the parameters that would
depend on L in the expressions is zero.
If there is a system with a transfer function as the one in the expression 6, which is an unstable
system, when introducing a step type input, in no case it will not offer a limited exit and in
consequence there is no L and T to introduce in different expressions.
G
(s)=
1
s
2
−1
(6)
Another possibility within the contemplated functions in the Benchmark is the systems that
possess an integral action like the one in expression 7
G
(s)=
1
s
2
+ s
(7)
If a step input is introduced, the output has a form like the one indicated in figure 7. In it
clearly it can be appreciated, that the output tends to infinite (saturation in real systems), and
the time necessary raise time T cannot be obtained in the expressions to obtain the parameters,
and therefore it is not applicable.
246
Expert Systems for Human, Materials and Automation
Conceptual Model Development for a Knowledge Base of PID Controllers Tuning in Open Loop 9
Fig. 6. First order system step response
Fig. 7. System with integral action step response
4.2 Benchmark systems to which empiric adjustment in open loop is applicable
Apart from the types of systems that are found in some of the examples of the previous section,
the rest can be regulated by a controller PID applying the empiric adjustment in open loop to
obtain its parameters. If there is a transfer function like the one in expression 8, and an input
step is introduced, the response value of the system is the one of figure 8, the so called reaction
curve.
G
(s)=
1
(
s + 1
)
2
(8)
247
Conceptual Model Development for a Knowledge Base of PID Controllers Tuning in Open Loop
10 Will-be-set-by-IN-TECH
Fig. 8. Step response with typical reaction curve output
The features are set from the response of the process, in the graph of figure 8 obtaining in
this case a value of L
= 0.2817 and of T = 2.7183, what originates a relation L/T = 0.1036,
that according to the application ranges, all the groups of expressions are viable except Chien,
Hrones and Reswick expressions. Nevertheless analysis will be carried out in all the cases
contemplated.
4.3 Analysis of the methods applied to obtain the rules
Having obtained the reaction curve and in consequence the characteristics of the response of
the system, regulating it with the different expressions in the case study proceeds, extracting
significant specifications like: response time, peak time, overshoot and settle time.
All the tests will be carried out on all the systems proposed Åström in Benchmark in which
they are applicable, to check the results and be able to extract conclusions from which rules
will be obtained. If system of the expression 8 is regulated, the results obtained are illustrated
in figures 9 and 10.
5. PID controller conceptual modeling
The conceptual model of a domain consists in the strictest organization possible of knowledge
from the perspective of the human brain. In this sense for the domain that is being dealt with
in this case study, a general summarized model is proposed and shown in figure 11.
As can be observed it is divided in three blocks:
• Organization of the existing rules: In this block the aim is to organise the existing rules
of the types of expressions, scopes of application range, change criteria in the load
disturbance or follow up of the set point control criterion, etc.
• Organization of existing knowledge with new rules: This block is the meeting point
between the other two, and it aims to organise the existing knowledge in an adequate
way for which it will be necessary to create new rules.
248
Expert Systems for Human, Materials and Automation
Conceptual Model Development for a Knowledge Base of PID Controllers Tuning in Open Loop 11
Fig. 9. Response of the system regulated by the expressions of Ziegler-Nichols and
Kaya-Sheib for IAE, ISE and ITAE
Fig. 10. Response of the system regulated by the expressions of Chien, Hrones and Reswick
249
Conceptual Model Development for a Knowledge Base of PID Controllers Tuning in Open Loop
12 Will-be-set-by-IN-TECH
Fig. 11. General schema summarized from the conceptual model of empiric adjustment of
PID regulators in open loop
• Deduction of new rules to complete the knowledge model: In this part it has been detected
the necessity to deduce new rules to make a complete knowledge model, from the own
system and the desired specifications, to the final derivation of the parameters of the
controller in a reasoned way.
5.1 General diagram of knowledge in the open loop
In accordance with the steps deducted by the elaboration of the conceptual model, it is
obtained a general diagram of the knowledge for the adjustment of PID controllers in open
loop shown in figure 12.
Following the above a more detailed description of the knowledge schema is done, in different
figures with their corresponding explanation. It starts with the corresponding part in the top
right corner of the general diagram, detailed in figure 13.
In this part, the first thing to be done is to see if transfer function of the system is available.
Following in both cases it is checked whether if it is a first order system with delay or if it
were not the case it would not be possible to carry out the adjustment with this method. In
the positive case if the transfer function is not available it concludes in the rules rg.2. If it is
known the diagram of the left will be followed.
The corresponding part of the diagram of figure 14 is employed to discover if the system
is a first order with delay one. For this, in first place it has to be checked if it stabilizes at
a constant value with a unit step input and it is checked that there is no oscillation. If the
previous is fulfilled, the next step is to check if there is a system with pure delay. With both
affirmations it can be concluded that it is a system of this type, on the contrary it will not be.
After having checked that it is a first order with delay system, and also the transfer function is
known, the characteristics of the response L and T are found, and it is checked if the relation
L/T is found in the application range of the expression used in the case study (between 0
and 1) if it is not so, this method of design will not be applied. If the contrary applies, L/T
is checked to see if it is bigger than 0.1 and if positive it can be applied to all the expressions
contemplated. If it is inferior than 0.1 the question to ask the user is if he/she wishes to discard
250
Expert Systems for Human, Materials and Automation
Conceptual Model Development for a Knowledge Base of PID Controllers Tuning in Open Loop 13
Fig. 12. General diagram of knowledge for open loop empirical tuning of PID controllers
251
Conceptual Model Development for a Knowledge Base of PID Controllers Tuning in Open Loop
14 Will-be-set-by-IN-TECH
Fig. 13. Area 1 of the diagram
Fig. 14. Area 2 of the diagram
the expressions of Ziegler-Nichols and Chien, Hrones, Reswick for not being within its scope
of application range. If they are not used it will apply rule rg.3 and if they are used all methods
will be taken into account as if L/T were bigger than 0.1.
After the checks of the diagram of figure 15, the diagram of figure 16 folows, the first check is
to see if it adapts to the transfer function of the system being regulate adapts to some of the
related in the Benchmark. If it is not the case it will follow the diagram by the right-hand area
and it determines a group with general characteristics to which the function of relation L/T
belongs to, that will result with rule rg.2.
If the problem system adapts exactly to one of those mentioned in the Benchmark, the system
is determined and it chooses one of the three following possibilities is chosen:
• Follow a criterion of adjustment (load disturbance or set point control) and also a certain
specification will be optimized. And so for instance, if what wants to be done is regulate a
system before changes in the load in which the objective is to optimize the response time
then it will be necessary to follow rule rg.1.1.1.
252
Expert Systems for Human, Materials and Automation
Conceptual Model Development for a Knowledge Base of PID Controllers Tuning in Open Loop 15
Fig. 15. Zone 3 of the diagram
Fig. 16. Area 4 of the diagram
• If what is wanted is to optimize more than one specification simultaneously, rule rg.1.3 will
be followed.
• If what is wanted is to optimize an independent specification of the criteria of adjustment.
For instance, if what is wanted is to minimize the settling time whether it is for load
disturbance or set point control criteria, rule rg.1.2.2 will be followed.
5.2 Deduction of rules to complete in knowledge model
As has been commented in the general summarized schema of knowledge, it is necessary to
draw new rules to complete the knowledge model: In this part the need to do a model of
complete knowledge model has been detected, from the system itself and the specifications
253
Conceptual Model Development for a Knowledge Base of PID Controllers Tuning in Open Loop
16 Will-be-set-by-IN-TECH
Fig. 17. Systems of Benchmark ordered from lower to higher L/T value.
Fig. 18. Systems of Benchmark arranged from less to more value of response time for
expressions with load disturbance criterion.
desired, up to the final obtaining of the parameters of the controller. In this sense two
examples are shown in which the two possibilities of deduction of the rules are clarified.
5.2.1 Deduction of the rules RG1.1.1
It is pretended in this case to minimize the response time obtained, to regulate a system in
which it is favoured the criteria of load disturbance. For this in the first place, the systems of
the Benchmark are sorted lower to higher of the L/T relation, as is shown in figure 17.
Following we can see illustrated and sorted from lower to higher value of response time
obtained for the expressions of changes in the load (figure 18), indicating in the graph also
the expressions used in each case.
In the graph it is observed that in all cases except in three, the method of Ziegler-Nichols is
employed. But contrasting the graphs 17 and 18, those systems have L/T relation similar and
elevated, being all together in the end of the graph 17. And so, two rules can be established to
regulate a system for load disturbance criterion, in which the time response is improved:
•IfL/T
≥ 0.6763 will apply CHR 0% overshoot load disurbance.
•IfL/T
< 0.6763 will apply Ziegler&Nichols.
254
Expert Systems for Human, Materials and Automation
Conceptual Model Development for a Knowledge Base of PID Controllers Tuning in Open Loop 17
Fig. 19. Groups rg.2.1. for changes in the load
The system E1 obtain its best response time using Chien, Hrones Reswick for overshoot of
20%, but when CHR of 0% is employed a very small error is obtained and so the rules are
generalized.
5.2.2 Deduction of rules RG 2
This rule as can be observed in figures 13 and 16 is applied when the transfer function is not
known, also in cases where it is known but does not adapt to any of the contemplated systems
in the Benchmark. From it at the same time, a classification is going to be carried out, which
will become three new rules.
• Rule rg.2.1- Groups with methods for load disturbance.
• Rule rg.2.2- Groups with methods set point control.
• Rule rg.2.3- Groups with methods for both criteria.
To create the groups with general characteristics, in a similar way than the previous case, the
different systems are organised from less to more value with reference to L/T (figure 17).
In this case, it is done in a table, because the purpose is to have generic groups in all the
specifications. If for instance the case for rule rg 2.1 in which the systems are put together to
follow the load disturbance criterion is shown, then refer to figure 19.
In the table the values of the specification in each case have been indicated, alongside the
expressions for obtaining the parameters used to improve this specification. Next, a division
255
Conceptual Model Development for a Knowledge Base of PID Controllers Tuning in Open Loop