Biosensors for Health Environment and Biosecurity Part 14 pptx
Bạn đang xem bản rút gọn của tài liệu. Xem và tải ngay bản đầy đủ của tài liệu tại đây (1.91 MB, 35 trang )
Electrochemical Biosensors to Monitor Extracellular
Glutamate and Acetylcholine Concentration in Brain Tissue
447
and 0.99, respectively. The total voltage scale corresponds to a generated current of 20 nA
for Glu and 30 nA for Ach calibrations, corresponding to 50 nA/V. These results show that
biosensors are adequate for their use in vivo conditions.
Fig. 1. Calibration curves for Glu (A) and Ach (B).
With respect to the speed of neurotransmitters measurement with these biosensors, time
resolution was evaluated as the beginning of the response in each concentration until they
reached a maximum value, this time was approximately of 20 seconds.
3. Animal studies
These biosensors can be used under anesthesia or in awake animals, as shown here. For Glu,
biosensors were implanted into the cerebral cortex of rat pups (at three postnatal day) under
anesthesia, in a three electrodes arrangement working, reference and counter, in order to
accomplish an electrochemical cell in situ. Every biosensor must be calibrated before its use.
Once the animal is recovered from anesthesia, the terminal of each electrode is connected to
the potentiostat through a socket connector and after of an equilibration period to reach a
baseline, the animal is ready to monitor the Glu extracellular concentration into the brain in
any experimental condition. In the example showed here, the effect of subcutaneous
monosodium glutamate administration in neonate rast (5mg/Kg of body weigh) was
initially tested, resulting in a rise in extracelluar Glu concentration (Fig. 2A), this Glu
elevation lasted approximately 20 minutes.
In previous work it has been demonstrated that in immature brain the blood brain barrier is
not completely developed (Cernak, 2010) besides the high Glu concentration used is enough
to disrupt the barrier due to an osmotic effect, similar effect has been found with the use of
A
B
Biosensors for Health, Environment and Biosecurity
448
manitol (Rapoport, 2000). Additionally in our previous work, it was showed that similar
dose of monosodium glutamate can induce important rise in brain extracellular Glu
concentration tested by internal biosensor and HPLC methods (Lopez-Perez et al., 2010). In
order to induce seizures convulsion an additional systemic injection of 4-AP (3mg/kg of
body way) was used, whose effect can be seen in the right side of the fig. 2A. It can be
observed that after injecting the convulsant drug (50 min after starting recording) an
increase in the extracellular Glu concentration is present that could be related to the
intensity of seizure activity.
To test Ach biosensors, adult rats were used; they were also implanted with three electrodes,
with the only difference that the working electrode was covered with necessary enzymes to
determine Ach, and in this case the area of interest was the right thalamus. After a recovery
period from anesthesia that lasted at least two hours, the animal is connected in a similar
way as mentioned above to monitor extracellular Ach concentration during seizure activity,
characterized by strong motor alterations like tonic-clonic convulsions. In the example
showed here a baseline period of twenty minutes was recorded before testing the effect of 4-
AP administration at 5 mg/kg of body (intraperitoneally). After the convulsant drug
administration significant increments in Ach appeared that were also related with strong
seizure behavior activity, this effect lasted about one hour (Fig. 2B) and finally the animal
were euthanized with an intraperitoneal injection of pentobarbital. The examples showed
here represent independent animal trials for Glu and Ach, respectively.
Fig. 2. Glu biosensor (A) and Ach biosensor (B) register during altered brain activity in vivo.
Electrochemical Biosensors to Monitor Extracellular
Glutamate and Acetylcholine Concentration in Brain Tissue
449
To evaluate the specificity of these biosensors, several controls can be run; one example is to
test the response in vitro of these biosensors to other molecules that could produce a
nonspecific signal, like monoamines and ascorbic acid, since without a good preparation a
false positive result could appear. An example of such control for Ach biosensor is showed
in Fig. 3A, the first two arrows represent additions of 300 µM concentration of ascorbic acid
(Aa) and the two following of 80 µM Ach, they are represented by the next two arrows; it
can be seen that this biosensor response specifically to Ach. Other way to test the specificity
of a biosensor in vivo is to use one without enzymes in the cover; such naked or sentinel
biosensor will not be able to sense any neurotransmitter concentration during any
physiological conditions (Hascup et al., 2008) or calibration procedure. An example is
showed in Fig. 3B, were a naked biosensor was inserted in the brain of an adult animal, this
animal was treated with 4-AP, despite of the fact of appearance of strong seizure convulsion
no any increase of Ach was detected with this biosensor. Spikes in graph B represent
movement artifacts during convulsions. Similar analyses were done for Glu biosensors.
Fig. 3. Specificity test for Ach biosensor in vitro (A) and test of a naked or “sentinel”
biosensor in vivo (B)
4. Conclusions
The use of electrochemical biosensors to monitor neurotransmitters concentration during
normal or pathological activity in brain is an alternative approach that is gaining new users,
Biosensors for Health, Environment and Biosecurity
450
besides, different strategies to fix enzymes over several substrates are merging, like the use
of sol gel derivates or other casting materials (Sakai-Kato & Ishikura, 2009; Hyun-Jung et al.,
2010). This is a very important issue; this is trying to get biosensors that last active for more
prolonged periods, which could overcome the necessity to monitor the neurotransmitter
concentration for prolonged time or improving the way of fixing the necessary enzymes
with more molecular movements that could allow such enzymes have more activity, since in
general a fixed enzyme protein decreases its activity. Recent advances in the use of gold
nanoparticles due to their increased surface area to enhance interactions with biological
molecules, geometric and physical properties make them another alternative to prepare
biosensors (Yang et al., 2009). With the procedure used here to monitor Glu and Ach it is
shown that it is possible to evaluate the role of these fast neurotransmitters during seizure
activity, since the increased release of these compounds have been related with the presence
of a convulsive state, these neurotransmitter alterations have been determined with other
methods, like microdialysis coupled to HPLC and pharmacological studies (Morales-
Villagrán & Tapia 1996; Morales-Villagrán, et al., 1996), data that match well with the results
showed here, although the main difference is that using biosensors for monitoring the brain
the procedure can be done during a real time and with improved resolution. This work was
supported by CONACyT project # 105 807.
5. References
Bliss T. & Collingridge G. 1993. A synaptic model of memory: long-term potentiation in the
hippocampus. Nature. Vol. 361, No. 64D7, (January 1993), pp. 31-39, ISSN 0028-
0836.
Carlsson M. & Carlsson A. 1990. Schizophrenia: a subcortical neurotransmitter imbalance
syndrome? Schizophrenia Bulletin Vol. 16, No. 3, (September 1990), pp. 425-432,
ISSN 0586-7614
Cernak I., Chang T., Ahmed F., Cruz M., Vink R., Stoica B., & Faden A. 2010.
Pathophysiological response to experimental diffuse brain trauma differs as a
function of developmental age. Development Neuroscience, Vol. 32, No. 5-6, (October
2010) pp. 442-53, ISSN 0378-5866.
Cruickshank J., Brudzynski S., & McLachlan R. 1994. Involvement of M1 muscarinic
receptors in the initiation of cholinergically induced epileptic seizures in the rat
brain. Brain Research, Vol. 643, No. 1-2 (April 1994), pp. 125-129, ISSN 0006-
8993.
Dávalos A., Shuaib A. & Wahlgren N. 2000. Neurotransmitters and pathophysiology of
stroke: evidence for the release of glutamate and other transmitters/mediators in
animals and humans. Journal of Stroke and Cerebrovascular Disease, Vol. 9, No. 6,
(November 2000), pp. 2-8, ISSN 1532-8511.
Fonnum F. 1984. Glutamate: a neurotransmitter in mammalian brain. Journal of
Neurochemistry, Vol. 42, No. 1, (January 1994), pp 1-11, ISSN 0022-3042.
Hascup N., Hascup E., Pomerleau F., Huettl P. & Gerhardt G. 2008. Second-by-second
measures of L-Glutamate in the prefrontal cortex and striatum of freely moving
mice. The Journal of Pharmacology and Experimental Therapeutics, Vol. 324, No. 2,
(February 2008), pp. 725-731, ISSN 1521-0103.
Electrochemical Biosensors to Monitor Extracellular
Glutamate and Acetylcholine Concentration in Brain Tissue
451
Hu Y., Mitchell K., Albahadily F., Michaelis E. & Wilson G. 1994. Direct measurement of
glutamate release in the brain using a dual enzyme-based electrochemical sensor.
Brain Research, Vol. 659, No. 1-2, (October 1994), pp. 117-125, ISSN 0006-8993.
Kim H., Kim A. & Jeon S. 2010. Immobilization on chitosan of a thermophilic trehalose
synthase from thermos thermophilus HJ6. Journal of Microbiology and Biotechnology,
Vol. 20, No. 3, (March 2010), pp. 513-517, ISSN 1017-7825.
Klockgether T. & Turski L. 1993. Toward an understanding of the role of glutamate in
experimental Parkinsonism: agonist-sensitive sites in the basal ganglia. Annals of
Neurology, Vol. 34, No. 4, (October 1993), pp. 585-593, ISSN 0364-5134.
López-Pérez S., Ureña-Guerrero M. & Morales-Villagrán A. 2010. Monosodium glutamate
neonatal treatment as a seizure and excitotoxic model. Brain Research, Vol. 1317,
(March 2010), pp. 246-256, ISSN 1872-6240.
Morales-Villagrán A. & Tapia R. 1996. Preferential stimulation of glutamate release by 4-
Aminopyridine in rat striatum in vivo. Neurochemistry International, Vol. 28, No. 1,
(January 1996), pp. 35-40, ISSN 0197-0186.
Morales-Villagrán A., Ureña-Guerrero M. & Tapia R. 1996. Protection by NMDA receptor
antagonist against seizure induced by intracerebral administration of 4-
aminopyridine. European Journal of Pharmacology, Vol. 305, No. 1-3, (June 1996), pp.
87-93, ISSN 0014-2999.
Morales-Villagrán A., Sandoval-Salazar C. & Medina-Ceja L. 2008a. An analytical flow
injection system to measure glutamate in microdialysis samples based on an
enzymatic reaction and electrochemical detection. Neurochemical Research, Vol. 33,
No. 8, (August 2008), pp. 1592-1598, ISSN 1573-6903.
Morales-Villagrán A., Medina-Ceja L. & López-Pérez S. 2008b. Simultaneous glutamate and
EEG activity measurements during seizures in rat hippocampal region with the use
of an electrochemical biosensor. Journal of Neuroscience Methods, Vol. 168, No. 1,
(February 2008), pp. 48-53, ISSN 0165-0270.
Nakanishi S. 1992. Molecular diversity of glutamate receptors and implications for
brain function. Science, Vol. 258, No. 5082, (October 1992), pp. 597-603, ISSN 0036-
8075.
Rapoport S. 2000. Osmotic opening of the blood-brain barrier: principles, mechanism, and
therapeutic applications. Cellular and Molecular Neurobiology, Vol. 20, No. 2, (April
2000), pp. 217-30, ISSN 0272-4340.
Sakai-Kato S and Ishikura K. 2009. Integration of biomolecules into analytical systems by
means of silical sol-gel technology. Analytical Science, Vol. 25, No. 8, (August 2009),
pp.969-978, ISSN 1348-2246.
Turski L., Ikonomidou C., Turski W., Bortolotto Z- & Cavalheiro E. 1989. Review:
cholinergic mechanisms and epileptogenesis. The seizures induced by pilocarpine:
a novel experimental model of intractable epilepsy. Synapse, Vol. 3, No. 2, (January
1989), pp. 154-171, ISSN 0887-4476.
Van der Zee E. & Luiten P. 1999. Muscarinic acetylcholine receptors in the hippocampus,
neocortex and amygdala: a review of immunocytochemical localization in relation
to learning and memory: Progress in Neurobiology, Vol. 58, No. 5, (August 1999), pp.
409-471, ISSN 0301-0082.
Biosensors for Health, Environment and Biosecurity
452
Yang M., Kostov Y., Bruck H. & Rassooly A. 2009. Gold nanoparticle-base enhanced
chemiluminescence immunosensor for detection of staphylococcal enterotoxin B
(SEB) in food. International Journal of Food Microbiology, Vol. 133, No. 3, (August
2009), pp. 265-271, ISSN 1879-3460.
21
Surface Plasmon Resonance Biotechnology for
Antimicrobial Susceptibility Test
How-foo Chen
1
, Chi-Hung Lin
2,3,4
, Chun-Yao Su
1
,
Hsin-Pai Chen
5
and Ya-Ling Chiang
1
1
Institute of Biophotonics, National Yang Ming University, Taipei
2
Institute of Microbiology & Immunology, National Yang Ming University, Taipei
3
Taipei City Hospital
4
Department of Surgery, Veteran General Hospital, Taipei
5
Department of Medicine, National Yang-Ming University Hospital,
Yilan, Taiwan and
School of Medicine, National Yang-Ming University
Taiwan
1. Introduction
Infectious diseases are a leading cause of morbidity and mortality in hospitalized patients.
This fact has placed a tremendous burden on the clinical microbiology laboratory to rapidly
diagnose the agent responsible for patient’s infection and to effectively provide therapeutic
guidance for eradication of the microorganisms. Laboratories are expected to perform these
tasks in a cost-effective and efficient manner. Two common methodologies for antimicrobial
susceptibility testing in a clinical laboratory are Kirby-Bauer disk diffusion and variations of
broth microdilution. The principle is based on the detection of bacterium reproduction
ability under the influence of antibiotics. Therefore the testing time is determined by the
doubling time of tested bacteria. These methods then usually take from one day to weeks to
complete the examination. The long incubation period is inevitable for these conventional
methods. Such a waiting period is not short for clinical doctors who urgently need the
information to adjust the therapeutic strategy. Therefore it is important to explore new
template and technology to perform an antimicrobial susceptibility test.
Surface plasmon resonance biosensing technique is well known for its characteristics of
label-free, ultra-sensitive, and real-time detection capability. Thus this technique is
considered as the candidate of the new platform. Surface plasmon polaritons (SPPs) was
first theoretically predicted by Ritchie in 1957 (Ritchie,1957) based on the analysis of surface
electromagnetic modes. The SPPs in general can be generated by electrons (Powell & Swan,
1959) or by light (Otto, 1968) under a proper excitation condition. For SPPs excited by light,
in general, the dispersion characteristic of SPPs does not allow the energy of a propagation
wave coupled into this surface mode: The spatial phase of a propagation wave is always
smaller than that of the surface mode with the same optical frequency on a dielectric-metal
interface. Thus an evanescence wave generated by a p-polarized light beam through a prism
is suggested to obtain an extra spatial phase and then excite SPPs on the other surface of the
metal layer. An alternative method to provide the additional spatial phase is through the aid
Biosensors for Health, Environment and Biosecurity
454
of a grating, of which the sub-wavelength periodic structure can provide additional spatial
phase. For the past two decades, SPPs excited by light has been widely applied to the study
of biomaterial processes, which include biosensors, immunodiagnostics, and kinetic analysis
of antibody-antigen interaction (Davies, 1996; Rich & Myszka, 2005). The main application
of SPR biosensors on biomedical science is to analyze the binding dynamics between specific
antibody and antigen (Davies, 1996; Rich & Myszka, 2005; Safsten et al., 2006; Misono &
Kumar, 2005). Since the mode characteristics of SPPs depend on the refractive index of the
material within the dielectric-metal interface of about one hundred nanometers, the
refractive index of the material determines the resonance incident angle of light, the
coupling efficiency, the coupling wavelength, and the optical phase of the reflected light. All
the physical quantities can be measured by the reflected light, which is the uncoupled part
of the incident light. Therefore, a SPR system does not require fluorescence labeling and
provides real-time information with very high sensitivity (Chien & Chen, 2004). This also
guarantees a very small amount of sample needed for the detection of the refractive index
change through a SPR method.
Most of the biomedical applications of SPR focus on detection and identification of
biomolecules. Extended applications have been applied to the detection and sorting of cells
or bacteria based on the same principle (Takemoto et al., 1996). The capture of the desired
biomolecules with or without cells or bacteria attached is achieved through antibodies or
aptamers pre-coated on the metal thin film, where the SPR occurs. The enormous
applications of SPR on biomedical science using antibody-antigen affinity can be found in
Rebecca L. Rich and David G. Myszka’s Survay (Rich & Myszka, 2005). For the methods
using antibody-antigen binding, specific antibody is required and finding the specific
antibody is usually not straight forward. This is the reason that characterization of antibody
is still the main reports from utilization of SPPs. This is also an important reason that a
method utilizing antibody-antigen interaction is difficult to use for antimicrobial
susceptibility test. Different from the studies mentioned above, the method introduced in
this chapter does not require pre-coating of specific antibodies. This method is then more
versatile and can be used to detect reactions of drugs appearing on cell membranes or cell
walls. While current antimicrobial susceptible testing methods take one day or more for a
clinical laboratory to report the testing results (Poupard et al., 1994; Levinson & Jawetz,
1989), utilizing surface plasmon resonance significantly reduces the time duration to less
than or about one hour of antibiotics treatment based on our experimental study. Antibiotics
which modify or damage the cell walls of bacteria, thus, alternate the refractive index of
bacterium surfaces.
Differentiation of susceptible strains of bacteria from resistant ones by using surface
plasmon resonance (SPR) technique is discussed in this chapter. This technique detects the
refractive index change of tested bacteria subject to antibiotics treatment in real time. Instead
of detection the antimicrobial susceptibility through the cell doubling time, the SPR
biosensor technology is used to detect the biochemical change of tested bacteria. A much
shorter time to obtain the test result is achieved. Because of the feasibility of this
antimicrobial test method using surface plasmon resonance biosensors, development of new
biosensors is also very important.
Escherichia coli JM109 resistant/susceptible to ampicillin and Staphylococcus epidermidis
resistant/susceptible to tetracycline were chosen for the antimicrobial susceptibility test in
this study. Since the surface plasmon resonance is highly sensitive to the change of the
Surface Plasmon Resonance Biotechnology for Antimicrobial Susceptibility Test
455
refractive index of cells near the cell-metal interface, ampicillin as the antibiotic inhibiting
the synthesis of cell walls was used for the examination of Escherichia coli JM109. This is
designed for the measurement of direct effect of antibiotics on cells. Different from
ampicillin, tetracycline works as an inhibitor of protein synthesis. The influence of
tetracycline on cell walls and cell membranes is then indirect. Therefore, Staphylococcus
epidermidis used as another type of bacteria susceptible/resistant to tetracycline was used for
the measurement of indirect effect of antibiotics on cells.
2. Devices and methods
The detection principle can be realized on the detection of biochemical change of bacteria
subject to antibiotics through the detection of their refractive index. This change on the
refractive index of bacteria is achieved by an SPR biosensor. A chemical treatment of Poly-L-
Lysine on the surface of the Au thin film in the SPR biosensor is used to trap bacteria. The
Poly-L-Lysine layer does not provide specfic binding to select specific bacterium strain so
that a pre-purification to select tested bacteria is required for the test. After the tested
bacterium strain is trapped on the Poly-L-Lysine layer, antibiotic is appled to examine the
antimicroial susceptibility.
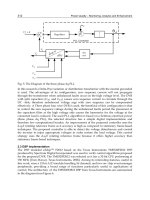
2.1 Surface plasmon resonance biosensor
The experimental setup for the examination of drug resistance of the bacteria is shown in
Fig. 1(a). The setup is the combination of the two parts: one is for the excitation of the
surface plasmon and the other is the flow cell chamber. For the excitation of the surface
plasmon, a Helium-Neon laser is used as the light source to provide the laser beam with
wavelength 632.8 nm. Since surface plasmon can only be excited by p-polarized light, a
polarized beam splitter is used to separate the p-polarized and s-polarized light. The s-
polarized light is used as the normalization factor to eliminate the deterioration of
measurement accuracy caused by the laser instability. After the polarized beam splitter, the
p-polarized light is injected onto the Au thin film through a prism to generate surface
plasmon. The required phase matching condition to excite the surface plasmon is provided
by the proper incident angle and the prism, which provides an extra spatial phase along the
gold film surface through its refractive index of the prism. Matching oil is applied between
the prism and the glass substrate coated with the Au thin film to avoid occurrence of
multiple reflection between the prism and the glass slide. The excitation efficiency of the
surface plasmon by the p-polarized laser beam is measured through the silicon
photodetector which receives the reflected p-polarized beam from the Au thin layer. When
the surface plasmon resonance angle is reached, the energy of injected laser beam was
transformed into the surface plasmon polaritons. Thus, the laser beam reflected from the Au
layer reaches minimum. The photocurrent generated from the photodetector is amplified
and transformed into a voltage signal via 16-bit A/D converter(Adventech PCI-1716).
The intensity, normalized to the intensity of the s-polarized beam, of the reflected p-
polarized beam as a function of the incident angle is obtained by the computer. Incident
angle was controlled by a motorized rotation stage through a controller. The other arm that
is for receiving reflection was controlled accordingly by another rotation stage to measure
the power of the reflected beam. The resolution of the system on the change of refractive
index of the dielectrics is
4
1.4 10
refractive index unit (RIU), which corresponds to the
value of the SPR angle shift as 0.00867 degree.
Biosensors for Health, Environment and Biosecurity
456
(a)
(b)
Fig. 1. SPR biosensor used for the experiment. (a) The configuration of SPR biosensor used
in the study. The SPPs was excited by 632.8nm He-Ne laser. A polarizer is used to enhance
the extinction of the laser beam polarization. A polarized bean splitter (BS) direct the s-
polzaried light into a detector for normalization of laser intensity fluctuation. The p-
polarized light is used to excite SPPs. The reflectance of the light is direct to the second
detector for measurement of resonance angle, and thus measure the refractive index change
of bacteria subject to antibiotics; (b) Picture of the home-made SPR biosensor. The solid red
line indicates the laser beam.
Surface Plasmon Resonance Biotechnology for Antimicrobial Susceptibility Test
457
2.2 Cell chamber
A flow cell chamber was constructed on the SPR system described above to provide the
bacteria for testing, DI water for washing, and the antibiotics for the examination of drug
resistance. An O-ring is attached to the chamber to prevent the liquid leakage. A thermister
of 10KΩ is used to monitor the temperature of the chamber and a TE cooler is used to
control the temperature by receiving the temperature information from the thermister. The
temperature of the cell chamber was controlled with the fluctuation less than 0.1
o
C, which
is achieved by a temperature controller usually used for controlling the temperature of laser
diodes. As is depicted in Fig 2, the target bacteria are first injected into the chamber through
the flow channel and attach on the gold film by the adhesion of the Poly-L-lysine.
Antibiotics are then added to test if the cell walls or membranes are affected.
2.3 Bacterium adhesive coating
Poly-L-Lysine has been demonstrated as an effective tissue adhesive for use in various
biochemistry procedures. Poly-L-Lysine solution is diluted with deionized water prior to the
coating procedure. The flat glass deposited with Au thin film was immersed in poly-L-lysine
solution (concentration = 200 ug/ml) for from a couple of hours to 24 hours to interact with
Au thin film as the preparation of the biochips. Different time intervals provide different
adhesion of Poly-L-Lysine to the bacteria and antibiotics. After incubation, cells can be
immobilized on the Au-coated glass.
Gold film
O-ring
Flow in Flow out
Bacteria
Poly-L-lysine
Fig. 2. Schematic illustration of the SPR device and the mechanisms of the experiment
2.4 Bacterium preparation
Preparation of Escherichia coli resistant to ampicillin Penicillin is called β-lactam drugs. An
intact ting structure of β-lactam ring is essential for antibacterial activity; cleavage of the
ring by penicillinases (β-lactamase)inactivates the drug (Levinson & Jawetz, 1989;
laser
detecto
Biosensors for Health, Environment and Biosecurity
458
Macheboeuf et al., 2006). The antibiotics bacteria strain, E. Coli JM109, we use was generated
by transform of ampicillin resistant plasmids to translate β-lactamase to cleave the ring of
ampicillin. The E. Coli strain was picked out by loop and planted in 5ml LB broth over night.
Preparation of S. epidermidis resistant to tetracycline The S. epidermidis were picked out by loop
and were planted in 5ml LB broth over night (20 hours) and then transferred into 100ml LB
broth (5 hours) for further experiment.
2.5 Scanning Electron Microscope (SEM) imaging
The glass slide with Au thin film and bacteria was placed in critical point drying (CPD)
machine (Samdri-PVT) and filled with Ethanol of 100%. After that liquid CO
2
was used to
replace the ethanol. The Au thin film with bacteria can then be detached from the glass slide
for SEM imaging. Before taking the images, the sample was coated with Au for better
conductivity. A scanning electron microscope JEOL JSM-5300 is used for the SEM images.
3. Antimicrobial susceptibility test
To test the drug resistance of bacteria using the SPR system, as depicted in Fig. 3, sterilized
DI water was first injected into the flow cell chamber for 30 minutes to stabilize the system
after the biochip coated with poly-L-lysine was assembled. Following the stabilization
procedure, the incubated LA broth was injected into the cell chamber for the bacteria to
cover the Au metal film. Another washing procedure is applied to remove the bacteria that
are not bound to the poly-L-lysine coating. After that an antibiotic solution was injected. The
angle of surface plasmon resonance through the entire procedure was recorded as a function
of time.
Laser
DI water
Photodiode
Laser
bacteria
antibiotics
Laser
Photodiode
Fig. 3. Illustration of the experimental procedure. The first step is to stablize the system and
make sure that the system is operated under a constant temperature; the second spet is to
inject the bacteria into the cell chmaber for bacterium attachment. After the bacteria are
attached on the Au thin film, a LA broth is injected into the chamber for washing out the
unbound bacteria. The third step is to inject the antibiotics.
Surface Plasmon Resonance Biotechnology for Antimicrobial Susceptibility Test
459
Antibiotics are classified into several categories depending on its mechanisms on the
interruption of cell activities, namely cell wall synthesis, cell membrane synthesis, protein
synthesis, folic acid biosynthesis, DNA gyrase, and RNA polymerase.
3.1 Gram negative bacterium – E-Coli
3.1.1 Injection with LB
Since surface plasmon resonance is very sensitive to the refractive index change of the cells
attached on the thin gold film, ampicillin as the antibiotics interrupting cell wall synthesis is
chosen in this experiment. The mechanism of ampicillin is depicted in Fig. 4. As is shown in
Fig. 4(a), the cell wall and membrane of E. Coli consist of outer lipid bilayer and inner
plasma membranes. Between the two bilayers, the peptide (peptidoglycan) and cross-link
(peptide-bond) form a rigid layer to constitute cell walls. As is shown in Fig. 4(b), the
generation of cross-link is achieved by the assistance of transpeptidase. The mechanism of
ampicillin is to interrupt the activity of transpeptidase and then to interfere cell growth and
proliferation [6], shown in Fig. 4(c). When the susceptible strain of E. Coli JM109 is subject to
the action of ampicillin, the cell walls are modified by the antibiotics. This modification
changes the resonance condition of surface plasmon. The change of the resonance condition
is revealed on the detector through angular interrogation.
1
3
4
2
1
3
4
2
1
3
4
2
1
3
4
2
1
3
4
2
1
3
4
2
Glycan chain
Peptide
Cross linking
NH
2
peptide
bond
1
3
4
2
5
1
3
4
2
5
1
3
4
2
1
3
4
2
5
penicillin
Cross link blocked
Cross link formed
transpeptidase
penicillin
Fig. 4. (a) Cell wall structure; (b) Ampicillin mechanism
(a)
(b)
Biosensors for Health, Environment and Biosecurity
460
The SPR angle of antibiotic resistant strain of E. Coli JM109 over the operation procedures
described above is shown in Fig. 5(a) and that of antibiotic susceptible strain is shown in Fig.
5(b). The shift of the SPR angle has been referred to the value of the SPR angle before the E.
Coli was injected into the cell chamber. As shown in Fig. 5(a), the SPR angle increases when
the bacteria are injected into the cell chamber. After the amount of the bacteria attached to
the Au thin film coated with poly-L-lysine is saturated, DI water is injected to remove the
unbounded bacteria. The SPR angle drops dramatically during this procedure. After that the
3 ug/ml ampicillin is injected to the cell chamber. The value of SPR angle, changed by the
refractive index of the bacteria, is recorded over time. The same procedure is applied on the
susceptible strain and the result is shown in Fig. 5(b). The result shows that, after 30 minutes
treatment of ampicillin, the decrease of the SPR angle for the resistant and the susceptible
strains is -0.00154 and -0.01608 in respective. The angle shift is about ten times difference
between the resistant strains and the susceptible strains. It indicates that the ampicillin
causes the structure of bacteria cell walls loose or even breakdown and thus decreases the
refractive index of the cell wall of the susceptible E. Coli. Since the antibiotic resistant strain
is more resistant to ampicillin, the refractive index of its cell wall does not decrease as much
as the susceptible one’s does.
Fig. 5. Kinetic plot of SPR angle shift. The bacteria was treated by ampicillin for 30 minutes:
(a) Amplicillin resistant case; (b) Ampicillin susceptible case (Chiang et al., 2009).
This difference of the resonance angle shift can be more pronounced when the concentration
of the ampicillin increases to 100ug/ml. As was shown in Fig. 6, the angle shift of the
ampicillin-resistant strain of E. Coli was almost a constant during the treatment of
antibiotics. However, the angle shift of the susceptible strain increased significantly over
time. This demonstrates that the angle shift in the case of susceptible strain is indeed caused
by the treatment of antibiotics.
The damage degree of the ampicillin, with concentration of 3 ug/ml, on the cell walls of the
antibiotic susceptible strain is examined by SEM. The E. Coli before the treatment of the
ampicillin is shown in Fig. 7(a). The antibiotic resistant and susceptible E. Coli after the
antibiotic treatment are shown in Fig. 7(b) and 7(c) in respective. The comparison of the SEM
pictures reveals that no significant change on the appearances of the resistant strains and the
susceptible strains is observed. It can be concluded that the SPR detection method is more
sensitive than SEM scanning; the change detected by the SPR sensor is not shown in the
SEM pictures. After 5 hours treatment of ampicillin, the susceptible strains shrank, which
was verified by SEM.
Surface Plasmon Resonance Biotechnology for Antimicrobial Susceptibility Test
461
Fig. 6. Kinetic plot of SPR angle shift. The bacteria were treated with ampicillin of 100ug/ml
for 300 minutes: (a) Amplicillin resistant case; (b) Ampicillin susceptible case
Fig. 7. SEM scanning pictures: (a) E-coli without antibiotic treating, (b) ampicillin resistant
strains after 30 minutes treatment of antibiotics, (c) ampicillin susceptible strains after 30
minutes treatment of antibiotics. (Chiang et al., 2009)
Biosensors for Health, Environment and Biosecurity
462
In order to examine the reproducibility of the result, totally ten sets of resistant and
susceptible strains of E. Coli JM109 were examined and the result was listed in Fig. 8. It
shows that the detection of the susceptible strains is 100% correct within the limited
examination number and that of the resistant strains is 90%. The incorrect set could be
caused by the fall off of the gold film since gold has bad adhesion on glasses. Further
verification is conducted on this issue. The angle shift difference between the resistant
strains and the susceptible strains is ranged from two times to more than ten times. The
variation of the result could due to the different degree of the drug resistance of the bacteria,
the different distance between the prism and the Au-coated glass, and the coverage
efficiency of bacteria on the surface of the thin gold film from time to time. Nevertheless an
acute criterion can be set to separate these strains through the SPR scanning method
proposed here.
Fig. 8. Result of ten sets of resistant and susceptible strains of E. Coli subject to 3 ug/ml
ampicillin. Solid circle indicates the average value of the angle shift in the case of resistant
strain; Solid triangle indicates the average value of the angle shift in the case of susceptible
strain. (Chiang et al., 2009)
3.1.2 Injection with DI water
In order to increase the accuracy of the antimicrobial susceptibility test. The coating time of
Poly-L-Lysine was optimized from 24 hours to a few hours. Meanwhile, the LB injected with
bacteria and for removing the unbound bacteria was replaced by DI water for reducing the
interference of LB. After the adjustment, the amount of unbound or unstably bound bacteria
was reduced significantly. As was shown in Fig. 9, the rinse procedure of DI water did not
decrease the SPR angle from the saturation phase of bacterium adhesion as much as the
situation in the injection with LB protocol. The ampicillin of 50ug/ml was applied from the
time points indicated by the arrows. As shown in Fig. 9 (a), the resistant strain of E. Coli
showed a positive angle shift right after the starting point of the ampicillin treatment and
Surface Plasmon Resonance Biotechnology for Antimicrobial Susceptibility Test
463
stay almost unchanged. The sudden increase on the angle shift is the result of adding
ampicillin.
Fig. 9. Kinetic plot of SPR angle shift. The bacteria E. Coli were treated with ampicillin of
50ug/ml for 100 minutes: (a) Amplicillin resistant case; (b) Ampicillin susceptible case. The
arrows indicate the time to start the treatment of ampicillin.
The result has demonstrated that the improved method has better accuracy in comparison
with the method mentioned in the section 3.1.1. The same method using ampicillin of
different concentrations, listed as 25 ug/ml, 50 ug/ml, and 100ug/ml, was also performed
and the result was shown in Fig. 10. The resistant strain and susceptible strain of E. Coli
were tested and ampicillin-only with bacteria was used as the control group. The tested
groups subject to ampicillin of 25 ug/ml was marked by green solid circles; The tested
groups subject to ampicillin of 50 ug/ml was indicated by red solid circles; The tested group
subject to ampicillin of 100 ug/ml was indicated by blue solid circles. It revealed that the
resonance angle in the resistant strain group increased because of the higher refractive index
of ampicillin in comparison with that of DI water. Although the ampicillin can slightly
increase the resonance angle, the resonance angle in the susceptible strain group still
decreased due to the loss of cell walls, which has larger effect than that from higher
refractive index of the ampicillin. This result showed that this method is suitable for the
ampicillin with concentration ranged from 25 ug/ml to 100 ug/ml. We did not test
ampicillin with the concentration above 100 ug/ml. For ampicillin with concentration lower
than 25 ug/ml, the result became not trustable at this moment. Further study is required to
push the lower limit.
3.2 Gram positive bacterium – Enterococcus
The protocol of DI water injection can also be used for gram positive bacteria. This tested
object is Enterococcus. Similar result was obtained in the test, which was shown in Fig. 11.
Following the same protocol, the resonance angle of SPP excitation first increased due to the
higher refractive index of ampicillin in comparison with that of DI water. After the injection
of the ampicillin, the angle shift of the resistant strain remained positive. However, angle
shift of the susceptible strain gradually decreased to negative. The result of angle shift
clearly distinguished the resistant strain from the susceptible strain.
Biosensors for Health, Environment and Biosecurity
464
Fig. 10. Result of resistant and susceptible strains of E. Coli subject to ampicillin of different
concentrations. Solid blue circle indicates the value of the angle shift in the case of 100
ug/ml for resistant strain, susceptible strain, and control group; Solid red circle indicates the
value of the angle shift in the case of 50 ug/ml for resistant strain, susceptible strain, and
control group; Solid green circle indicates the value of the angle shift in the case of 25 ug/ml
for resistant strain, susceptible strain, and control group.
Surface Plasmon Resonance Biotechnology for Antimicrobial Susceptibility Test
465
3.3 Different antibiotics - tetracycline
An interesting question has arisen if the same method can be used to detection antimicrobial
susceptibility by antibiotic with different mechanism. For this purpose and also served as a
blind test, another bacterium, Staphylococcus Epidermidis, is used. Tetracycline is used as the
antibiotics in this test. Different from the mechanism of ampicillin, the tetracycline is a 30S
inhibitor, which blocks the binding of aminoacyl-tRNA to A-site of ribosomes and then
inhibits the protein synthesis (Malacinski & Freifelder, 1998). It is important to emphasize
that the surface plasma wave penetrates the contacting bacteria surface of about 100
nanometers, it is only sensitive to the change of the refraction index within this depth. For
the antibiotics that interrupt the synthesis of protein, SPR biosensing technique may not be
able to detect any change of bacteria subject to the treatment of tetracycline since the
influence of tetracycline passed to the surface of the cells is then indirect. The change of the
SPR angle of the two unknown strains is shown in Fig. 12(a) and 12(b). As shown in Fig. 12,
the change of the SPR angle for one of the strains is irregular after the treatment of the 10
ug/ml tetracycline and that of the other strain showed slightly monotonic decrease over
time. Based on the curves shown in Fig. 12, it is judged that the strain tested in Fig. 12(b) is
the susceptible strain and the other is the resistant strain. The result is consistent with the
antimicrobials property of the strains. This showed that this method can also be used to
detect antimicrobial susceptibility of microorganisms subject to antibiotics with mechanisms
other than working on cell walls.
Fig. 11. Kinetic plot of SPR angle shift. The bacteria Enterococcus were treated with ampicillin
of 50 ug/ml for 100 minutes: (a) Amplicillin resistant case; (b) Ampicillin susceptible case.
The arrows indicate the time to start the treatment of ampicillin.
Biosensors for Health, Environment and Biosecurity
466
It is import to mention that the serum is not supplied into the system, the growth rate of E.
Coli should not be a limited factor to generalize the potential of this method to other bacteria
with longer growth time. An observation of bacteria on microscope has confirmed this
point.
3. Conclusion
We have reported two innovative antimicrobial susceptible testing methods utilizing surface
plasmon resonance. One is injection with LB liquid. The other is injection with DI water. In
the study, the drug resistance of the gram negative bacteria, Escherichia coli JM109, and that
of gram positive bacteria, Enterococcus, can be detected through the methods. This method is
not limited to the antibiotics with mechanism working on the cell walls. It can be used to
perform the test when antibiotics works on protein synthesis. The drug resistant of the S.
epidermidis were successfully detected. Although the principle of the SPR testing method is
based on the refractive index change of the cell-metal interface of about 100 nanometers, the
resistance of the S. epidermidis to the tetracycline, which disturbs the protein synthesis, is still
detectable by this method. This method can differentiate susceptible strain from resistant
strain in a few hours and has a potential to further reduce the testing time to less than one
hour if the cell adhesion time to the Au thin layer can be reduced. This method largely
decreases the cost of time waste on examination and increase the chance for patient to
survive.
Fig. 12. Kinetic plot of SPR angle shift. The bacteria E. Coli were treated with ampicillin of 50
ug/ml for 100 minutes: (a) Amplicillin resistant case; (b) Ampicillin susceptible case. The
arrows indicate the time to start the treatment of ampicillin. (Chiang et al., 2009)
Surface Plasmon Resonance Biotechnology for Antimicrobial Susceptibility Test
467
4. Acknowledgment
This work was supported by research grant NSC 97-2627-M-010-005- and NSC 99-2112-
M-010-001-MY3 from National Science Council in Taiwan and by “A grant from
Ministry of Education, Aim for the Top University Plan” from National Yang Ming
University.
5. References
Ritchie, R. H. (1957). Plasma Losses by Fast Electrons in Thin Films. Physical Review, Vol.106,
No.5, (June 1957), pp. 874-881
Powell, C. J. & Swan, J. B. (1959). Origin of the Characteristic Electron Energy Losses in
Aluminum. Physical Review, Vol.115, No.4, (August 1959), pp. 869-875
Otto, A. (1968). Excitation of nonradiative surface plasma waves in silver by the method of
frustrated total reflection. Zeitschrift für Physik A Hadrons and Nuclei, Vol.215, No.4,
(August 1968), pp. 398-410
Davies, J. (October 28, 1996). Surface Analytical Techniques for Probing Biomaterial Processes,
CRC Press, ISBN 978-084-9383-52-6, Boca Raton, Florida, USA
Rich, R. L. & Myszka, D. G. (2005). Survey of the year 2004 commercial optical biosensor
literature, Journal of Molecular Recognition, Vol.18, No.6, (November/December
2005), pp. 431-478
Safsten, P.; Klakamp, S. L.; Drake, A. W.; Karlsson, R. & Myszka, D. G. (2006). Screening
antibody-antigen interactions in parallel using Biacore A100. Analytical
Biochemistry, (June 2006), Vol.353, No.2, pp. 181-190
Misono, T. S. & Kumar, P. K. R. (2005). Selection of RNA aptamers against human influenza
virus hemagglutinin using surface plasmon resonance. Analytical Biochemistry,( July
2005), Vol.342, No.2, pp. 312-317
Chien, F. C.; Chen, S. J. (2004). A sensitivity comparison of optical biosensors based on four
different surface plasmon resonance modes. Biosensors and Bioelectronics, (October
2004), Vol.20, No. 3, pp. 633-642
Takemoto, D. K.; Skehel, J. J. & Wiley, D. C. (1996). A surface plasmon resonance assay for
the binding of influenza virus hemagglutinin to its sialic acid receptor. Virology,
(Mar 1996), Vol.217, No.2, pp. 452-458
Poupard, J. A.; Walsh L. R. & Kleger B. (1994), Antimicrobial Susceptibility Testing: Critical
Issues for the 90's, Plenum Press, ISBN 030-6446-73-1, New York, USA
Levinson, W. E. & Jawetz E. (1989). Medical Microbiology & Immunology, Appleton & Lange,
ISBN 978-007-1382-17-5, San Mateo, California, USA
Macheboeuf, P.; Contreras-Martel, C.; Job, V. ; Dideberg, O. & Dessen, A. (2006).
Penicillin Binding Proteins: key players in bacterial cell cycle and drug
resistance processes. FEMS Microbiology Reviews, (June 2006), Vol.30, No.5, pp.
673–691
Malacinski, G. M. & Freifelder, D. (January 15, 1998). Essentials of Molecular Biology, Jones &
Bartlett Publishers, ISBN 978-086-7208-60-3, Sudbury, Ontario, Canada
Biosensors for Health, Environment and Biosecurity
468
Chiang, Y-L.; Lin, C-H.; Yen, M-Y.; Su, Y-D.; Chen, S-J. & Chen, H-F. (2009). Innovative
Antimicrobial susceptibility testing method using surface plasmon resonance.
Biosensors & Bioelectronics, (March 2009), Vol.24, No.7, pp. 1905-1910
22
Mammalian-Based Bioreporter Targets:
Protein Expression for Bioluminescent
and Fluorescent Detection in the
Mammalian Cellular Background
Dan Close, Steven Ripp and Gary Sayler
Center for Environmental Biotechnology, The University of Tennessee, Knoxville
The United States of America
1. Introduction
While originally utilized primarily in prokaryotic organisms, reporter systems such as green
fluorescent protein (GFP) and its variants, substrate dependent luciferase systems such as
beetle and marine luciferase proteins, and substrate independent luciferase systems such as
the bacterial luciferase gene cassette have now become the standards for imaging in the
mammalian cellular background as well (Fig. 1). This has occurred in part because the use of
cultured mammalian cells or small animal models has increased steadily over time in order
to obtain more relevant human proxies for the measurement of cellular processes and
bioavailability of biomedically relevant compounds of interest. However, the expression and
detection of these reporter systems in eukaryotic models presents unique challenges not
encountered in their prokaryotic counterparts.
The differences in gene expression and cellular compartmentalization between prokaryotic
and eukaryotic cells represent the major obstacles for the efficient expression of these and
other reporter systems at the cellular level, but once the line has been crossed from
expression in single cells to expression in multicelluar organisms, these problems can be
compounded by the increases in absorption and scattering intrinsic to whole animal
imaging. As a result, much consideration must be given to the experimental design
associated with bioluminescent or fluorescent detection from mammalian cells. The type of
system employed, whether it be cell culture or whole animal, the depth of imaging, the
relevant time period available for data collection, and even the ability to distinguish
multiple reporter systems from within the same tissue must be understood and
acknowledged prior to beginning any experiment.
To better prepare for selection of the most appropriate reporter protein for the detection of a
bioluminescent or fluorescent signal from mammalian tissue, this chapter will highlight and
compare the utility of the most commonly available reporter systems as reported in the
current literature. Specifically, the chapter will focus on the green fluorescent protein (GFP)
and its color shifted variants, D-luciferin based luciferase proteins (both from the firefly and
from click beetles), coelenterazine based luciferase proteins (those from the Renilla and
Gaussia genera), and the bacterial luciferase gene cassette (lux). A short background of the
major reporter proteins will be given that explains the biochemical requirements of each, as
Biosensors for Health, Environment and Biosecurity
470
well as the physical properties that make them unique (emission wavelength, quantum
yield, etc.). These properties will be considered in relation to how they influence the ability
to detect the resulting bioluminescent or fluorescent signal using commercially available
equipment.
Fig. 1. Bioluminescent detection from a small animal model.
The luminescent (as shown here from cells expressing human codon-optimized bacterial
luciferase genes) or fluorescent signals of a reporter cell line can be detected through the
tissue of a living small animal host, allowing for localization of the cell population and
estimation of its size without the need to sacrifice the host.
To provide a better understanding of the function of each of the reporter systems, relevant
examples will be cited that illustrate the common use of each reporter system, as well as
novel examples that show how each can be adapted to function under unique circumstances
based on their biochemical requirements and physical emission properties. The relative
strengths and weaknesses of each of the considered reporter systems will also be discussed,
with an eye towards their role in imaging cellular processes at the level of cell culture
imaging, near surface detection through tissue in small animal models, and deep tissue
(beyond subcutaneous) imaging in small animal models. The overall goal is to present a fair
representation of the potential uses of each of the chosen reporter systems to allow for
selection of the most appropriate system for a given experimental design.
2. Imaging concerns in biological tissues
There are additional concerns when performing data collection from within a living
medium that must be considered in addition to the traditional focus on experimental
efficiency. The detection of a fluorescent or luminescent signal from within a tissue sample
can be dependent on multiple factors, such as the total flux of photons capable of being