Current Trends and Challenges in RFID Part 6 doc
Bạn đang xem bản rút gọn của tài liệu. Xem và tải ngay bản đầy đủ của tài liệu tại đây (1.56 MB, 30 trang )
Current Trends and Challenges in RFID
140
circuit to maximize the transfer of power into and out of it. We selected an Alien’s Gen 2
RFID chip which has an impedance value of 30 - 110j Ω, so we designed the tag antenna
with the impedance value of 30 + 110j Ω to conjugate match with the chip. In the simulation,
we considered both the resistivity of the materials, surface roughness, and configuration of
the antenna. Based on the simulation result, we designed a series of RFID tag antenna based
on #1 and #2 series. The antenna is a 82 mm-long dipole with a short line connecting two
parts, as shown in Fig. 9.[36] For example, the simulated impedance of the ECA antenna
filled with 30 wt% of silver filler is 33 + 108j at 915 MHz which well matches the Alien’s
RFID strap (30 - 110j). The calculated return loss values is -24 dB, which means over 99%
power is transmitted to RFID chip. We found that the -10 dB power transmission bandwidth
of the antenna is 60 MHz which covers the operation frequency of North American, China,
and Hong Kong standards.[37] Herein we use the minimum turn-on power of the reader as
the index of the RFID tag antenna performance. The reader is located one meter in distance
towards the RFID tag (a piece of EPCglobal Class 1 Gen 2 RFID Chip is adhered to the center
of the antenna). From the experimental result, we can observe that the minimum turn-on
power of the reader is consistent with the electrical resistivity of the ECA samples, i.e. with
the increment of the resistivity of the antenna, the reader needs a higher minimum turn-on
power to detect the tag (Fig. 12). Therefore, using the same antenna design, we can adjust
the content of silver filler in the ECA to cater to different requirement of read range. As for
the real application of RFID technique, the power out-put of the reader is often fixed to a
certain value. Controlling the resistivity of the ECA can probably be a convenient way to
cater to the different requirement of read range requirement. Apparently that by using the
low silver filler content paste the cost of RFID tags can be dramatically reduced. Meanwhile,
the environmentally benign polyurethane based ECAs take the advantage in food supply
chain and medical applications etc.
Fig. 11. SEM images of the cross sections of some of the ECA bulk samples. A) 30% of filler;
B) 40% of filler; C) 55% of filler; D) 70% of filler; and E) 75% of filler. (Scale bar = 10 µm)
(Copyright @ 2010 Springer Publishing House)
The ECA samples with different silver content were prepared, printed into pre-designed
geometries and their performances such as electrical resistivity, adhesion strength to PET
film, and high frequency performances were studied. From the experimental results, the
Conductive Adhesives as the Ultralow Cost RFID Tag Antenna Material
141
ECA with the silver content as low as 47.5% still maintain an acceptable conductivity (6.56 x
10
-4
and 5.96 x 10
-4
Ω·cm), which is efficient for high frequency applications. This suggests
that by adjusting the silver content, the electrical and mechanical properties of the ECAs can
be modulated. On the other hand, we observed that the silver content at 70% showed similar
conductivity to those with higher silver content, which suggests that the silver content at
this level reaches the summit of the conductivity. In a 720-hour 85
o
C/85%RH aging test, we
observed that in a large range of silver contents from 30% to 75%, the electrical resistivity of
this PU based ECA was very stable. They also passed the 720-hour thermal cycling test for
electrical conductivity. After all, blocked-PU based resin has been demonstrated efficient for
fabricating the low-cost and flexible ECAs, which has also been demonstrated feasible in the
ultra high frequency RFID tag antennas.
4. Water-based ECAs
PU displays various characters such as adjustable mechanical properties, shape-memory
property, and excellent stability.[38-40] Moreover, many PU-based resins are biocompatible
and can be obtained from renewable resources such as from vegetable oils.[41-43] The
water-based PU resins exhibit even more advantages since there is no organic small
molecule involved or released during the printing process. Recently, Yang et al. investigated
the feasibility of applying the water-based PU resin as the dispersant material for the ECAs.
Here cycloaliphatic PU is prepared in the emulsion based reaction. As shown in Scheme 2,
the water-borne PU dispersant is prepared mainly in four steps: 1. polyether polyol (here is
polytetrahydrofuran 2000), dihydroxylmethylpropionic acid (DHPA), and isophorone
diisocyanate (IPDI) are mixed together for preparing the prepolymer; 2. chain extender
(butylene diol) is added until the chain propagation is terminated; 3. triethylamine (TEA) is
added to neutralize the system; 4. water is added dropwise so that the PU is transferred into
aqueous solution. Finally, the organic solvent and the unreacted chemicals are removed by
vacuum. The resulting PU emulsion is translucent bluish with long shelf-life and stable
rheological property. The structure of the PU resin prepared in this way was confirmed by
FT-IR spectrum. As shown in Fig. 13, the FT-IR spectrum of the dried film of the as-prepared
water-borne PU is investigated. The peaks at 2933 cm
-1
and 2854 cm
-1
confirm the existence
of the –CH
2
- group, the 1698 cm
-1
the carbonyl group, and 1239 cm
-1
and 1108 cm
-1
confirm
the C-O vibrations. The as-prepared PU has excellent thermal stability, which was
confirmed by using thermalgravimetric analysis (TGA). The temperature of the sample was
ramped from room temperature to 600
o
C with the speed of 20
o
C/min in the air (Fig. 14).
The sample lost less than 10% weight before it reached 250
o
C. Further raising the
temperature resulted in the total decomposition, until the temperature reached 430
o
C. This
result suggests that the PU dispersant is suitable for the general solder reflow process as
well when it is applied in the traditional packaging process.
The WBECAs were prepared by mixing the PU resin and a certain portion of the modified
silver microflakes together by using a THINKY ARE250 mixer.[20] By adjusting the ratio
between the two components we are able to achieve an optimum between the mechanical
strength and electrical conductivity. NaBH
4
has been considered as a very powerful
reducing agent for protecting many metals from oxidations. For example, addition of small
amount of NaBH
4
has been demonstrated effective for improving the percolation among the
copper and nickel powders via an in-situ reducing process for ink-jet printing conductive
lines.[44] Here we tentatively added in 0.5% (by weight) and 1% (by weight) of NaBH
4
(vs.
Current Trends and Challenges in RFID
142
Ag) into the WBECAs, as an agent for preventing the oxidation issue during the processing
steps. The cross section images of the samples were studied on both transmission electron
microscopy (TEM) and scanning electron microscopy (SEM). As shown in Fig. 15, the
electrical resistivity of the printed resistor which is based on different silver content and
NaBH
4
treatment condition are listed in Table 1. From Fig. 15, we can observe that the
addition of NaBH
4
can effectively reduce the electrical resistivity of the printed resistors
which were prepared by using the WBECAs. The improvement of the resistivity is about
one order of magnitude.
Polyol
+
H
2
C
CH
3
COOH
H
2
C
OHHO
+
OCN-R-NCO
IPDI
HO OH
HN C O
O
O C
H
N
O
R
H
N
C
O
O
H
2
C
CH
3
COOH
H
2
C
O C
O
H
N
R
H
N
C
O
O O C
O
NH
R
NCO
R
NCO
(isocyanate terminated prepolymer)
neutralization with TEA
HN C
O
O
O C
H
N
O
R
H
N
C
O
O
H
2
C
CH
3
COOH
H
2
C
O C
O
H
N
R
H
N
C
O
O O C
O
NH
R
NCO
R
NCO
N(CH
2
H
5
)
3
H
2
O
H
2
NCH
2
CH
2
NH
2
(ethylene diamine)
HN C
O
O
O C
H
N
O
R
H
N
C
O
O
H
2
C
CH
3
COOH
H
2
C
O C
O
H
N
R
H
N
C
O
O O C
O
NH
N(CH
2
H
5
)
3
Waterborne Polyurethane
R=
H
3
C
CH
3
CH
3
*
*
DHPA
Scheme 2. Preparation route of the water-borne PU dispersant.
The measurement of the variation of electrical resistivity of the printed ECA samples were
conducted in a TERCHY MHU-150L humidity chamber (85°C/85% relative humidity) for 60
days for the temperature-humidity testing (THT) (Fig. 16). As shown in Fig. 16, we can observe
a trend of decrease of the electrical resistivity over the period of time. The reasons of the
decrement of the electrical resistivity of all the samples are related to the following points: 1)
Conductive Adhesives as the Ultralow Cost RFID Tag Antenna Material
143
the water-borne PU dispersant is intrinsically an emulsion which contains both the
hydrophilic part and the hydrophobic part; water molecules trapped in the interstitial sites are
eliminated during the aging process or thermal curing process which renders shrinkage of the
total size; 2) since the glass transition temperature (T
g
) of the water-borne PU dispersant is
much lower than room temperature (~-20
o
C), the creeping of the hydrophobic polymer chain
enhances the phase separation of the hydrophobic/hydrophilic regions, which results in a
stronger interaction among the polymer chains by hydrophobic interaction and hydrogen
bond as well. These two factors take effect both in the thermal curing process (if there is any)
and the aging process as well. Thus we observed kind of variation of the electrical resistivity.
After all, we did not observe any increase of the electrical resistivity of all samples after the
aging test, which suggests sufficient reliability for real applications. Since many rubbery
substrates are very sensitive to the high temperature (due to their extremely low T
g
), they can
be used as the stretchable circuit boards and fabricated at room temperature by using the
WBECAs as the circuits and interconnects.
30
40
50
60
70
80
12 13 14 15 16 17 18 19 20 21 22 23 24 25 26
Minimum Turn on Power (dBm)
RFID Tag Antenna ICA Filler Content (%)
#1
#2
Fig. 12. Minimum turn-on power of the reader in detecting the RFID tags with the antenna
printed using the ECAs. (Copyright @ 2011 Springer Publishing House)
The relation between the silver content and the tensile property of the WBECA thin film
samples were investigated on an Advanced Rheometric Expansion System (ARES) (TA
instruments, USA). The specimens were prepared on a piece of smooth low density
polyethylene (LDPE) substrate, so that they could form an even and flat thin film. When
they were naturally dried, they were peeled off carefully from the substrate and then cut
into small strips with the dimension near 40 x 3 x 0.1 mm
3
(each was accurately confirmed
by a caliper), and mounted onto ARES by a thin film tensile test fixture. The measurement
was conducted at 25
o
C with a 2000 g·cm transducer. The extension speed was 0.2 mm/s
in a strain-controlled mode. As shown in Table 1, we can observe that the Young’s
Current Trends and Challenges in RFID
144
modulus of all the three samples does not change significantly along with the different
silver content level. This suggests that the addition of NaBH
4
does not have significant
influence to the mechanical strength of the WBECA samples.
Compared to the other traditional dispersants for the ECAs, such as epoxy, polyester, and
polyacrylates etc., water-borne PU as the resin dispersant displays a few advantages: 1. the
resin is dispersed in water, thus the printing process does not involves toxic volatile
materials and the residues can be conveniently removed by water; 2. the PU materials can be
prepared from a large variety of sources such as from plants, thus PU has better
environmental benign character and adjustable mechanical strength; 3. the urethane bond is
relatively strong, thus the materials have a high reliability for general electronic packaging
applications; 4. the curing step for the ECAs can take place at even room temperature (of
course a higher temperature may help accelerate the process) thus it saves energy; 5. the
WBECAs have adjustable rheological property thus they are suitable for many types of
printing process such as screen printing, gravure printing, and roll-to-roll printing etc.
In summary, by sensitizing a small amount of NaBH
4
, the electrical conductivity of the
WBECAs can be effectively improved of about one order of magnitude; the percolation
threshold of the silver filler is reduced as well. The lowest electrical resistivity ever
measured in this material was in the order of 10
-5
Ω cm. The mechanical strength of the thin
films of the free-standing WBECAs improves along with the PU dispersant amount. These
WBECAs can be applied in the general printing process for general applications as ordinary
ECAs can do, while they display many unique properties, such as amenity for processing,
environmentally benign, excellent shelf-life and reliability in long-term storage and
applications, water-proof, and the mechanical property can be adjusted by choosing
different prepolymers.
4000 3500 3000 2500 2000 1500 1000 500
0.0
0.5
1.0
1.5
2.0
2.5
-CH-
-NH-
Absorption (a.u.)
Wavenumber (cm
-1
)
C=O
-CH
2
-
-OH
C-O-C
C-O-C
Fig. 13. FT-IR spectrum of the dried film of the water-borne PU.
Conductive Adhesives as the Ultralow Cost RFID Tag Antenna Material
145
0 100 200 300 400 500 600
0
20
40
60
80
100
Weight (%)
Temperature (
o
C)
WB-PU
Fig. 14. TGA analysis of the PU dried film. The sample was ramped from 25
o
C to 600
o
C in
the air.
60% 65% 70% 75% 80% 85%
1E-5
1E-4
1E-3
0.01
Volume Resistivity (ohm*cm)
Silver content
A
B
C
Fig. 15. Volume resistivity of the WBECAs (80 wt% of silver) versus different addition
amount of NaBH
4
. (A) no NaBH
4
addition; (B) 0.5% of NaBH
4
; (C) 1% of NaBH
4
.
Current Trends and Challenges in RFID
146
0 102030405060
70
80
90
100
Decrease of Electrical Resistance (%)
Time (Days)
A
B
C
Fig. 16. Thermal-humidity reliability of the WBECAs versus aging time. (A) no NaBH
4
addition; (B) 0.5% of NaBH
4
; (C) 1% of NaBH
4
.
Young's modulus
(MPa)
60% silver 70% silver 80% silver 85% silver
no treatment 0.291 0.322 0.311 0.309
0.5% NaBH
4
0.289 0.338 0.364 0.358
1% NaBH
4
0.297 0.319 0.347 0.339
Table 1. A table showing the Young's modulus of the WBECA thin film samples including
the untreated, 0.5% of NaBH
4
treated, and 1% of NaBH
4
treated ones.
5. Conclusions
In summary, the authors introduced the recent progress of the silver microflake-filled
ECAs as a candidate for the RFID tag antenna applications. ECAs exhibit many
advantages such as printability and low-temperature processability as compared to the
conventional antenna preparation methods, which render them significant in both the
conventional Complementary Metal Oxide Semiconductor (CMOS) based and the organic
Conductive Adhesives as the Ultralow Cost RFID Tag Antenna Material
147
all-printed ones. However, their electrical, mechanical, and environmental performances
are still undergoing intensive investigations. In this chapter, the authors gave several
simple introductions about how to improve the electrical conductivity of the ECAs and
introduced some PU based resin dispersants for ECAs. By adjusting the balance between
the electrical conductivity and the materials cost, ECAs could find a larger market in both
far field and near field applications. Any significant advancement of the materials would
enhance the widespread uses of the tags, which is benefit from both the lower cost and
higher performances. The examples given in this article have their merit and limitations;
we expect that they may give elicitations for developing techniques for manufacturing
low-cost, flexible ubiquitous information terminals.
6. Acknowledgement
The authors acknowledge the financial support from the Tsinghua University the Graduate
School at Shenzhen.
7. References
[1] Das, R. & Harrop, P. (2009). Printed, Organic & Flexible Electronics Forecasts, Players
& Opportunities 2009-2029, IDTechEx, ISBN/SKU #:IDT6769, March, 2009
[2] Finkenzeller, K. (2002). RFID-Handbuch Hanser-Verlag, ISBN 978-344-6212-78-7,
München, Germany
[3] Yang, C.; Xu, B. & Yuen, M. M. F. (2008). Using Novel Materials to Enhance the
Efficiency of Conductive Polymer, The 58th IEEE Electronic Components and
Technology Conference, Vol. 5, pp. 213, ISBN 978-1-4244-2230-2, Orlando,
Florida, USA, May 27-30, 2008
[4] Syed, A.; Demarest, K. & Deavours, D. D. (2007). Effects of Antenna Material on the
Performance of UHF RFID Tags, IEEE International Conference on RFID, pp. 57-
62, ISBN 1-4244-1013-4, Grapevine, TX, USA, March 26-28, 2007
[5] Stauffer, D. & Aharony, A. (1992). Introduction to Percolation Theory, Taylor & Francis
ISBN 0-850-663156, London, UK
[6] Chiang, H. W.; Chung, C. L.; Chen, L. C.; Li, Y.; Wong, C. P. & Fu, S. L. (2005).
Processing and shape effects on silver paste electrically conductive adhesives
(ECAs), Journal of Adhesion Science and Technology, Vol. 19, No. 7, (June 2005),
pp. 565-578, ISSN 0169-4243
[7] Wu, H. P.; Wu, X. J.; Ge, M. Y.; Zhang, G. Q.; Wang, Y. W. & Jiang, J. Z. (2007). Effect
analysis of filler sizes on percolation threshold of isotropical conductive
adhesives, Composites Science and Technology, Vol. 67, No. 6, (May 2007), pp.
1116-1120, ISSN 0266-3538
[8] Li, Y.; Moon, K. S. & Wong, C. P. (2005). Electronics without lead, Science, Vol. 308,
No. 5727, (June 2005), pp. 1419-1420, ISSN 0036-8075
[9] Chatterjee, K.; Banerjee, S. & Chakravorty, D. (2004). Metal-to-insulator transition in
silver nanolayers grown on silver oxide nanoparticles, Europhysics Letters, Vol.
66, No. 4, (May 2004), pp. 592-599, ISSN 0295-5075
Current Trends and Challenges in RFID
148
[10] Lu, D. Q. & Wong, C. P. (2000). Effects of shrinkage on conductivity of isotropic
conductive adhesives, Int. J. Adhesion & Adhesives, Vol. 20, No. 3, (May 2000),
pp. 189-193, ISSN 0143-7496
[11] Kim, K. D. & Chung, D. D. L. (2005). Electrically conductive adhesive and soldered
joints under compression, Journal of Adhesion Science and Technology, Vol. 19,
No. 11, (November 2005), pp. 1003-1023, ISSN 0169-4243
[12] Lu, D. D.; Tong, Q. & Wong, C. P. (1999). Conductivity Mechanisms of Isotropic
Conductive Adhesives (ICA’s), IEEE Transactions on Electronics Packaging
Manufacturing, Vol. 22, (July 1999), pp. 223-227, ISSN 1521-334X
[13] Su, B. & Qu, J. (2004) A micro-mechanics model for electrical conduction in
isotropically conductive adhesives during curing, Proceedings - Electronic
Components & Technology Conference, Vol. 2, (June 2004), pp. 1766-1771, ISBN:
0-7803-8365-6
[14] Li, Y.; Yim, M. J.; Moon, K. S. & Wong, C. P. (2009). Electrically conductive adhesives,
Smart Materials, (November 2009), pp. 11/12, CRC Press, ISBN 978-1-4200-4372-
3, Boca Raton, Fl, USA
[15] Yim, M.; Li, Y.; Moon, K. & Wong, C. P. (2007). Oxidation prevention and electrical
property enhancement of copper-filled isotropically conductive adhesives,
J. Elect. Mater., Vol. 36, No. 10, (August 2007), pp. 1341-1347, ISSN
1573-4803
[16] Li, Y.; Whitman, A.; Moon, K. S. & Wong, C. P. (2005). High performance electrically
conductive adhesives (ECAs) modified with novel aldehydes, Proceedings -
Electronic Components & Technology Conference, Vol. 2 , (May, 2005) pp. 1648-
1652, ISBN 0-7803-8906-9
[17] Jiang, H. J.; Moon, K. S.; Li, Y. & Wong, C. P. (2006). Surface functionalized silver
nanoparticles for ultrahigh conductive polymer composites, Chem. Mater., Vol.
18, No. 13, (May 2006), pp. 2969-2973, ISSN 0897-4756
[18] Li, Y.; Moon, K.; Whitman, A. & Wong, C. P. (2006). Enhancement of electrical
properties of electrically conductive adhesives (ECAs) by using novel aldehydes,
IEEE Transactions on Components and Packaging Technologies, Vol. 29, No. 4,
(October 2006), pp. 758-763, ISBN 0-7803-8906-9
[19] Lu, D. D.; Li, Y. & Wong, C. P. (2008). Recent advances in nano-conductive adhesives,
J. Adhes. Sci. & Tech., Vol. 22, No. 8-9, (August 2008), pp. 801-834, ISSN 0169-
4243
[20] Yang, C.; Xie, Y. T.; Yuen, M. M. F.; Xu, B.; Gao, B.; Xiong, X. M. & Wong, C. P. (2010).
Silver Surface Iodination for Enhancing the Conductivity of Conductive
Composites, Adv. Func. Mater., Vol. 20, No. 16, (August 2010), pp. 2580-2587,
ISSN 1616-301X
[21] Matsunaga, K.; Tanaka, I. & Adachi, H. (1998). Electronic mechanism of Ag-cluster
formation in AgBr and AgI, Journal of the Physical Society of Japan, Vol. 67, No.
6, (December 1998), pp. 2027-2036, ISSN 0031-9015
[22] Hull, S. (2004). Superionics: crystal structures and conduction processes, Rep. Prog.
Phys., Vol. 67, No. 7, (July 2004), pp. 1233-1316, ISSN 0034-4885
Conductive Adhesives as the Ultralow Cost RFID Tag Antenna Material
149
[23] Bardi, U. & Rovida, G. (1983). Leed, AES and Thermal Desorption Study of Iodine
Chemisorption on the Silver (100), (111) and (110) Faces, Surface Science, Vol.
128, No. 2-3, (January 1983), pp. 145-168, ISSN 0039-6028
[24] Zhang, X.; Stewart, S.; Shoesmith, D. W. & Wren, J. C. (2007). Interaction of aqueous
iodine species with Ag2O/Ag surfaces, J. Electrochem. Soc., Vol. 154, No. 4,
(February 2007), pp. F70-F76, ISSN 0013-4651
[25] Thiel, P. A.; Shen, M.; Liu, D. J. & Evans, J. W. (2009). Coarsening of Two-Dimensional
Nanoclusters on Metal Surfaces, J. Phys. Chem. C, Vol. 113, No. 13, (March 2009),
pp. 5047, ISSN 1932-7447
[26] Hasse, U., Fletcher, S. & Scholz, F. (2006). Nucleation-growth kinetics of the oxidation
of silver nanocrystals to silver halide crystals, J. Solid State Electrochem., Vol. 10,
No. 10, (May 2006), pp. 833-840, ISSN 1432-8488
[27] Andryushechkin, B. V.; Zhidomirov, G. M.; Eltsov, K. N.; Hladchanka, Y. V. &
Korlyukov, A. A. (2009). Local structure of the Ag(100) surface reacting with
molecular iodine: Experimental and theoretical study, Phys. Rev. B, Vol. 80, No.
12, (September 2009), pp. 125409 1-10, ISSN 1098-0121
[28] Bonacic-Koutecky, V. & Mitric, R. (2005). Theoretical exploration of ultrafast
dynamics in atomic clusters: Analysis and control, Chem. Rev., Vol. 105, No. 1,
(January 2005), pp. 11-66, ISSN 0009-2665
[29] Hagen, J.; Socaciu, L. D.; Le Roux, J.; Popolan, D.; Bernhardt, T. M.; Woste, L.; Mitric,
R.; Noack, H. & Bonacic-Koutecky, V. (2004). Cooperative effects in the activation
of molecular oxygen by anionic silver clusters, J. Am. Chem. Soc., Vol. 126, No.
11, (February 2004), pp. 3442-3443, ISSN 0002-7863
[30] Sibbald, M. S.; Chumanov, G. & Cotton, T. M. (1997). Reductive properties of iodide-
modified silver nanoparticles, J. Electroanal. Chem., Vol. 438, No. 1-2, (November
1997), pp. 179-185, ISSN 0022-0728
[31] Fourcade, F.; Tzedakis, T. & Bergel, A. (2003). Electrochemical process for metal
recovery from iodized silver derivatives in liquid/solid mixture: Experimental
and theoretical approaches, Chem. Eng. Sci., Vol. 58, No. 15, (August 2003), pp.
3507-3522, ISSN 0009-2509
[32] Patil, K. C.; Rao, C. N. R.; Lacksone, J. & Dryden, C. E. (1967). Silver nitrate-iodine
reaction-iodine nitrate as reaction intermediate, J. Inorg. & Nucl. Chem., Vol. 29,
No. 2, (February 1967), pp. 407-412, ISSN 0022-1902
[33] Li, Y.; Xiao, F.; Moon, K. & Wong, C. P. (2006). Amino acid as a novel curing agent for
epoxy resins in electronic materials, PMSE Preprints, Vol. 94, pp. 873-874, ISSN
1550-6703
[34] Li, Y.; Xiao, F. & Wong, C. P. (2007). Novel, environmentally friendly crosslinking
system of an epoxy using an amino acid: tryptophan-cured diglycidyl ether of
bisphenol a epoxy. J. Polym. Sci. A: Polym. Chem., Vol. 45, No. 2, (January 2007),
pp. 181-190, ISSN 0887-624X
[35] (2005). EFSA, Parma, Italy
[36] Chen, S. L. & Lin, K. H., Performance of a Folded Dipole with a Closed Loop for RFID
Applications, in "Progress In Electromagnetics Research Symposium" (2007) pp.
329-331, ISBN 978-1-934142-01-1, Prague, Czech Republic, August 27-30, 2007
Current Trends and Challenges in RFID
150
[37] Barthel, H. (2008). Regulatory status for using RFID in the UHF spectrum, EPCglobal
Inc., ISBN 978-1-4244-2041-4, October 2008
[38] Subramani, S.; Park, Y. J.; Lee, Y. S. & Kim, J. H. (2003). New development of
polyurethane dispersion derived from blocked aromatic diisocyanate, Prog. Org.
Coat., Vol. 48, No. 1, (November 2003), pp. 71-79, ISSN 0300-9440
[39] Yang, C.; Tang, Y. H.; Lam, W. M.; Lu, W. W.; Gao, P.; Zhao, C. B. & Yuen, M. M. F.
(2010). Moisture-cured elastomeric transparent UV and X-ray shielding organic-
inorganic hybrids, J. Mater. Sci., Vol. 45, No. 13, (July 2010), pp. 3588-3594, ISSN
0022-2461
[40] Wicks, D. A. & Wicks, Z. W. (2001). Multistep chemistry in thin films; the challenges
of blocked isocyanates, Prog. Org. Coat., Vol. 43, No. 1-3, (November 2001), pp.
131-140, ISSN 0300-9440
[41] Sharma, V. & Kundu, P. P. (2008). Condensation polymers from natural oils, Prog.
Polym. Sci., Vol. 33, No. 12, (December 2008), pp. 1199-1215, ISSN 0079-6700
[42] Guner, F. S.; Yagci, Y. & Erciyes, A. T. (2006). Polymers from triglyceride oils, Prog.
Polym. Sci., Vol. 31, No. 7, (July 2006), pp. 633-670, ISSN 0079-6700
[43] Petrovic, Z. S. (2008). Polyurethanes from vegetable oilsm Polym. Rev., Vol. 48, No. 1,
(January 2008), pp. 109-155, ISSN 1558-3724
[44] Li, D.; Sutton, D.; Burgess, A.; Graham, D. & Calvert, P. D. (2009). Conductive copper
and nickel lines via reactive inkjet printing, J. Mater. Chem. Vol. 19, (April 2009),
pp. 3719-3724, ISSN 0959-9428
8
Key Factors Affecting the Performance
of RFID Tag Antennas
Yung-Cheng Hsieh
1
, Hui-Wen Cheng
2
and Yu-Ju Wu
3
1
Department of Graphic Communication Arts
Dean, Research and Development
National Taiwan University of Arts
2
Department of Graphic Communication Arts
Research Assistant
National Taiwan University of Arts
3
School of Technology
Assistant Profeddor
Eastern Illinois University
1,2
Taiwan
3
USA
1. Introduction
Bar codes and Radio Frequency Identification (RFID) both belong to a group of technologies
called Automatic Identification and Data Capture. People have all become very aware of bar
codes as they have permeated our existence in the last 25 years. In fact, it is tough to buy
something in a store that does not use bar codes these days. But bar codes have four
disadvantages: you have to be able to see them, the bar code cannot be written on or
defaced, you cannot change the data once they are printed, and they take up space on the
object they are printed on. To eliminate those disadvantages, RFID is the solution. RFID is a
means of capturing data about an object without using a human to read the data. Along
with Smart cards, and Magnetic Stripe technology and a host of others, this is a method of
automating our need for data. Recently, the technique of RFID grabs people’s attention
because it captures data about an object without using a human to read the data.
Individual RFID tags must be cost-efficiency for these applications (usually less than one to
two cents). The cost of antennas is a crucial factor in the mass production of antennas. To
reach this goal, emphasis has been placed on the development of printed electronics
technologies to enable the manufacturing of RFID tags in an economically competitive way
(Hodgson, n.d.; Björninen, et al., 2009). Various printing processes has been or is currently
being used for producing a number of electronic components such as printed circuits,
displays, RFID antennas, batteries, etc. Printing techniques such as flexographic, offset and
gravure are suited for mass production, while screen printing and ink-jet printing have been
identified as processes that could be employed for printing the antennas in order to bring
down the cost of RFID tags
(Sangoi, 2004; Subramanian, 2005). Screen printing enables very
thin printing and also very thick films. It has been used for a long time to print circuits and
remains interesting for electronic printing. In the future, different printing methods are
Current Trends and Challenges in RFID
152
likely to co-exist in the printed electronics market. The choice of printed electronics
technologies will base on the normal parameters such as run length, feature size and
variable data requirements
(Blayo & Pineaux, 2005; Parashkov, et al, 2005).
Three requirements of printed electronics are resolution, accuracy of position, and amount
of material deposited (i.e., thickness and content of active particles). Although the
achievable resolution with screen printing (usually under 50 lines per centimeter) is not
sufficient for high-performance electronics, it is still applicable to print gates for TFTs,
dielectrics, and semiconductors. In printed electronics, silver particles are often used to form
the conductive layer. Thin conducting layers are preferred to maintain low manufacturing
costs while maintain good radiation efficiency
(Parashkov, et al, 2005; Björninen, et al., 2009).
Therefore, the amount of silver and the thickness of the conductive layer need to be well
defined. Previous works have shown that decreasing conductor thickness increases losses
and thereby decreases efficiency and results to weaker backscatter from the tag. Gao and
Yuen’s paper (2009) exam the effects of printing thickness on the performance of UHF RFID
tags and found out that the 10 µm thick RFID antenna exhibits relatively good radiation
efficiency. Koptioug et al.’s paper on “On the Behavior of Printed RFID Tag Antennas,
Using Conductive Paint” indicated that with conductive layers of thickness beneath 10 μm,
a commercially available silver-based paint with finite conductivity showed low radiation
efficiency at high frequency. The thinner printed silver paste RFID tag antenna is a potential
solution for low cost RFID tags. However, the print quality needs special attention when
RFID tags are printed using very thin conducting layers.
1.1 Needs of the study
RFID technology has been around for many years, but it is only in the past few years that we
have seen a surge in its acceptance and a massive growth in its use. However, RFID has not
been able to replace the current bar code system yet because of the high production cost of
RFID tags, especially the cost of printing RFID tag antennas. Printing the antennas is the
most critical part of producing an RFID tag. The high production cost problem of printing
RFID tag antennas can be eliminated if the conventional screen printing process can be
applied to perform the printing tasks effectively. According to literatures, screen printing
technology can be used for RFID tag printing, providing significant time and cost savings
compared to traditional etching technology. Therefore, there is a great need to investigate
the possibility of applying screen printing method to print RFID tag antennas to perform the
task of automatic identification and data capture.
1.2 Purposes of the study
This study was a true experimental research in nature and aimed to investigate the process
consistency and accuracy of printing RFID tag antennas via the screening printing method
with a conductive ink, silver-based (Ag) ink, on PET, PVC, and Wet Strength paper. The
target values of RFID frequency in this study were set at 13.56 MHz (HF). The purposes of
the study were triple fold:
1. to establish the specifications of antenna ink film thickness and ink density,
2. to compare the solid ink density, ink film thickness, and impedance differences in
process consistency and capability of printing RFID antennas on the three different
substrates, and
3. to determine the optimal substrates for RFID tags using screen printing technology with
conductive inks, in terms of process capability.
Key Factors Affecting the Performance of RFID Tag Antennas
153
The reason of selecting PET and PVC as substrates is that they have high transparency and
rigidity. Currently, PET and PVC have been frequently used as substrate materials of RFID
tags. The reason of choosing Wet Strength paper is that it is commonly used in the package
industry, and its low cost is also suitable for mass production of RFID tags.
1.3 Limitations and assumptions of the study
The following limitations must be considered when interpreting the results of this study:
4. The RFID antenna used in this study was not randomly selected; instead it was
specially designed for the study.
5. The company taking part to help the screen printing production for the study had their
own experienced printing crews; the authors did not actually perform the printing
process in every detail. This study assumes that there were no operator effects on solid
ink density and ink film thickness, although only one experienced operator ran the
press during the experiment.
6. The make, ages, and physical conditions of the press machine used to run the
experiment were not studied. Their effects on the results were therefore not discussed.
7. The type of Ag inks, three substrates, and chips were held as constants. This research
did not investigate the consistency of the materials; and therefore, their effects on the
results of this study were not explored.
8. Since the pressroom temperature and relative humidity were well controlled, their
effects on the experimental results were not studied. It is assumed that there were no
temperature and humidity effects on the results of the study.
2. Methodology
This study was a true experimental research in nature and aimed to investigate the process
consistency and capability of printing RFID tag antennas via the screening printing process
Screening printing using Ag ink with target
solid ink density of 0.27, ink film thickness of
10μm, and Frequency of 13.56 MHz
Independent variable
PET
PVC
Wet Strength Paper
Dependent variable
Ink film thickness (Y
1
)
Solid ink density (Y
2
)
Impedance (Y
3
)
Fig. 1. Research framework
Current Trends and Challenges in RFID
154
with a conductive ink, silver-based (Ag) ink, on PET, PVC, and Wet Strength paper. The
research framework is displayed in Figure 1. The three factors were PET, PVC, and Wet
Strength paper. The dependent variables were the solid ink density (SID), ink film thickness
(IFT), and impedance (IMPED) of the printed RFID tag antennas.
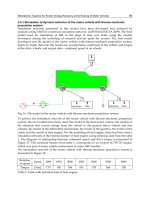
2.1 The test form
A single color test form for the tag antenna was designed for this study (as shown in Figure
1). The test form is 45mm x 76mm in size and was designed for the frequency of 13.56MHz.
Fig. 2. Antenna design (13.56MHz, 45mm x 76mm) for the study
2.2 Experimental materials
This section describes the experimental procedures for the study. It consists of the screen
printing plate materials (see Table 1), substrates (see Table 2) and press setting (see Table 3)
for the experiment.
Materials Description
Fabric Material PET
Mesh Counts 300 meshes /inch
Mesh Angle 45 degree
Screen Tension 25 N/cm
Thickness of Sensitized Emulsion 25μm
Table 1. Screen plate-making material used for the experiment
Substrates Manufacturer Specification
PET (Polyethylene Terephthalate)
NAN YA Plastic
Corporation
Thickness: 200μm
PVC (Polyvinyl Chloride)
NAN YA Plastic
Corporation
Thickness: 300μm
Wet Strength Paper HO Zone Paper Inc. gsm: 80
Silver-based (Ag) Ink, Flint Conductive Ink for Screen Printing
Table 2. Substrates and ink used in the study
Key Factors Affecting the Performance of RFID Tag Antennas
155
Item Description
Press (semi-automatic) Liang-Chen Mechanical Company
Screen Printer Mini-Angel Company in Taipei
Press Operator Mr. Lou
Relative Humidity 46~50%
Temperature 25Ԩ
Blade hardness 70 degree
Squeegee Angle 75 degree
Squeegee Speed 30 m/min
Table 3. Screen printing press setting for the study
After receiving the test form, the participating screen printer was asked to print the test
form based on their in-house standard operating procedures and conditions. During the
press runs, the research team was present all the time to monitor the whole operation
process to make sure that the press run was well-controlled.
2.3 Experimental procedure
Two print tests were run with the first operation serving as a pilot test to familiarize the
press operator with printing the test form, while the second operation served as the actual
printing experiment where printed RFID tag antennas were sampled. After the first press
run, the press was shut down and cleaned, the run counter was set to zero, and the desired
materials and conditions were made ready for the next run.
Fig. 3. The diagram of antenna impedance measurement
Current Trends and Challenges in RFID
156
One hundred printed tags were collected for each press run after the press was determined
to be at equilibrium and the desired solid ink density of .27 and ink film thickness of 10
microns (μm) (according to the practical experience of the participating screen printer of the
study) were achieved. Consequently, a total of 300 printed tags were gathered for the three
runs; and then, 50 printed tags were systematically sampled for each of the three substrates
for a total sample size of 150 (3*50). Finally, an X-Rite
530 reflective spectrodensitometer
using Murray-Davies equation (n=1) was applied to measure solid ink density (SID) of the
printed tags for this study. It is important to note that each specific measured area on the
sampled tag was read five times to reduce the measuring error. Thus, the final data entered
onto computer for the analysis was a mean of five readings from the X-Rite
530. The ink
film thickness of the printed antennas was measured by a high-accuracy digimatic indicator.
The impedance of the printed tag antennas was read using a HP 8714ET RF Network
Analyzer (T/R) (300 kHz to 3 GHz) (see Figure 3. below). The target frequency to be
achieved was 13.56 MHz. Finally SPSS 14 and Minitab 14 statistical software packages were
used for data analyses.
3. Results and findings
This section describes the overall results and findings obtained through data analyses. The
first sub-section exhibits the descriptive statistics for all the measurements. The second sub-
section shows the analyses of variance to test the hypotheses whether there was a significant
difference in solid ink density, ink film thickness, and impedance of the antennas among the
three substrates of the study. The last sub-section analyzes the process consistency and
capability for printing RFID antennas on PET, PVC, and Wet Strength paper, respectively.
3.1 Descriptive statistics
Solid ink density (SID) refers to the light-stopping power of color on substrates, measured
through the complementary-colored filter. In conventional printing workflows, the setup of
solid ink density is a vital factor to achieve an optimum print. Once the right amount
of solid ink density is determined, the RIP software automatically optimize the steps for
the target linearization, that is, enables a printer to deliver ink on a particular media
optimally so that an image’s tones can be correctly reproduced. Different linearization
settings and profile combinations will affect the final prints. Solid ink density measurement
provides an effective means of monitoring and controlling ink film thickness (Tritton, 1997,
pp.95-96).
Ink film thickness (IFT) is the most significant of the process variables and the one most
easily adjusted during printing: it can be seen affect many print attributes such as tone
transfer and print density (Tritton, 1997, pp.141-142).
Impedance is a measure of opposition to a sinusoidal alternating electric current. The
concept of electrical impedance generalizes Ohm's law to AC circuit analysis. Unlike
electrical resistance, the impedance of an electric circuit can be a complex number, but the
same unit, the ohm, is used for both quantities. (Wikipedia, Wikipedia. Retrieved February
26, 2007, from
electrical_ impedance)
Table 4 shows the SID, IFT, and impedance basic statistics (mean, standard deviation,
minimum, maximum, and 95% Confidence Interval of the mean) of the PET, PVC, and Wet
Key Factors Affecting the Performance of RFID Tag Antennas
157
Strength paper. The overall average SID value of the PET was .266 with a standard deviation
of .006, .280 for PVC with a standard deviation of .005, and .266 for Wet Strength paper with
a standard deviation of .005. The average IFT value of PET was 8.860μm with a standard
deviation of .783, 11.300 for PVC with a standard deviation of .741, and 8.670 for Wet
Strength paper with a standard deviation of .688. As for the antenna impedance, the average
number was 27.690 ohm with a standard deviation of 1.687 for PET, the average was 26.135
with a standard deviation of 1.142 for PVC, and the average was 27.428 with a standard
deviation of 1.183 for Wet Strength paper. It is important to note that the 95% confidence
intervals (95% C.I.) of the means of SID, IFT, and impedance for the three substrates are
listed in the very right-hand side column of Table 4. However, Table 4 could be used for the
specifications for screen printers to print RFID tag antennas using Ag ink.
Observed
Attribute
N Mean
Std.
Dev.
Min. Max. 95% C.I. of Mean
PET_SID 50 0.266
0.006
0.255
0.280
(0.264, 0.267)
PVC_SID 50 0.280
0.005
0.270
0.290
(0.279, 0.282)
wet_SID 50 0.266
0.005
0.260
0.275
( 0.264, 0.267)
PET_IFT 50 8.860
0.783
7.250
10.500
(8.638, 9.082)
PVC_IFT 50 11.300
0.741
10.000
13.000
(11.090, 11.510)
wet_IFT 50 8.670
0.688
7.500
10.250
(8.475, 8.866)
PET_IMPED 50 27.690
1.687
24.858
31.034
(27.211, 28.170)
PVC_ IMPED 50 26.135
1.142
25.719
30.960
(25.810, 26.460)
wet_ IMPED 50 27.428
1.813
25.051
31.034
(26.913, 27.944)
Table 4. Descriptive statistics of solid ink density, ink film thickness, and antenna
impedance on the different substrates
3.2 Hypothesis testing
In this section, One-way ANOVA and Box-plot statistical procedures were employed to
determine whether the differences in solid ink density (SID), ink film thickness (IFT), and
impedance readings of the RFID tag antennas printed using screen printing with Ag ink on
the PET, PVC, and wet strength paper were significant. The hypothesis being tested was
whether the reading difference among the substrates was equal to zero. The significant level
(α) was set at .05 for all tests. The results for the SID, IFT and impedance are exhibited in
Table 5, Table 6, and Table 7, respectively.
Hypothesis testing on the SID difference for the three substrates
The hypothesis for testing the SID reading difference on the three different tag antennas is:
___
Ho :
PET SID PVC SID wet SID
_ _ __ __
Ha : , or , or
PET SID PVC SID PET SID wet SID PVC SID wet SID
Current Trends and Challenges in RFID
158
As shown in Table 5, the significant value of p is .000 < .05 (α) and therefore the ANOVA
suggests that Ho be rejected, i.e., at least one pair of the mean SID values is significantly
different at .05 level. Examining the bottom part of Table 5 (95% Confidence Interval for
Mean) in detail, one can conclude that there existed significantly different SID readings
between the pair of PET and PVC tags and the pair of PVC and Wet Strength paper tags. In
addition, the differences in SID readings were not significant at .05 level between PET and
Wet Strength paper tags.
Source DF SS MS F P
Factor 2 0.007 0.004 120.090 0.000
Error 147 0.004 0.000
Total 149 0.011
S = 0.005420 R-Sq = 62.03% R-Sq(adj) = 61.52%
Pooled StDev = 0.00542
Table 5. Hypothesis testing on the SID difference among the three substrates
Likewise, the two straight lines originated from PVC_SID box in Figure 4 (the box plot of
SID readings for the three substrates) indicate the two pairs substrates with significantly
different SID reading were (PET, PVC) and (PVC, Wet). Among the three substrates, PVC
has the highest SID mean values than the other two substrates have.
Data
wet_SIDPVC_SIDPET_SID
0.29
0.28
0.27
0.26
0.25
Boxplot of PET_SID, PVC_SID, wet_SID
Fig. 4. Box plot of SID readings for the three substrates
Key Factors Affecting the Performance of RFID Tag Antennas
159
Hypothesis testing on the IFT difference for the three substrates
The hypothesis for testing the IFT reading difference on the three different tag antennas is:
___
Ho :
PET IFT PVC IFT wet IFT
__ __ __
Ha : , or , or
PET IFT PVC IFT PET IFT wet IFT PVC IFT wet IFT
Source DF SS MS F P
Factor 2 215.110 107.555 197.450 0.000
Error 147 80.075 0.545
Total 149 295.185
S = 0.7381 R-Sq = 72.87% R-Sq(adj) = 72.50%
Pooled StDev = 0.738
Table 6. Hypothesis testing on the IFT difference among the three substrates
Dat a
wet_IFTPVC_IFTPET_IFT
13
12
11
10
9
8
7
Boxplot of PET_IFT, PVC_IFT, wet_IFT
Fig. 5. Box plot of IFT readings for the three substrates
As shown in Table 6, the significant value of p is .000 < .05 (α) and therefore the ANOVA
suggests that Ho be rejected. That means that at least one pair of the average IFT values is
significantly different at .05 level. If we examine the bottom part of Table 6 (95% C. I. for
Current Trends and Challenges in RFID
160
Mean), we can conclude that there were significantly different IFT readings between the pair
of PET and PVC tags and the pair of PVC and Wet Strength paper tags. Moreover, the
differences in IFT readings were not significant at .05 level between PET and Wet Strength
paper tags.
The same conclusions could be drawn if we examine Figure 5 in detail: the two straight lines
originated from PVC_IFT box in Figure 5 (the box plot of IFT readings for the three
substrates) indicate that the IFT readings of PET and PVC were significantly different at
.05level, and those of PVC and Wet Strength paper were also significantly different. Among
the three substrates, PVC has the highest IFT mean values than the other two substrates
have.
Hypothesis testing on the impedance (IMPED) difference for the three substrates
The hypothesis for testing the IFT reading difference on the three different tag antennas is:
___
Ho :
PET IMPED PVC IMPED wet IMPED
_ _ __ __
Ha : , or , or
PET IMPED PVC IMPED PET IMPED wet IMPED PVC IMPED wet IMPED
Source DF SS MS F P
Factor 2
69.33
34.66
13.98
0.000
Error 147
364.57
2.48
Total 149
433.90
S = 1.575 R-Sq = 15.98% R-Sq(adj) = 14.84%
Pooled StDev = 1.575
Table 7. Hypothesis testing on the IFT difference among the three substrates
As shown in Table 7, the significant value of p is .000 < .05 (α) and therefore the ANOVA
suggests that Ho be rejected. That means that at least one pair of the mean IFT values is
significantly different at .05 level. Examining the bottom part of Table 7 (95% C. I. for Mean)
more closely, we can conclude that there were significantly different impedance readings
between the pair of PET and PVC tags and the pair of PVC and Wet Strength paper tags. In
addition, the differences in impedance readings were not significant at .05 level between
PET and Wet Strength paper tags.
The same conclusions could be drawn if we examine Figure 6: the two straight lines
originated from PVC_IMPED box in Figure 6 (the box plot of IFT readings for the three
substrates) indicate that the impedance readings of PET and PVC were significantly
different at .05level, and those of PVC and Wet Strength paper were also significantly
different at .05 level. Among the three substrates, PVC has the lowest impedance mean
values than the other two have. It is important to note that the box plot of PVC_IMPED in
Figure 6 shows that the impedance variation (the height of the box in the middle of the
PVC_IMPED) of PVC was extremely small compared with that of the other two substrates.
Key Factors Affecting the Performance of RFID Tag Antennas
161
3.3 Capability study
The section is to discuss the process consistency and capability of the observed attributes for
the three types of substrates. The tools used to analyze the consistency for each variable are
Individual Control Chart (I Chart), Moving Range Charts (MR Chart), and Capability
Analysis.
Interpretation of the relative PCR (Cp or Pp)
In capability analysis, overall capability depicts how the process is actually performing
relative to the specification limits. Potential capability depicts how the process could
perform relative to the specification limits, if shifts and drifts could be eliminated. The
difference between the two represents the opportunity for improvement. Without both
overall and potential estimates, it is hard to identify the size of the opportunity. Process
capability is a measure of how capable a process is of meeting specifications. A Cp index
(PCR) of 1 means that a process is exactly capable of meeting specifications, while less than 1
means that it is outside specification limits. Ideally, one would like to see a Cp much larger
than 1, because the larger the index, the more capable the process. Some practitioners
consider 1.33 to be a minimum acceptable value for this statistic, and few believe that a
value less than 1 is acceptable (Ryan & Joiner, 1994).
Determination of the lower specification limits (LSL) and upper specification limits
(USL)
Due to the lack of historical parameters of LSL and USL for the observed attributes (SID,
IFT, and impedance) for RFID tag antennas using screen printing with Ag ink on the three
substrates, a method of determining the proper LSL and USL is necessary. In this study, the
LSL and USL for each attribute are determined based on the following procedures (Hsieh,
2003; Montgomery, 1997, pp. 180-229):
1. Construct the trial I and MR control chart of each attribute for the four plates.
2. Examine every control chart; if it is in control, then use the lower control limit (LCL)
and upper control limit (UCL) as the LSL and USL. If it is in out-of-control condition
(for most cases), reconstruct the control chart after eliminating all out-of-control points
in the initial charts to obtain the revised values for mean, LCL, and UCL.
3. For each attribute, the difference between revised LCL and UCL of each plate obtained
in the previous step is computed and named 6σ
revised
, i.e., UCL
revised
- LCL
revised
=
6σ
revised
. Then 3σ
revised
of each plate is computed for the purpose of obtaining the
“average 3σ
revised
” of the four plates, 3Ŝ
revised
namely, i.e.,
3Ŝ
revised
= (3σ
revised/PET
+ 3σ
revised/PVC
+ 3σ
revised/wet
) / 3.
4. For each attribute, the final LSL and USL are obtained by subtracting from and adding
to the 3Ŝ
revised
, the revised mean of each plate, i.e.,
LSL
final
= Mean
revised
– 3Ŝ
revised
USL
final
= Mean
revised
+ 3Ŝ
revised
5. The LSL
final
and USL
final
were then used to assess the relative Process Capability Ration
(PCR) for the revised individual measurement control chart (I-Chart) of each attribute
for the three substrates.
The revised control limits (UCL
revised
and LCL
revised
) for the three attributes (SID, IFT,
IMPED) of the three substrates are displayed in Table 8. Table 9 shows the 3Ŝ
revised
of the
attributes computed from Table 8 by taking the average σ
revised
of the three substrates. The
LSL
final
and USL
final
of the attributes for the three substrates are then computed and
exhibited in Table 10.
Current Trends and Challenges in RFID
162
PET PVC Wet Strength Paper
LCL
revised
UCL
revised
LCL
revised
UCL
revised
LCL
revised
UCL
revised
SID 0.249
0.282
0.266
0.294
0.253
0.278
IFT 6.960
10.760
9.455
13.145
6.811
10.529
IMPED 23.080
32.300
25.624
26.080
22.100
32.760
Table 8. The revised control limits of the attributes for the substrates
3Ŝ
revised
SID
(3σ
revised_PET_SID
+3σ
revised_PVC_SID
+3σ
revised_wet_SID
) / 3
= (0.017 +0.014 +0.013) / 3
= 0.015
IFT
(3σ
revised_PET_IFT
+3σ
revised_PVC_IFT
+3σ
revised_wet_IFT
) / 3
= (1.900 + 1.845 +1.859) / 3
= 1.868
IMPED
(3σ
revised_PET_IMPED
+3σ
revised_PVC_IMPED
+3σ
revised_wet_IMPED
) / 3
= (4.610 + 0.228 + 5.330) / 3
= 3.389
Table 9. The 3Ŝ
revised
of the attributes computed from Table 8
PET PVC Wet Strength Paper
LSL
final
USL
final
LSL
final
USL
final
LSL
final
USL
final
SID 0.251 0.281 0.265 0.295 0.251 0.281
IFT 6.992 10.728 9.432 13.168 6.802 10.538
IMPED 24.301 31.079 22.463 29.241 24.041 30.819
Table 10. The LSL
final
and USL
final
of the attributes for the substrates
Capability analysis for solid ink density (SID)
The capability analyses of solid ink density for the substrates are exhibited in Figure 7,
Figure 8, and Figure 9. As shown in those figures, PVC has the highest relative PCR value
(Cp = 1.04), followed by the Wet Strength paper (Cp = 1.02), and PET (Cp = .95). Therefore,
this study concludes that the PVC and Wet Strength paper are barely acceptable substrates
for printing consistent ink density because their relative PCR are only slightly higher than
1.00. Figure 7 also implies that PET is not an acceptable substrate for printing consistent SID
for RFID tags due to the low Cp value (Cp = .95).
Key Factors Affecting the Performance of RFID Tag Antennas
163
Data
wet_IMPEDPVC_IMPEDPET_IMPED
31
30
29
28
27
26
25
Boxplot of PET_IMPED, PVC_IMPED, wet_IMPED
Fig. 6. Box plot of impedance readings for the three substrates
0.2760.2700.2640.2580.252
LSL USL
Process Data
Sample N 50
StDev (Within) 0.00525
StDev (O v erall) 0.00589
LSL 0.25100
Target *
USL 0.28100
Sample M ean 0.26560
Potential (Within) C apability
CCpk 0.95
O v erall C apability
Pp 0.85
PPL 0.83
PPU 0.87
Ppk
Cp
0.83
Cpm *
0.95
CPL 0.93
CPU 0.98
Cpk 0.93
Observed Performance
PPM < LSL 0.00
PPM > USL 0.00
PPM Total 0.00
Exp. Within Performance
PPM < LSL 2702.74
PPM > USL 1671.78
PPM Total 4374.52
Exp. O v erall P erformance
PPM < LSL 6582.74
PPM > U SL 4459.92
PPM Total 11042.67
Within
Overall
Process Capability of PET_SID
Fig. 7.