Recent Advances in Vibrations Analysis Part 5 pot
Bạn đang xem bản rút gọn của tài liệu. Xem và tải ngay bản đầy đủ của tài liệu tại đây (410.15 KB, 20 trang )
Second Order Shear Deformation Theory (SSDT)
for Free Vibration Analysis on a Functionally Graded Quadrangle Plate
69
case, there is insignificant difference between the result predicted by SSDT and TSDT; SSDT
slightly over predicts frequencies. It can be seen that there are good agreements between our
results and other results.
2p 3p
5p
Present
study
Ref.
[5]
Exact
[14]
Present
Study
Ref.
[5]
Exact
[14]
Present
Study
Ref.
[5]
Exact
[14]
0.2292 0.2188 0.2197 0.2306 0.2202 0.2211 0.2324 0.2215 0.2225
Table 2. Dimensionless fundamental frequency (
m
m
h
E
) of a simply supported square
(Al/Zro
2
) FG Plate, thickness-to-side is: /0.2ha
.
Material property
()EGpa
3
(/)K
g
m
SUS 304, Metal 201.04 8166 0.33
Aluminum, Metal 68.9 2700 0.33
Zirconia, Ceramic 211.0 4500 0.33
Si
3
N
4
, Ceramic 348.43 2370 0.24
Table 3. Properties of materials used in the numerical example.
6.2 Numerical example
For numerical illustration of the free vibration of a quadrangle FG plate with Zirconia and
silicon nitride as the upper-surface ceramic and aluminum and SUS 304 as the lower-surface
metal are considered the same as [10]:
6.2.1 Results and discussion for the first ten modes in quadrangular FG plates
In the following Tables, free vibrations are presented in dimensionless form for square and
rectangular FG plates.
Tables 4 and 5 show the dimensionless frequency in square (a=b) SUS 304/Si3N4, FG plates.
It can be noted that for the same values of grading index
P , the natural frequency increases
with increasing mode. The effect of grading index can be shown by comparing the
frequency value for the fixed value of mode and changing the values of grading index
p
. It
can be seen that, the frequency decreases with the increase of the grading index due to the
stiffness decreases from pure ceramic to pure metal.
Tables 6 and 7 show the dimensionless frequency in rectangular (b=2a) SUS 304/Si3N4, FG
plates. The effect of grading index can be shown by comparing the frequency for the same
value of mode and considering different values of grading index
p
as shown in Table 5. It is
clearly visible that the frequency decreases with the increasing grading index, caused by the
stiffness decreasing with increasing grading index. For the same value of
p
, it can be said
that the natural frequency increases with increasing mode. By comparing Tables 6, 7 and 4, 5
it can be observed that for the same values of grading index and mode, the fundamental
frequency in square FG plates are greater than those in rectangular FG plates and by
Recent Advances in Vibrations Analysis
70
mn
mode
0p
0.5p
1p
2p
4p
6p
8p
10p
1x1 1 5.76 3.904 3.393 3.027 2.795 2.697 2.638 2.597
1x2 2 13.846 9.366 8.139 7.259 6.700 6.464 6.323 6.227
2x1 3 13.846 9.366 8.139 7.259 6.700 6.464 6.323 6.227
2x2 4 21.353 14.441 12.547 11.187 10.321 9.957 9.741 9.593
2x3 5 32.859 22.220 19.305 17.203 15.863 15.300 14.967 14.741
3x2 6 32.859 22.220 19.305 17.203 15.863 15.300 14.967 14.741
3x3 7 43.369 29.323 25.472 22.689 20.911 20.167 19.729 19.431
3x4 8 56.798 38.405 33.362 29.703 27.356 26.377 25.801 25.412
4x3 9 56.798 38.405 33.362 29.703 27.356 26.377 25.801 25.412
4x4 10 69.054 46.690 40.555 36.091 33.221 32.026
Table 4. Variation of the frequency parameter (
2
//
cc
ah E
) with the grading index
(
p
) for square.
34
304 /SUS Si N FG square plates ( /10,ah ab
).
mn
mode
0p
0.5p
1p
2p
4p
6p
8p
. 10p .
1x1 1 5.338 3.610 3.137 2.796 2.580 2.489 2.435 2.398
1x2 2 11.836 8.003 6.953 6.193 5.706 5.502 5.382 5.301
2x1 3 11.836 8.003 6.953 6.193 5.706 5.502 5.382 5.301
2x2 4 17.263 11.672 10.138 9.022 8.305 8.006 7.831 7.714
2x3 5 24.881 16.828 14.621 13.002 11.950 11.513 11.258 11.089
3x2 6 24.881 16.828 14.621 13.002 11.950 11.513 11.258 11.089
3x3 7 31.354 21.209 18.426 16.375 15.0343 14.477 14.156 13.943
3x4 8 39.180 26.508 23.041 20.471 18.770 18.062 17.656 17.388
4x3 9 39.180 26.508 23.041 20.471 18.770 18.062 17.656 17.388
4x4 10 46.020 31.141 27.067 24.036 22.020 21.181
Table 5. Variation of the frequency parameter (
cc
ah E
2
//
) with the grading index
(
p
) for
SUS Si N
34
304 /
FG square plates (
ah ab/5,
).
mn
mode
0p
0.5p
1p
. 2p
. 4p
6p
8p
10p
1x1 1 3.461 2.341 2.034 1.814 1.674 1.616 1.580 1.556
1x2 2 5.338 3.610 3.137 2.796 2.580 2.489 2.435 2.39
2x1 3 10.334 6.984 6.065 5.402 4.980 4.804 4.700
2x2 4 11.836 8.00 6.948 6.188 5.702 5.499 5.380 5.300
2x3 5 14.199 9.599 8.337 7.422 6.836 6.592 6.449 6.552
3x2 6 20.484 13.845 12.020 10.689 9.835 9.482 9.276 9.139
3x3 7 22.373 15.125 13.133 11.678 10.740 10.352 10.126 9.976
3x4 8 24.881 16.824 14.611 12.989 11.940 11.505 11.254 11.085
4x3 9 31.656 21.409 18.585 16.506 15.157 14.602 14.282 14.071
4x4 10 33.715 22.805 19.802 17.587 16.142 15.547
Table 6. Variation of the frequency parameter (
2
//
cc
ah E
) with the grading index
(
p
) for
34
304 /SUS Si N FG rectangular plate ( ah a b/5,0.5
).
Second Order Shear Deformation Theory (SSDT)
for Free Vibration Analysis on a Functionally Graded Quadrangle Plate
71
mn
mode
0p
0.5p
1p
2p
4p
6p
8p
10p
1x1 1 3.645 2.467 2.144 1.913 1.766 1.704 1.667 1.642
1x2 2 5.769 3.904 3.393 3.027 2.795 2.697 2.638 2.597
2x1 3 11.885 8.039 6.986 6.231 5.752 5.549 5.429 5.346
2x2 4 13.846 9.365 8.138 7.258 6.699 6.463 6.323 6.227
2x3 5 17.037 11.523 10.012 8.928 8.239 7.949 7.776 7.658
3x2 6 26.092 17.640 15.325 13.659 12.600 12.156 11.893 11.713
3x3 7 28.958 19.578 17.008 15.158 13.981 13.487 13.195 12.995
3x4 8 32.859 22.215 19.299 17.197 15.858 15.297 14.965 14.739
4x3 9 43.873 29.653 25.754 22.937 21.142 20.393 19.951 19.652
4x4 10 47.344 32.002 27.794 24.715 22.809 21.999
Table 7. Variation of the frequency parameter (
2
//
cc
ah E
) with the grading index
(
p
) for
34
304 /SUS Si N FG rectangular plate ( /10,0.5ah a b
).
increasing the side-to-thickness ratio, the frequency also increases. It is evident that the
grading index and side-to-thickness ratio effects in frequency are more significant than the
other conditions.
6.2.2 Results and discussion for the natural frequency in quadrangular FG (SUS
304/Si3N4) plates
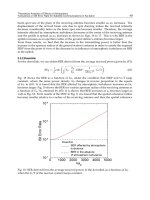
Figures (3) and (4) illustrate the dimensionless frequency versus grading index (
p
), for
different values of side-to-thickness ratio ( /
ah) and side-to-side ratio ( /ba), respectively.
In Figure 3, the effect of grading index (
p
) and side-to-thickness ratio ( /ah ) on
dimensionless fundamental frequency of FG (SUS 304/Si3N4) plate is shown. It can be seen
that the frequency decreases with increasing grading index, due to degradation of stiffness
by the metallic inclusion. It can be observed that the natural frequency is maximum for full-
ceramic (
0.0p ) and this value increases with the increase of the side-to-thickness ratio,
since the stiffness of thin plates is more effectively than the thick plates. It is seen that for the
values (
p
), for 02p
the slope is greater than other parts ( 2p ). It can be said that for
side-to-thickness ratios greater than twenty ( / 20
ah ), the frequencies will be similar for
different values of grading index. It can be noted that the difference between frequencies in
/5
ah and / 10ah
are greater than differences of frequency between / 10ah and
other curves for the same values of grading index
p
. And also it can be concluded that
for / 20
ah , the difference between the frequencies is small for the same value of grading
index.
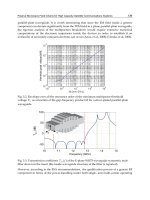
The effect of grading index (
p
) and side-to-side ratio ( /ba) on dimensionless fundamental
frequency of FG (SUS 304/Si3N4) plate can be seen in figure 4. It can be noted that the
frequency increases with the increase of the /
basince rectangular plates can be treated as a
one-dimensional problem for example, beams or plate strips. It can be observed that the
frequency is almost constant for different values of grading index.
Recent Advances in Vibrations Analysis
72
0 1 2 3 4 5 6 7 8 9 10
2
2.5
3
3.5
4
4.5
5
5.5
6
Grading index (p)
Dimensionless Fundamental Frequency
a/h=5
a/h=10
a/h=15
a/h=30
a/h=50
a/h=80
a/h=100
a=b
Fig. 3. Dimensionless frequency (
2
//
cc
ah E
) versus grading index (
p
) for
different values of side-to-thickness ratio (
/
ah
) in square (
ba) FG (SUS Si N
34
304 / )
plates.
0 1 2 3 4 5 6 7 8 9 10
0
10
20
30
40
50
60
Grading index (p)
Dimemsionless Fundamental Frequency
b/a=0.2
b/a=0.5
b/a=0.75
b/a=1
b/a=1.25
b/a=1.5
b/a=2
a/h=10
Fig. 4. Dimensionless frequency (
2
//
cc
ah E
) versus grading index (
p
) for
different values of side-to-side ratio ( /
ba) FG (
34
304 /SUS Si N ) plates when / 10.0ah
Second Order Shear Deformation Theory (SSDT)
for Free Vibration Analysis on a Functionally Graded Quadrangle Plate
73
Figures (5) and (6) show variation of dimensionless fundamental frequency of FG (SUS
304/Si3N4) plate with side-to-thickness ratio ( /
ah), for different values of grading index
(
p
) and side-to side ratio ( /ba), respectively.
It is seen from figure 5, the fundamental frequency increases with the increase of the value
of side-to-thickness ratio ( /
ah). It is shown that the frequency decreases with the increase
of the values of side-to-side ( /
ba). It can be noted that the slope of frequency versus side-
to-thickness ratio ( /
ah) for part 5 / 10ah
is greater than those in another part
(/ 10
ah ).
5 10 15 20 25 30 35 40 45 50
1
2
3
4
5
6
7
8
Side-to-thickness ratio (a/h)
Dimensionless Fundamental Frequency
b/a=0.5
b/a=1
b/a=2
b/a=5
b/a=10
b/a=20
p=5
Fig. 5. Dimensionless frequency (
2
//
cc
ah E
) versus side-to-thickness ratio
(
/
ah
)for different values of side-to-side ratio (
/
ba
) FG (
34
304 /SUS Si N ) plates
when
5p .
Recent Advances in Vibrations Analysis
74
10 20 30 40 50 60 70 80
2
2.5
3
3.5
4
4.5
5
5.5
6
Side-to-Thicness ratio (a/h)
Dimensionless Fundamental Frequency
Full Ceramic
p=0.2
p=0.5
p=0.8
p=1
p=2
p=8
p=30
p=150
Full Metal
a=b
Fig. 6. Dimensionless frequency (
2
//
cc
ah E
) versus side-to-thickness ratio ( /ah)
for different values of grading index (
p
) in square ( ba
) FG (
34
304 /SUS Si N ) plates.
The variation of frequency with side-to-thickness ratio ( /
ah) for different values of grading
index (
p
) is presented in Figure 6. As expected, by increasing the value of grading index
(
p
) the values of frequency decrease due to the decrease in stiffness. Similarly, in figure (5)
while the 5 / 10
ah, the slope is greater than another ratios. It can be noted that for the
values of grading index
30p , the results for frequency are similar.
Figures 7 and 8 present the variation of dimensionless frequency of FG (SUS 304/Si3N4)
plate versus side-to-side ratio
(/)ba for different values of grading index()
p
and side-to-
thickness ratio
(/)ah, respectively.
Second Order Shear Deformation Theory (SSDT)
for Free Vibration Analysis on a Functionally Graded Quadrangle Plate
75
1 1.5 2 2.5 3 3.5 4
1
1.5
2
2.5
3
3.5
4
4.5
Side-to-Side ratio (b/a)
Dimensionless Fundamental Frequency
p=0.5
p=1
p=2
p=6
p=15
p=25
p=50
p=150
p=250
a/h=100
Fig. 7. Dimensionless frequency (
2
//
cc
ah E
) versus side-to-side ratio ( ba ) for
different values of grading index (
p ) FG (
34
304 /SUS Si N ) plates when
/100
ah
.
1 1.5 2 2.5 3 3.5 4
1.4
1.6
1.8
2
2.2
2.4
2.6
2.8
3
Side-to-Side ratio (b/a)
Dimensionless Fundamental Frequency
a/h=5
a/h=10
a/h=15
a/h=25
a/h=50
a/h=80
a/h=150
p=5
Fig. 8. Dimensionless frequency (
2
//
cc
ah E
) versus side-to-side ratio ( /ba) for
different values of side-to-thickness ratio ( /
ah) FG (
34
304 /SUS Si N ) plates when 5p .
Recent Advances in Vibrations Analysis
76
In figure 7, it is shown that the frequency decreases with the increase of the value of side-to-
side ratio
(/)ba for all values of grading index ()
p
. It is seen that the frequencies for FG
quadrangular plates are between that of a full-ceramic plate and full-metal plate. As
expected the frequencies in a full-ceramic plate are greater than those in a full-metal plate.
The results for dimensionless frequency versus side-to-side ratio
(/)bafor different values
of side-to-thickness ratio
(/)ahin FG plate while grading index 5p
are shown in figure 8.
It is seen that by increasing the value of /
ba, the frequency decreases for all values of /ah.
It can be noted for / 10
ah the results are similar.
7. Conclusions
In this chapter, free vibration of FG quadrangular plates were investigated thoroughly by
adopting Second order Shear Deformation Theory (SSDT). It was assumed that the elastic
properties of a FG quadrangular plate varied along its thickness according to a power law
distribution. Zirconia and Si3N4 were considered as a ceramic in the upper surface while
aluminum and SUS304 were considered as metals for the lower surface. The complete
equations of motion were presented using Hamilton’s principle. The equations were solved
by using Navier’s Method for simply supported FG plates.
Some general observations of this study can be deduced here:
The decreasing slope of the fundamental frequency for 02p
, is greater than another
part (
2p ) for all values of side-to-thickness ratio(/)ah in square FG plate.
It was found that the fundamental frequency of the FG plate increases with the increase
of the value of side-to-side ratio ( /
ba).
For FG plates, the slope of increasing frequency versus side-to-thickness (/)ah when
5/10
ah is greater than another part (/ 10)ah for any value of grading index
and side-to-side ratio.
The fundamental frequency versus side-to-side ratio ( /ba) for FG quadrangular plates
are between those of a full-ceramic plate and full-metal plate when / 10
ah
.
From the numerical results presented here, it can be proposed that the gradations of the
constitutive components are the significant parameter in the frequency of quadrangular FG
plates.
8. Acknowledgement
The authors would like to thank Universiti Putra Malaysia for providing the research grant
(FRGS 07-10-07-398SFR 5523398) for this research work.
9. References
[1] Reddy JN. Analysis of functionally graded plates. Int. J. Numer Meth Eng
2000;47:663-684.
[2]
Suresh S, Mortensen A. Fundamentals of functionally graded materials. London: IOM
Communications Limited, 1998.
[3]
Praveen GN, Reddy JN. Nonlinear transient thermoelastic analysis of functionally
graded ceramic-metal plates. Int. J. Solids Struct 1998;35(33):4457-4476.
Second Order Shear Deformation Theory (SSDT)
for Free Vibration Analysis on a Functionally Graded Quadrangle Plate
77
[4] Ng TY, Lam KY, Liew KM. Effects of FGM materials on the parametric resonance of
plate structure. Comput. Meth Appl. Mech. Eng 2000;190:953-962.
[5]
Ferreira AJM, Batra RC, Roque CMC, Qian LF, Jorge RMN. Natural frequencies of
functionally graded plates by a meshless method. Comp Struct 2006;75:593–600.
[6]
Woo J, Meguid SA, Ong LS. Nonlinear free vibration behavior of functionally graded
plates. J. Sound Vibr 2006;289:595–611.
[7]
Zhao X, Lee YY, Liew KM. Free vibration analysis of functionally graded plates using
the element-free kp-Ritz method. J. Sound Vibr 2008.
[8]
Batra RC, Jin J. Natural frequencies of a functionally graded anisotropic rectangular
plate. J. Sound Vibr 2005;282:509–516.
[9]
Batra RC, Aimmanee S. Vibrations of thick isotropic plates with higher order shear and
normal deformable plate theories. Comput Struct 2005;83:934–955.
[10]
Bayat M, Saleem M, Sahari BB, Hamouda AMS, Mahdi E. Thermo elastic analysis of a
functionally graded rotating disk with small and large deflections. Thin-Walled
Struct 2007;45:677–691.
[11]
Bayat M, Sahari BB, Saleem M, Ali A, Wong SV. Thermo elastic solution of a
functionally graded variable thickness rotating disk with bending based on the
first-order shear deformation theory. Thin-Walled Struct 2008.
[12]
Heidary F, M. Reza Eslami MR. Piezo-control of forced vibrations of a thermoelastic
composite plate. Comp Struct 2006;74(1):99-105
[13]
Cheng ZQ, Batra RC. 2000, exact correspondence between eigenvalue of membranes
and functionally graded simply supported polygonal plates. J. Sound Vibr
2000;229(4):879-895.
[14]
Vel SS, Batra RC. Three-dimensional exact solution for the vibration of functionally
graded rectangular plates. J. Sound Vibr 2004;272: 703-30.
[15]
Huang XL, Shen H. Nonlinear vibration and dynamic response of functionally graded
plates in thermal environments. Int J. Solids Struct 2004;41:2403–2427.
[16]
Ferreira AJM., Batra RC, Roque CMC, Qian LF, Martins PALS. Static analysis of
functionally graded plates using third-order shear deformation theory and
meshless method. Comp Struct 2005;69:449–457.
[17]
Khdeir AA, Reddy JN. Free vibrations of laminated composite plates using second-
order shear deformation theory. Comp Struct 1999;71:617-626.
[18]
Bahtui A, Eslami MR. Coupled thermoelasticity of functionally graded cylindrical
shells. Mech Res Commun 2007; 34(1):1-18.
[19]
Reddy JN. Theory and Analysis of Elastic Plates and Shells. New York: CRC Press;
2007.
[20]
Stoffel, M. (2005). Experimental validation of simulated plate deformations caused by
shock waves, Math. Mech., 85(9):643 – 659.
[21]
Saidi Ali Reza, Sahraee Shahab, (2006). Axisymmetric solutions of functionally graded
circular and annular plates using second-order shear deformation plate theory,
ESDA2006-95699, 8th Biennial ASME Conference on Engineering Systems Design
and Analysis, Torino, Italy.
Recent Advances in Vibrations Analysis
78
[22] Librescu,L., Khdeir, A.A., Reddy, J.N. (1987). Comprehensive Analysis of the State of
Stressof Elastic Anisotropie Flat Plates Using Refined Theories,
Acta Mechanica,
70:57-81.
[23]
Librescu, L., Schmidt, R. (1988).Refined Theories of Elastic Anisotropic Shell
Accounting for Small Strain and Moderate Rotations, Int. J. Non-Linear Mechanics,
23(3):217-229.
Part 2
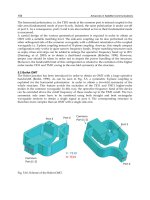
Vibrations Analysis for Machine Maintenance
5
Maintenance of Reducers with an
Unbalanced Load Through Vibration
and Oil Analysis Predictive Techniques
Aparecido Carlos Gonçalves, Daniel Fabiano Lago and
Maria da Consolação Fonseca de Albuquerque
University of State of Sao Paulo, College of Engineering of Ilha Solteira,
Department of Mechanical Engineering
Brazil
1. Introduction
Among the techniques for Predicitive Maintenance of Reducers, the most used are the oil
analysis and vibration analysis, and the simultaneous use of both of these provides accurate
results about the condition of a system under test.
The principle of the vibration analysis is based on the idea that the structures of the
machines excited by the dynamic efforts (power action) give vibrational signs, whose
frequency is equal to the frequency of the exciting agents. An imbalance in a machine
component will cause increased vibration, once it causes an imbalance in the system and
consequent increase in the power. Thus, observing the progression of the level of vibration,
it is possible to obtain information on the state of the machine (Gonçalves and Campos-
Silva, 2011).
The oil analysis enables identifying the first signs of wear of a component. The identification
begins with studying the amount of particles, size, shape and composition, which provide
accurate information on the conditions of the moving surfaces without having to
disassemble the entire set that these parties belong to. These solid particles are generated by
the dynamic friction between the parts in contact. According to the study of these particles
the wear situations of the set can be related and attributed to physical and chemical
conditions, (Barraclough et al, 1999), (Anderson et al, 1999). The oil analysis is achieved
through laboratory techniques involving, reagents, instruments and equipment
2.
Analysis of the lubricants
The lubrication is introduced between two sliding solids by the addition of a lubricant at the
interface, in order to reduce friction and wear, remove heat and particles generated by the
contact.
Normally, the lubricants are liquids, but can also be solid, and pasty and gaseous, according
to its physical state. Liquid lubricants are characterized by their liquid viscosity, but other
properties are also important. Lubricating oils have names designating these properties.
This type of lubricant can be subdivided into: mineral oils, fatty oils, composite oil,
aditivated oils and synthetic oils
Recent Advances in Vibrations Analysis
82
2.1 Viscosity
Viscosity is the most important property of lubricating oils and essentially it can be defined
as the flow resistance that fluids present. It is defined as the shear stress in a plane of the
fluid per unit of normal velocity gradient to the plane. Viscosity can be expressed in terms of
kinematical viscosity (mm
2
/s or cSt) or absolute viscosity (dynamics) whose unit is the Pa.s.
Hutchings (1992) defines the Newtonian viscosity of fluids, in terms of shear deformation
by:
t
(1)
= shear stress [Pa],
= dynamic viscosity [Pa.s],
t
= shear deformation rate
The kinematical viscosity Z is defined according to Equation 2.
Z
(2)
Where:
Z = viscosity in cSt or mm
2
/s;
= specific mass.
2.2 Viscosity monitoring
Monitoring viscosity is an important component of many programs for the analysis of oil.
Even small changes in viscosity can cause major damage to the lubrication. The Limits of
typical industrial oils are set at 5% for precaution, and 10% for critical situations, although
applications at high loads and extremely critical systems should also have an alarm system
(POA, 2002).
Significant reduction of viscosity Significant increasing of viscosity
• Loss of the oil film causing excessive
wear;
• Increase of mechanical friction causing
excessive consumption of energy;
• Generation of heat due to mechanical
friction;
• Internal or external leaks;
• Increased sensitivity for contamination
of particle due to the reduction of the oil
film;
• Failure of oil film for high temperatures,
high loads or during starting and
stopping.
• Excessive generation of heat resulting in
the oxidation of oil, sludge and
development of varnish;
• Gaseous cavitation due to inadequate flow
of oil to pumps and bearings;
• Lack of lubrication due to inadequate oil
flow;
• Oil whipping in the radial bearing;
• Excessive consumption of energy to
overcome the friction of fluid;
• Poor demulsibility;
• Weak pumping during cold starting.
Table 1. Depicts the effects of using a lubricant with inappropriate viscosity.
Maintenance of Reducers with
an Unbalanced Load Through Vibration and Oil Analysis Predictive Techniques
83
When a significant change in viscosity is observed, the root cause of the problem should
always be investigated and corrected. Changes in the viscosity can result from a change in
the basic chemistry of the oil (a change in the molecular structure of the oil), or due to
ingression of contaminants. Change in viscosity requires additional testing, such as: number
of acids (AN) and infrared spectroscopy with the Fourier transform (FTIR) to confirm the
incipient oxidation; contaminant tests to identify the presence of water or soot, or another
less commonly used assay, which is the gas chromatography test (GC) to identify any
changes in the basic chemistry of the oil.
2.3 Wear in lubricated system
Wear can be defined as a progressive loss of material, as a result of mechanical interaction
between two surfaces in contact, lubricated or not. In general these areas are in relative
movement (sliding or slipping) and with applied loads.
Various authors characterize wear mechanisms differently but, according to the Modern
Tribology Handbook (2001) there are 4 main forms of wear: adhesive, abrasive, corrosive
and by fatigue, as well as some sideline cases often classified as wear forms. Oxidation,
erosion, erosion by cavitation and impact, are sometimes classified as types of wear,
although Rabinowicz (1995) finds that in fact none of them are forms of wear.
These four types of damage are shown in Figure 1.
Fig. 1. Schematic Figures of four types of wear (Kato and Adashi, 2001).
These types of wear will provide precise information during the lubricant’s analysis, as the
particles generated mix with this analyzed lubricant.
2.4 Physical tests
The most common physical tests used with spectrographic programs and analysis programs
of wear metals are: viscosity, total acid number (TAN) and determination of the water rate.
The method ASTM D445 is used for identification of viscosity, the method ASTM D 974 or D
664 is to determine the total number of acids and ASTM D 1744 to determine the water
concentration by titration( Gonçalves, Padovese, 2010).
In cases where the water is at levels above 0.05 vol.%, infrared spectrography can be used.
Although the limits of control for each of these parameters need to be adjusted depending
on the type of lubricant and equipment, variations in viscosity of ± 10%, TAN greater than 3
mg/g, and water exceeding 100 to 500 ppm are usually sufficient for an intervention or at
least for further investigation.
Recent Advances in Vibrations Analysis
84
2.5 Spectrographic analysis of metals
The spectrographic methods include atomic absorption (AA), atomic emission
spectrography (AES), inductive coupled plasma emission spectroscopy (ICPE), and X ray
fluorescence (XRF). Of these methods, AES and ICPE, which are based on the detection of
light emitted by the elements, are the most popular because of cost, speed, and other factors
(Kimura and Gonçalves, 2009).
The spectrographic analysis of metals determines the concentration of metals and particles
of up to 10 microns in size, such as moderate wear (benign sliding) and the advanced stages
of fatigue, since in these wear modalities the predominant distribution of particles is within
the detectable scale (<10 microns).
2.6 Particle count
The particle count is the monitoring of the number of particles of a given size by fluid
volume, it is used as a preliminary monitoring tool combined with other analytical methods.
The counting of particles and direct reading ferrography of direct-reading detect the onset of
severe wear with a rapid increase in the quantity and size of the particles. The counting of
particles detects all the particles, given that the direct reading ferrography indicates only
particles of ferrous wear.
Many sensitive optical instruments are used in the counting of the number of particles in
different size ranges. This counting informs the number of particles larger than a given size
found in a specified volume of fluid.
For the counting of particles the standard SAE AS 4059, NAS 1638 (National Aerospace
Agency), or ISO can be used (Gonçalves and Padovese, 2010).
The ISO 4406 norm (International Standard Organization) is the most widely used. Most of
the versions commonly used of this technical standard refer to the number of particles larger
than 4, 6, and 14 micrometers in 1 ml of fluid. The number of particles 4+ and 6+ are used as
a particles point of reference. The 14+ size indicates the amount of large particles present,
which contribute greatly to the possible catastrophic failure of the machine.
Figure 2 and Table 2 below represent a measurement example, where the result is obtained
by an ISO code. Table 2.6 shows the various numbers of ISO 4406 code.
Fig. 2. Example of an obtained ISO Code, (Parker Catalog, 2000).
Maintenance of Reducers with
an Unbalanced Load Through Vibration and Oil Analysis Predictive Techniques
85
Range Number Micron Actual particle
Count range (por ml)
18 4+ 1,300 – 2,500
16 6+ 320 – 640
13 14+ 40 - 80
Table 2. Classification and definition by ISO (Parker Catalog,2000).
2.7 Ferrography
The ferrographic techniques are divided into two levels of analysis. A quantitative one,
which is an evaluation technique of the wear conditions of the components of a machine, by
quantifying the particles in suspension in the lubricant, and an analytical one, which uses
the observation of particles in suspension in the lubricant.
The analytical ferrography is also known as direct reading ferrography. This one measures
the concentration of ferrous particles in a fluid sample. With this technique one can get
information on the degree of severity of wear in the machine under analysis.
To establish exact guidelines for the oil condition, samples are regularly taken from carefully
selected positions of the machine system, preferably during normal operation (Lockwood
and Dalley, 1992). In the ferrographic examination of direct reading the optical density is
used to quantitatively measure the concentration of the wear particles in lubricating oil or in
a hydraulic fluid. The particles are classified according to their sizes in DL (large particles,
larger than 5 mm) (large particles), and DS (small particles, smaller than 5mm) (small
particles). The wear particle concentration (WPC) and the percentage of large particles (PLP)
are derived like this.
The following are equations to calculate the WPC and PBP:
WPC = DL+DS (3)
PLP = [(DL - DS) / (DL + DS)] * 100 (4)
The RPD (rotary particle depositor) is a type of device for direct ferrography where an index
that represents the magnetic density in a given volume of lubricant is measured.
When the quantitative ferrography indicates an abnormal wear tendency, the analytical
ferrographic techniques can be used to specifically identify the nature of the machine’s
potential problems. This enables a thorough study of particles whose size is between 1 and
250 μm (Arato, 2004). A ferrogram is built and then it can be analyzed aided by optical and
electron microscopy, identifying the morphology of the particles, hence identifying any
anomaly.
The ferrograms consist of transparent slides where the magnetic particles are deposited,
they are separated by sizes by means of a magnetic field, other particles are randomly
placed in the "barriers" formed by magnetic particles.
A first type of ferrogram is obtained by passing a flow of diluted lubricant on a plaque by
gravity (the plaque is inclined). The plaque is placed on a magnet that attracts the ferrous
particles and allows its adherence to the plaque, as illustrated in Figure 3.
Due to the magnetic field the particles are lined up in horizontal chains along the plaque, the
larger particles are deposited first and there is a size decrease along the plaque. The non-
ferrous particles are randomly placed throughout the plaque. The absence of ferrous
particles actually reduces the efficiency of the analysis of non-ferrous particles.
Recent Advances in Vibrations Analysis
86
Fig. 3. Obtaining the ferrogram.
3. Analysis of vibrations
Vibration analysis is based on the idea that machine structures, excited by dynamics efforts,
give vibratory signs whose frequency is identical to those of the efforts that provoked them;
and the global measure in some point is the sum of vibratory answers of the structure to the
different excitator efforts (Wang and Willing, 1995).
It is possible, with captors placed in private points, to register the transmitted vibration to
the machine by the structures, and with its analysis, to identify the origin of the efforts
which it is submitted. Vibration monitoring provides information about the macroscopic
behavior inside the machine ( Diana and Chelif, 2005).
In that way, as soon as it is obtained, the “vibration signature” of the machine when it is
new or reputed as in good state, it will be possible for comparison , to appreciate the
evolution of its state and to identify the appearance of new dynamic efforts, serial to a
degradation in development process (Azoutsev, 1998).
The measure of a vibration transmitted by a structure under the effect of dynamic efforts
will be function of multiple parameters:
a. Mass, rigidity and damper coefficient of the structure that transmits the vibrations;
b. Characteristics of machine fixation on the ground that opposes reactions to vibrations
and modifies the intensity;
c. Position of measure point;
d. Position and fixation of the sensor (captor) on the machine;
e. Characteristic of sensor;
f. Pre amplification and transmission of the sign;
g. Performance of analyzed apparels;
h. Rotation and absorbed potency;
i. State of the connection of the cinematic chain (alignment, balancement, engagements,
rolling, etc);
In a spectrum all the components of a vibratory level are represented under the form of
“picks” and it can follow individually a variation of amplitude, without the masking effect
that occurs in a global measure. Figure 4 shows an example of a spectrum.
Maintenance of Reducers with
an Unbalanced Load Through Vibration and Oil Analysis Predictive Techniques
87
Fig. 4. Typical example of a roller bearing with problem (Mirshawaka, 1991).
The measure of the global value is an approximate analysis method of the sign that makes
abstractions of the frequential parameters, expressing the evaluated amplitude in different
ways. That takes into account:
a. The pick to pick value. It is measured the maximum amplitude of the fundamental
wave that is useful, for example, when the vibratory displacement of a machine is
critical in relation to restrictions of maximum load or clearance;
b. Crest value (or pick value). It is an important measure to indicate, for example, the level
of a shock of short duration; and
c. Effective value. Measurement that takes into account the evaluation of the value of
harmonic components directly related to the vibration energy content.
From the analysis of vibration signals it is possible to make decisions whether or not to
intervene in the operation of the machine, so that it can be "available" as much as possible,
reducing maintenance costs, time-stop of the machine, reducing the stock and improving
safety, among others.
Thus, it is possible from the vibration signs at certain points of the equipment, to identify the
emergence of new dynamic efforts or the abrupt increase of the magnitude of the response,
which are indicators of the appearance of defects or deterioration of the operation.
Vibration data can be measured with accelerometers and processed by a signal analyzer.
The signal can be analyzed in the time domain or in the frequency.
3.1 Description of time domain
A vibration signal can be presented by constructing a graph for magnitude values of the
signal as a function of time, from a given moment regarded as zero time. The vibration
magnitude can be represented by acceleration, velocity or movement.
The wave forms are analyzed by comparison with the wave forms previously collected, and
observed by repetitive impulses that can report the frequencies of the bearings, the gears or
other components. In Figure 5, the vibration signal caused by imbalance is the dominant
signal. It has high magnitude when compared with the defects of bearing or gears. For this
reason, the lower magnitude of the wave form is superimposed on the waves caused by
imbalance (Green, 2003).
The vibration elements can be divided depending on the period of repetition, finite or
infinitely long, in: periodic vibrations, random vibrations and transient vibrations.
Periodic Vibrations - Vibrations that are repeated according to a given period of time.
Random Vibrations - Vibrations that are unpredictable as to its instant value, for any
future moment.
Recent Advances in Vibrations Analysis
88
Transitional Vibrations - Vibrations that exist only in a limited space in time, and null at
any other time.
Fig. 5. Vibration Signal in time domain (Arato,2004).
3.2 Description of the frequency domain
The fast Fourier transform (FFT) can derive a wave form in time and present it in the
frequency domain as shown in Figure 6. This process is the breaking of all vibrational
signals into individual components of the vibration signal and plotting it in a frequency
scale. This signal in the frequency domain is called frequency spectrum and provides
valuable information about the condition of a machine.
Fig. 6. Vibratory Signal in the frequency domain(Green, 2003)
The frequency spectra are used to obtain information that help determine the location of the
problem, the cause of the problem and the time for the problem to become critical. This
depends on the type of machine and is always relative to the level of vibration of the
machine’s proper operation. The frequency at which the vibration occurs indicates the type
of failure and it provides an indication of what is causing the failure.
In FFT transformation, a small section is extracted from the time signal (the so-called time
window) and the frequency spectrum is calculated using the FFT algorithm. During this