Recent Advances in Vibrations Analysis Part 8 pptx
Bạn đang xem bản rút gọn của tài liệu. Xem và tải ngay bản đầy đủ của tài liệu tại đây (3.15 MB, 20 trang )
Measurement of Satellite Solar Array Panel Vibrations
Caused by Thermal Snap and Gas Jet Thruster Firing
129
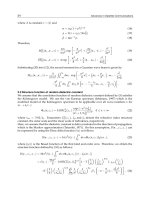
Reflective marker
Fig. 8. Image of the solar array paddle taken by the test bed
4.1 Calibration of camera parameters
Since the CMOS camera optical lens system is usually simple, the images taken always
include distortion, which must be corrected. Image data processing, such as searching the
visual marker, is based on MVTech’s HALCON system.
The camera parameters are necessary to obtain the marker position by image processing and
include internal and external camera parameters. The internal camera parameter comprises
eight items of Focus, Kappa, Sx, Sy, Cx, Cy, Image width and Image height. Focus is the
focal length of the lens. Kappa is the distortion coefficient of the lens. Sx and Sy are the
distances between the cells. Cx and Cy are coordinates at the distortion centre. The external
camera parameter shows the relation between the measurement plane and the camera
(position and orientation). This camera parameter can be easily obtained by using the
camera calibration program installed in HALCON.
Fig. 9 shows the standard calibration table of HALCON, which is used for its calibration.
Since the black spot of the standard calibration table interval is already known, the camera
parameter can be obtained by taking a photograph of the standard calibration plate.
Fig. 10 shows the image of the calibration. A standard calibration table is taken of a
photograph 20 times while changing the relation of the camera (position and orientation).
Afterwards, the standard calibration table is set up in the measurement plane, and a
photograph is taken. The internal and external camera parameters were calculated using
these 21 images.
Fig. 9. Calibration table
Recent Advances in Vibrations Analysis
130
Solar array panel
Camera
Standard calibration table
Fig. 10. Calibration method using a standard calibration table
4.2 Development of the image processing algorithm
Fig. 11 is the flow chart used to obtain the position of the marker from the image. Initially,
the image is converted into gray scale, whereupon the marker candidate area is searched for,
using the entire image. The edge extraction processing is then performed in the marker
candidate area, with the marker and noise distinguished by the length, size, and circularity
of the extracted edge. If the number of edges that remove the noise is two, the edges are
considered markers. Subsequently, the centre of the marker is obtained in the image
coordinate system [Row, Column] (pixel) and converted into a world coordinate system [X,
Y] (mm) by the camera parameter. The distance between the two markers is calculated, and
the correctness of the value is determined. When the image processing is not the first frame,
the distance the marker has moved from the previous frame is calculated. If this numerical
result is correct, the image processing is considered a success. When this happens, the
surround of the marker position of the present frame is assumed to be a marker candidate
area of the following frame.
Fig. 12 is the image processing result. The marker to the left of the screen is called No. 0 and
the other marker is called No. 1. This figure shows successful marker extraction through image
processing, with Fig. 13 a transition of the distance between the two markers. The accuracy of
the image processing can be shown by the size of the change of the distance between the two
markers, hence the standard deviation of the distance between markers was assumed to
represent the image processing accuracy. In the ground experiment, this value was about 0.99
mm, which corresponds to about 1/5 of the resolution. This result shows that image
processing, the accuracy of which exceeds the image resolution, is realized on the ground.
4.3 Adjusting the algorithm for edge extraction
Edge extraction is applied to find markers in our algorithm. One problem when measuring
thermal snap, however, is that the lighting condition changes dramatically during the
measurement. One kind of algorithm for finding markers should be used under every
lighting condition. To resolve this problem, the image processing algorithm is adjusted to
use the same algorithm in both sunshine and eclipse. Subsequently, the algorithm is
upgraded to enable markers not only when the satellite is in the umbra but also when it is in
the sunshine and penumbra, based on the algorithm for the inside of the eclipse. The
following are the contents of the upgrade of the algorithm.
Measurement of Satellite Solar Array Panel Vibrations
Caused by Thermal Snap and Gas Jet Thruster Firing
131
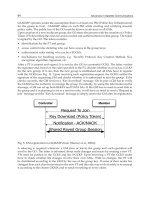
Fig. 11. Algorithm to find the marker in the images
Recent Advances in Vibrations Analysis
132
Fig. 12. The image processing result using the ground-based test model
807
808
809
810
811
812
813
814
815
0 50 100 150 200 250 300
The distance of two markers [mm]
Number of frames
Fig. 13. Transition of the distance between two markers on the ground
4.3.1 Detecting the marker candidate area
Many lighting points have equivalent size and shape when compared to actual markers in
the sunshine and penumbra. Therefore, when the analysis starts, the marker candidate area
is specified manually in the new algorithm. Subsequently, if the image processing is
successful, the marker candidate area in the next frame is specified at near the current
marker candidate area.
4.3.2 Determining the threshold for finding markers
The thresholds for finding markers change depending on the luminance of the marker
candidate area in the upgraded algorithm, since this changes around the time when the
satellite goes into eclipse.
4.3.3 Parameter for distinguishing the marker and noise
The conditions for distinguishing the marker and noise, for example, the size and circularity
of the extracted edges, are relaxed. This is because a true marker is often mistakenly
distinguished as noise if the thresholds for finding markers are changed.
Measurement of Satellite Solar Array Panel Vibrations
Caused by Thermal Snap and Gas Jet Thruster Firing
133
4.3.4 Specifying the marker candidate area in the next frame
The marker candidate area in the next frame is distinguished as 20 pixels of the area which
surrounds the marker in the current frame. The bright solar panel surface is located near the
markers when GOSAT is in sunshine. Therefore, if the marker candidate area is too large, a
light point on the solar panel may be distinguished as a true marker by mistake. The marker
candidate area in the next frame is set up as 13 pixels in the upgraded algorithm.
4.4 Examples of image processing results in orbit
Fig. 14 shows enlarged views of the extracted markers, the edges of which are shown here as
yellow lines. The paddle and markers are effectively distinguished in all cases of sunshine,
penumbra, and umbra.
Fig. 14. Results of extracted edges (Left: Sunshine, Centre: Penumbra, Right: Umbra)
5. Measurement and analysis result of vibration using jet thrusters
When a satellite changes its orbit to increase altitude, the installed gas jet thrusters are used,
and the solar array panel is subject to deformation or vibration. GOSAT has 20 newton (N)
jet thrusters, and a vibration measurement was conducted when they were used. This
measurement was conducted to check our measurement system before measuring thermal
snap.
5.1 Measurement condition
The measurement of the solar array paddle vibration caused by 20-N thrusters was
conducted during the orbital night, for a duration of about 600 seconds. Exposure of the
monitoring camera was set to auto, and the resolution of the taken images was set to SXGA
(1280 1024 pixels).
5.2 Calibration of the external camera parameters
Because the standard calibration table can be set up in the measurement plane, the external
camera parameters can be easily obtained in the ground experiment, but not by the method
in space. Therefore, the external camera parameters were obtained by using the image of
which the GOSAT satellite had taken a photograph while in orbit. The external camera
parameter is calculated from the installation position of the camera and the initial marker
Recent Advances in Vibrations Analysis
134
and is assumed to be temporary in nature. This temporary external camera parameter is
corrected by the image of which the GOSAT satellite took a photograph while in orbit. First,
the marker position is obtained in the image coordinate system [Row, Colum] (pixel).
Subsequently, two restraint conditions are imposed on the obtained marker position [Row,
Column] (pixel). One is that the distance between the markers be constant. Another is that
all markers exist in the X-Y plane in the world coordinate system. The external camera
parameter is corrected on the restraint condition.
5.3 Evaluation of measurement accuracy based on the distance between two markers
The internal camera parameter was obtained by a prelaunch ground experiment, while the
external camera parameter was obtained by the method shown in 5.2. The algorithm shown
in 4.2 was used with these parameters for the image processing.
Fig. 15 shows the transition of the distance between markers on the orbit. The average
distance between markers was 2393.26 mm, and the standard deviation was 1.99 mm. The
design value of the distance between markers of the GOSAT satellite is 2394 ± 2mm. The
distance between markers as obtained from the image processing is within this range. The
measurement plane is at a position about 5.57 m from the camera, with a resolution of about
7.25 mm/pixel. Therefore, when the standard deviation is 1.99 mm, the image processing
accuracy is about 1/3.6 of the resolution.
This accuracy is about 1.5 times compared with the ground experiment result, and has
decreased, seemingly due to the darkness of the image. The image darkens when the
exposure is set to auto. In the ground experiment, the exposure was set to manual, and the
image was processed on the condition that the marker could be subject to clear visual
checks. Therefore, the image processing accuracy might improve if the exposure is
appropriately set.
Fig. 15. The transition of the distance between two markers during the 20-N maneuver
5.4 Measurement result of in-plane and out-plane deformations
To evaluate the structural feature of the GOSAT’s solar array paddle, vibration analyses are
conducted using the result of the image processing conducted when the 20-N thruster was
used. Three patterns of the solar array paddle’s vibration modes, namely out-of-plane, in-
plane, and twist, are considered. The transition of the marker position is written with the
Measurement of Satellite Solar Array Panel Vibrations
Caused by Thermal Snap and Gas Jet Thruster Firing
135
world coordinate system in Fig. 16, meaning the coordinate transformation from the world
coordinate system to the local coordinate system of the solar array paddle must be
conducted and the transition of the marker must be written with the solar array paddle’s
local coordinate system to measure the in-plane and out-of-plane vibration which occur on
the solar array paddle.
Fig. 17 shows the out-of-plane and in-plane vibration of the marker No. 0. When the 20-N
thruster is used, quasi-static deformation is induced while the in-plane and out-of-plane
vibration occur. After the 20-N thruster, while the quasi-static deformation reverts, the
vibrations continue.
The twist mode of the solar array paddle vibration can be observed based on the transition
of the rotation angle of two markers. However, no deformation and vibration are observed
from the transition of the rotation angle during the 20-N maneuver.
Fig. 16. The transition of the marker position as shown by the world coordinate frame
Fig. 17. Measurement result of marker No. 0
5.5 Vibration analysis
Figs. 18 and 19 shows the result of the fast Fourier transform analysis toward the solar array
paddle’s out-of-plane and in-plane vibration of the maker No. 0’s position following the 20-
Recent Advances in Vibrations Analysis
136
N thrust. They show that the out-of-plane vibration frequency is 0.215 Hz and the in-plane
one is 0.459 Hz. Besides, both markers’ in-plane oscillations are in the same phase, meaning
no vibration mode, e.g. bending of the solar array panel in the direction of the panel width,
occurs.
Based on the results of the fast Fourier transform analyses, 2 patterns of vibration modes can
be estimated. Fig. 20 shows the estimated 2 vibration modes of the solar array paddle. The
first vibration mode is the first order of the out-of-plane vibration, which is a natural
frequency of 0.215 Hz. The second vibration mode is a width direction, which oscillates at
0.459 Hz.
Fig. 18. Result of the FFT analysis (After maneuver, In-plane)
Fig. 19. Result of the FFT analysis (After maneuver, Out-plane)
5.6 Identification of the damping constant
From the out-plane deformation shown in Fig. 17, the damping constant is identified. The
twelve peaks after finishing the maneuver are used for the identification. The result of the
identification is 0.021, while the damping constant is so small that the natural response
frequency of the out-of-plane vibration is very nearly equal to the vibration frequency.
Measurement of Satellite Solar Array Panel Vibrations
Caused by Thermal Snap and Gas Jet Thruster Firing
137
Fig. 20. Estimated vibration mode (Left: 1st. Mode, Right: 2nd. Mode)
6. Measurement result of the thermal snap
The thermally-induced deformation of the solar array paddle is measured when GOSAT
goes from the sun side into the shadow of the Earth. To take good images for processing, the
appropriate exposure must be set on the monitoring camera and several measurements are
conducted as its exposure changes. The images taken at each measurement are subsequently
processed to determine the position of the markers based on the adjusted algorithm. The
distances between the two markers are evaluated and it is shown that the two markers get
close during each measurement, allowing the out-of-plane deformation results of the solar
array paddle to be obtained.
6.1 Measurement conditions
Fig. 21 shows the exposure and shooting time, with the LED always on, regardless of the
lighting condition and the image resolution SXGA. These conditions are assigned uniform
values for all measurements. Images used for measurements are taken when the satellite
goes into an eclipse from the sun side. The time is recorded from the point at which the
satellite enters the eclipse. The initial 10 seconds is defined as the penumbra, within which
the optical environment changes momentarily. The sunshine comes before the penumbra,
and the umbra starts 10 seconds after the origin of the latter. The optical environments differ
dramatically between the sunshine and eclipse, making it impossible to apply uniform
exposure throughout the measurement. If this is done, the brightness of the image taken in
the sunshine is saturated, or an image showing nothing is produced when the satellite
enters the eclipse. The exposure applied should be varied as appropriate depending on the
optical environment. Therefore, several times of measurements are conducted with several
exposures and several shooting times. Case 1 shown in Figure 9 is intended to take good
images in the umbra, with exposure fixed to 1/16, and shooting need not be suspended to
change the exposure. Cases 2, 3, and 4 are conducted to take good images in both sunshine
and umbra. The optical environment in sunshine is very light, so exposure must be short
enough. Exposure is initially set to 1/512, 1/1024, and 1/2048 at first in cases 2, 3, and 4
respectively. After going into the eclipse, the exposures are changed to 1/16 to take good
images in the umbra in each case.
In cases 5 to 9, measurements start 2 minutes after entering the eclipse, and finish 2 minutes
later in terms of elapsed time. Case 5 is conducted as a reference for the other cases, with
exposure of 1/16. The exposure is set up for the range 1/32 to 1/256, and fixed in each case.
Recent Advances in Vibrations Analysis
138
Fig. 21. Measurement condition (Cases 1 ~ 9)
6.2 Result of the thermal snap measurement
Fig. 22 shows examples of images taken in case 1. Fig. 23 is the result of cases 1, 2, 3, and 4,
which shows the out-plane displacement of marker No. 0, with the upgraded algorithm for
finding markers used to conduct image processing. The orange-colored line shown in Fig.
23, which shows the result of case 1, starts from around the time of origin. Therefore, the
image processing succeeds, not only when the satellite is in umbra but also at the end of the
penumbra. Rapid deformation occurs in the penumbra, the range of which is about 6 mm.
Deformation of the solar array paddle in the umbra starts from about -4.5 mm of the out-
plane displacement. Subsequently, the displacement continues to change slowly until about
120 seconds have elapsed from the start of the time elapsed, and then stops. Case 1 shows
that rapid deformation occurs at the end of the penumbra, while slow deformation, which is
considered quasi-static, occurs after the satellite has completely entered the eclipse. In cases
2, 3, and 4, measurements succeed in both the sunshine and umbra. The image processing is
accurate to a sub-pixel level, namely sufficient. When the satellite is in the sunshine, the
out-plane displacement of marker No. 0 ranges from about -10 to -7 mm, retaining nearly
the same value in each case. Once the satellite enters the eclipse and the exposures are
changed, the measurements are conducted again.
The out-plane displacements in the umbra are nearly the same as that of in case 1, but differ
when values in the sunshine and umbra are compared. Therefore, the deformation of the
solar array paddle is considered to occur from the point the satellite is in the sunshine to
that when that is in the umbra.
From cases 1, 2, 3, and 4, displacement in the sunshine and umbra could be respectively
obtained. However, displacement in the penumbra could not be measured well due to
inappropriate exposure. Fig. 24 shows the results of cases 5, 6, 7, 8, and 9, as well as the
out-plane displacement of marker No. 0. Image processing to find markers succeeded from
the starting penumbra to the end of measurement in the umbra. The accuracies of each
measurement are about plus or minus 1mm, which is sub-pixel level and sufficiently
accurate, allowing deformations in the penumbra to be correctly determined. It is shown
Measurement of Satellite Solar Array Panel Vibrations
Caused by Thermal Snap and Gas Jet Thruster Firing
139
that rapid deformation resembling vibration occurs at the solar array paddle of GOSAT
while the satellite traverses the penumbra.
Fig. 22. Examples of images in case 1 (Left: Sunshine, Centre: Penumbra, Right: Umbra)
Fig. 23. Out-of-plane displacements of marker No. 0 in cases 1, 2, 3, and 4
Fig. 24. Out-of-plane displacement of marker No. 0 in cases 5, 6, 7, 8, and 9
Out
-
of
-
plane displacement [mm]
Out
-
of
-
plane displacement [mm]
Recent Advances in Vibrations Analysis
140
7. Conclusion
In this chapter, a measurement system using an on-board monitoring camera to observe
thermal snap in orbit was explained. The thermal snap phenomenon, which causes attitude
disturbance of LEO earth observation satellites, has long been observed from gyro telemetry
data. However, direct observation of the thermal snap had never succeeded until now. A
camera mounted on GOSAT took images when the 20-N thrusters were used and GOSAT
went into the eclipse from the sunshine area, and image processing is conducted to measure
the displacement of the solar array paddle of GOSAT. To obtain the result around the time
of entering the eclipse, the algorithm for extracting the edges of the markers was adjusted by
changing the method of detecting the marker candidate area, and the threshold for finding
the markers. Based on the measurement during the 20-N maneuver, it was shown that our
measurement system could realize sub-pixel measurement accuracy, and the vibration
caused by the 20-N maneuver could be observed. Subsequently, the measurements during
the transition from sunshine to eclipse showed that deformation of the solar array paddle
arose around the time when the satellite went into eclipse.
We are scheduled to conduct additional measurements of the thermal snap phenomena
which occur at the solar array paddles of GOSAT because we have not succeeded in
conducting an uncut thermal snap measurement from sunshine to umbra.
8. References
Foster, C. L.; Tinker, G. S.; Nurre, W. & Till, W. A. (1995). NASA Technical Paper, The Solar
Array-Induced Disturbance of the Hubble Space Telescope Pointing System, 3556
Iwata, T.; Hoshino, H.; Yoshizawa, T.; Tanamachi, T.; Kawahara, T. & Gonda, H. (2006).
Precision Attitude Determination and Control for the Advanced Land Observing
Satellite (ALOS): Flight Results (in Japanese), Proceedings of the 50th Space Science and
Technology Conference, Japan, 2006
Japan Society of Mechanical Engineering (February 2007). Mechanical Engineers’ Handbook
Applications
11: Space Equipment and Systems, Japan Society of Mechanical
Engineering, ISBN 978-4-88898-154-5, Japan
Johnston, J. D. & Thornton, E. A. (2000). Journal of Spacecraft and Rockets, Thermally Induced
Dynamics of Satellite Solar Panel, Vol. 37, No. 5 (2000) pp. 604-613
Mobara, M. (October 1994). Introduction to aerospace engineering –guidance and control of
satellite and rocket, Baifukan, ISBN 978-4-56303-493-1, Japan
Part 3
Modelling and Analysis of Complex Systems
8
Modelling and Vibration Analysis of Some
Complex Mechanical Systems
Tadeusz Markowski
1
, Stanisław Noga
1
and Stanisław Rudy
2
1
Rzeszów University of Technology
2
WSK PZL Rzeszów S.A.
Poland
1. Introduction
Development of modern engineering requires technical equipment which is characterized
by high stability and operational dependability. This particularly applies to components and
assemblies which are employed in the aviation, pharmaceutical and biotechnological
industries, and biomedical devices. Each newly produced assembly must pass a cycle of
advanced computations and a set of experimental tests which allow it to be used in
engineering structures. In many cases the experimental tests are realized in order to verify
the analytical results. For economic reasons, the calculations should be executed by using
advanced computation techniques and the experimental investigations should be conducted
on specially designed test rigs. Such test rigs are required to satisfy specific requirements to
guarantee that experiments can be led with high technical quality, and economic reasons
demand that the rigs should operate for a long period of time (Friswell & Mottershead,
1995). One of the essential factors, which could disturb or restrict the functioning of devices
(rigs and others), are the vibration of the components or assemblies of these systems. So it is
advantageous to conduct numerical computations at the design stage, which could restrict
the consequences connected with the structure vibration. The rapid development of
computer techniques and analytical systems based on the finite element method (FEM)
allows a free vibration analysis of large systems of complex design and geometry to be
conducted (De Silva, 2005). Some authors, using FEM techniques, analyzed the free
vibration of complex structures, which are used as load – bearing elements of building
structures (Ansell, 2005). Free vibration analysis of selected steel bridges is conducted in
papers of Chung and Živanovič (Chung & Sotelino, 2006; Živanovič et al., 2007). The bridge
FE models that are developed are verified on real objects. Zembaty (Zembaty et al., 2006)
studied the influence of damage of the base construction frame on the change in the natural
frequencies of the system. The gas turbine blade is a very important part of aviation jet
engine. Some authors analyzed the influence of friction contact phenomenon in
collaboration regions of blades and disk sectors on the dynamic behaviour of the blades
(Allara, 2009; Toufine et al., 1999). Some presented results were verified by experimental
tests. Free vibration of the blade are developed by Sinha (Sinha & Turner, 2011) using the
thin shell theory. The achieved solution includes the effect of warping of the cross – section
of the blade. Membrane systems have wide application in different disciplines of
engineering. Jaffrin and Tack in their papers (Jaffrin, 2008; Tack et al., 2006) present practical
Recent Advances in Vibrations Analysis
144
examples of the use of the membrane complex systems in the pharmaceutical, chemical and
biotechnological industries, and biomedical devices. The fundamental theory of vibration of
membrane systems is elaborated in a number of monographs for example by, Kaliski
(Kaliski, 1966), Rao (Rao, 2007), and others. The classical theory of membranes is used by
Rossit (Rossit et al., 1998) to solve the problem of the free vibration of composite membranes
with discontinuously varying density. Noga (Noga, 2008) presents introductory studies that
deal with the updating of the FE model of an annular membrane based on the analytical
solution data. The complete analytical solutions of undamped free vibration of an elastically
connected annular and circular double membrane compound systems are derived by Noga
(Noga, 2010a).
The aim of this study is the analysis of the free vibration of selected mechanical systems
with complex design and geometry. The present work is organized as follows. Section two
gives basic overview of finite element technique for free vibration analysis. Section three
presents the vibration problem of the fatigue test rig for aviation gear boxes. In section four
the free vibration of the gas turbine blade are analyzed. Section five deals with the vibration
problem of an annular membrane resting on an elastic foundation of a Winkler type. Section
six gives some concluding remarks.
2. Finite element technique in vibration problem
The finite element (FE) technique is a useful tool to solve various dynamics problems. As
mentioned earlier, the use of FE method allows the specific design feature and complex
geometry of the system under study to be taken into consideration. The first step in any
finite element analysis is to discretize the continuous models by building a discrete model of
the physical structure to be analysed. It leads to the equations of motion of the analysed
system that may be written in the following form (De Silva, 2005):
Mu Ku 0
(1)
where M and
K are, the global mass and global stiffness matrices (made up by proper
assembly of the element matrices); u
and
u are the nodal acceleration and nodal
displacement vector, respectively. Global mass and stiffness matrices are assembled from
the element matrices that are given by (De Silva, 2005):
,
ee
ee ee e
TT
VV
dV dV
MNNKBEB
(2)
where
e
is the mass density coefficient for an element e ;
e
V is the volume of an element
e ;
N is the matrix of the element shape functions; B and E are, the element shape
function derivatives, and the elasticity matrices, respectively. The natural frequencies of the
system may be obtained by solving the eigenvalue problem
2
KMu0
(3)
where
is the natural frequency and u is the corresponding mode shape vector which can
be obtained from equation (3). The number of eigenpairs (
,
ii
u
) corresponds to the number
of degree of freedom of the system. The block Lanczos method is employed to solve the
Modelling and Vibration Analysis of Some Complex Mechanical Systems
145
eigenvalue problem (3). Because of the discretization process, the FE models are treated as
approximations of the exact systems. The error between the accurate and the FE models is
defined by (Friswell & Mottershead, 1995):
100 %
f
ee
(4)
where
f
is the natural frequency from the FE analysis, while
e
is the natural frequency
of the exact system. Equation (4) is the so - called frequency error (Friswell & Mottershead,
1995). For many systems with simple geometry, the exact value of the natural frequencies
may be achieved from an analytical solution of the free vibration problem (Noga, 2010a,
2010b). Another possibility to determine the exact values of the natural frequencies is the
execution of experimental investigation.
3. Vibration of the fatigue test rig for aviation gearboxes
The subject of this section is to analyse the free vibrations of a gear fatigue test rig working
in a power circulating rig configuration. Markowski (Markowski et al., 2010) presents
introductory studies that deal with the vibration of the system being studied. For this rig
two FE models in the ANSYS system are made.
CLOSING
GEAR
LOADING
GEAR
ELECTRICAL
ENGINE
TESTED
ASSEMBLY
ASSISTING
DEVICES
FOUNDATION FRAME
Fig. 1. The block diagram of the test rig
Based on the developed models, natural frequencies and mode shapes are determined. The
received results are verified by the experiment. Some concluding remarks are provided.
3.1 Description of the gear test rig working in closed loop configuration
The test rig in question is created at the Test Bed Shop of the Wytwórnia Sprzętu
Komunikacyjnego PZL Rzeszów S.A. A block diagram is presented in Fig. 1. All assemblies
of the rig are mounted on metallic tables seated on the base frame, the design of which is
demonstrated in Fig. 2. The frame consists of two layers of structural sections with a channel
section welded together and fastened to the concrete base by anchors. The estimated weight
of the base frame is 1600 [kg]. The full description of the base frame can be found in
Markowski’s paper (Markowski et al., 2010).
Recent Advances in Vibrations Analysis
146
320 m
m
2000 mm
590 mm
4100 mm
anchor
C50 channel
p
rofile
C180 channel profile
360 m
m
Fig. 2. Model of the base frame
Each additional steel table consisting of a structural 100x100x6 square section or a
rectangular 100x50x8 and 100x50x6 sections has a plate made of steel 20 [mm] thick sheet on
the upper end. All steel tables of the rig are welded. On the individual plates of the tables,
the applicable assemblies of the rig are mounted together with additional features, used for
the stability and accuracy of the rig assembly process. In Fig. 3, the rig under investigation is
presented. The total estimated weight of the whole rig is 6500 [kg]. The rotating components
of the rig are working in a rotating range of 2700 – 7500 [rpm], which, if converted into
number of cycles, equals 45 – 125 [Hz] without considering the multiplication factor of the
number of teeth. It was found that the assemblied rig vibrates under the influence of ground
excitation, which is caused by the work of the neighboring test rigs. There was a real danger
that those vibrations would disturb the rig operation.
Fig. 3. Gear fatigue test rig overall view
Modelling and Vibration Analysis of Some Complex Mechanical Systems
147
The necessity of the dynamic rig analysis was recognised in order to estimate its natural
frequencies and mode shapes.
3.2 Finite element representations of the system
To obtain satisfactory modal analysis results, an accurate FE model of the system must be
developed before conducting an experimental investigation on a real object. Such a primary
dynamic overview of the system is helpful in planning and conducting the experimental
investigation (De Silva, 2005; Friswell & Mottershead, 1995). The investigated test rig is a
complex system composed of various structural components. Therefore the primary aim is
to develop an analytical model of the rig that has dynamic parameters (natural frequency
and mode shapes) as close as possible to the parameters of a real object. From the economic
point of view, the elaborated model should be so simple that the costs connected with its
development and operations are kept at a bare minimum (Friswell & Mottershead, 1995).
Due to this fact, it is of high importance how crucial structural elements and rig assemblies
are modelled, as well as, how proper FE elements are selected. From the test rig stability
point of view, the base frame is an essential structural component (Fig. 2). This requires
developing of a relatively precise FE model of the base frame. Two finite element models of
the investigated system are prepared and discussed with the use of ANSYS FE code.
merged nodes
node
p
late
Fig. 4. Modelling of the welded joints
The first FE model is created in the following way: the base frame is modelled using shell
elements (shell99) quadrilateral, eight nodes with six degrees of freedom on each node and
the sets of channel sections of the base frame are modelled with shell99, assuming the
location of the nodes on the external surface of the element (Fig. 4). However, this approach
introduces a modelling error because of the excessive mass concentration in the corner of the
channel sections, which results in improper inertia moments of the channel sections sets.
The frame support was modelled assuming the constraint point wise in the areas where the
frame is attached to the concrete foundation by the anchors. In each such point, one
rotational degree of freedom along the axes of the anchor is left free (Fig. 5).
Additional reinforcement of the external sets of the channel sections in the upper layer is
modelled by the beam element (beam44). Each of the rig assemblies together with
corresponding steel tables (with the exception of supporting device) is modelled as a so –
called rigid region concentrated at the mass point where total mass is located. In the rigid
region, two types of nodes can be distinguished: master nodes and slave nodes
subordinated to the master node (Markowski et al., 2010).
Recent Advances in Vibrations Analysis
148
Fig. 5. The boundary condition
assembly no 1
assembly no 2
assembly no 3
assembly no 4
assembly no 5
Fig. 6. First FE model of the system
Fig. 7. Finite element model of the assembly no. 1 steel table
This means that slave nodes have the same DOF as the corresponding master node. With
reference to the discussed rig, in all the applied rigid regions the location of the master
nodes overlaps with the position of mass points located in the centre of gravity of modelled
assemblies. Each mass point is realized by a single node mass element (mass21) with six
DOF. The nodes of the base frame located in the collaboration regions of the modelled
assemblies and modelled frame are considered the slave nodes of the particular rigid