Risk Management in Environment Production and Economy Part 3 pptx
Bạn đang xem bản rút gọn của tài liệu. Xem và tải ngay bản đầy đủ của tài liệu tại đây (1.69 MB, 20 trang )
Toward a Hydro-Economic Approach for
Risk Assessment and Mitigation Planning of Water Disasters in Semi-Arid Kenya
29
planning and risk assessment as well as the valuation and recognition of the role of natural
resources in sustaining life. They recommended the empowerment of local stakeholders to
provide alternative and decentralized approaches towards water supply and relief options
under conditions of drought or any other disaster.
3. Hydro-economic risk assessment: Methods and techniques
Hydro-economic risk assessment and management (HERAM) basically features in the
framework of “Environmental risk analysis” (ERA) in a catchment area. Ganoulis &
Simpson (2006) define ERA as “the evaluation of uncertainties in order to ensure reliability
in a broad range of environmental issues, including utilization of natural resources (both in
terms of quantity and quality), ecological preservation and public health considerations”.
They provide the following framework for assessing and managing the risk: problem
formulation, load-resistance (or exposure-response) characterization, risk quantification,
evaluation of incremental benefits against different degrees of risk, and decision-making for
risk management. The Risk analysis consists of two procedures: Risk assessment (RA) and
Risk management” (RM). Risk assessment deals with the identification of the hazard, the
determination of its value (both quantitative and qualitative) and the observable effects it is
likely to yield on the people, their environment and economy. Risk management entails the
design and implementation of mitigation plans, and their monitoring and evaluation for
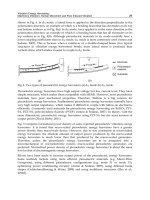
sustainability. Like ERA, “Hydro-economic risk assessment and management (HERAM)
involves a Risk assessment (RA) and a Risk management” (RM). The RA encompasses three
other procedures: a “hydro-geomorphologic risk assessment” (HRA), a “social impact
assessment” (SIA), and an “Economic inventory” (EI). These three procedures are
embedded in the Risk management” (RM). Figure 1 provides the sequence of repeatable
steps involved in the conduction of a HERAM.
Fig. 1. Hydro-economic risk assessment and management framework
Risk Management in Environment, Production and Economy
30
It shall be noted that “Economic inventory” (EI), which in fact is an incremental analysis of
farming water efficiency, makes the particularity of the HERAM. It assesses the effects of
water management on its productivity and efficiency in agriculture. It uses hybrid inventory
models shaped after Wilson deterministic stock inventory, Baumol deterministic monetary
inventory and Beranek dynamic cash inventory, both under above normal (ANOR), normal
(NOR), and below normal (BNOR) rainfall regimes (Luwesi, 2010). These models combine
internal and external costs incurred in the management of water inventories in order to
simulate efficient levels of water use in farming under fluctuating rainfall regimes. Internal
costs encompass both the cost of transaction and opportunity cost of water management,
while external costs include the cost of water saving under ANOR, and water shortage cost
under BNOR. The incremental analysis of the total cost leads to three key indicators of
farming water efficiency, namely the “Economic order quantity” (EOQ) - computed under
the ANOR, the “Limit average cost” (LAC) - determined under NOR, and the “Minimum
efficient scale” (MES) - calculated under the BNOR. Finally, the analytical process assesses
the variations of incomes vis-à-vis costs under different hypotheses of the management
efficiency (EOQ, LAC and MES) to design strategic guidelines. Table 1 summarizes key
outputs of an “Economic inventory” during a HERAM.
Rainfall regime
Total Cost of farming water Optimum
(First Order
Conditions)
Internal Costs External Costs
Normal (NOR)
Cost of
Transaction
Opportunity
Cost
Limit Average Cost
(LAC)
2q /
r
no
=Q
Above Normal
(ANOR)
Cost of
Transaction
Opportunity
Cost
Saving Cost
Economic Order
Quantity (EOQ)
2q /(2 )
r
an
=Q
q
Below Normal
(BNOR)
Cost of
Transaction
Opportunity
Cost
Shortage
Cost
Minimum Efficient
Scale (MES)
2
r
bn
=
Table 1. Economic inventory outputs
Note: r
no
, r
an
and r
bn
refer to the water demand turnover under NOR, ANOR and BNOR,
while Q and q stand for the farming activity output and input, respectively standardized as
follows:
*
*
f
nY
Q=
WP
(1)
*
*
nE
q=
WP
f
(2)
Where, Y is the farming income, E is the farming expense, P is water price in the market (per
m
3
), W
f
is the farmer water demand, and n the number of water withdrawals by the farmer.
Toward a Hydro-Economic Approach for
Risk Assessment and Mitigation Planning of Water Disasters in Semi-Arid Kenya
31
The HERAM conducted in Muooni Dam Catchment sought to evaluate the efficiency of
water use in agriculture under hypothesized fluctuations of rainfall in South-East Kenya. It
responded to the following research questions: (i) What kind of anthropogenic and
environmental factors affect efficient use of Muooni Dam water in farming? (ii) To what
extent do land-use activities and environmental externalities influence the active water
storage capacity of Muooni Dam? (iii) What variations of farmers’ actual water demand and
related costs are expected as a result of rainfall fluctuation in South-East Kenya? (iv) What
are the efficient levels of farmers’ water demand and related costs under fluctuating rainfall
regimes? (v) How can farmers improve their water efficiency in the course of climate
change?
Zeiller (2000) stratified random sampling was used to select some 66 farms at Muooni Dam
site and 60 key informants outside the dam site. The method involved equal chances of
selection for all the respondents, both the most accessible ones and those far away from
Muooni Dam site. The hydro-geomorphologic impacts sampling was based on Gonzalez et
al. (1995) impact assessment technique. The latter aimed to record significant land-use
activities and impacts randomly occurring on farmlands. Descriptive statistics, non-
parametric tests, and time series analysis assisted in the valuation of impacts assessed, the
establishment of their relationship with land-use activities observed, and the prediction of
Muooni Dam’s active water storage capacity. Spatial data were processed using ArcView
GIS mapping for both land-use activities and impacts assessed. Then the analysis proceeded
to assess social impacts using mainly descriptive statistics, trend analysis, and a
triangulation of both quantitative and qualitative methods. This led to the economic
inventory, which totally relied on hybrid inventory models for the computation of farmers’
water demand and related costs. It also helped to simulate the optimum levels (EOQ, LAC
and MES) of farming water demand and cost under three respective scenarios of rainfall
fluctuation (ANOR, NOR and BNOR). These efficiency indicators were computed for each
of the three categories of farmers, notably “Large-scale farmers” (LSF), “Medium-scale
farmers” (MSF) and “Small-scale farmers” (SSF). Different techniques of “Integrated
watershed management” (IWM) were suggested to improve the efficiency of farming water
use in Muooni Dam Catchment. The following sections present the sequential analytical
steps of the HERAM conducted in Muooni Dam Catchment.
4. Hydro-economic risk assessment conducted in Kenya
This section presents the main findings from the HERAM conducted in Muooni Dam
Catchment of Kenya. It consecutively outlines the problem formulation, the screening and
scoping strategy, the exposure–response characterization, the risk quantification, the
incremental analysis, and the strategy for mitigation of water disasters in farming.
4.1 Problem formulation
Muooni Dam Catchment is subject to demographic expansion, climate variability, and land-
use changes occurring at a large scale. These socio-environmental changes are among key
factors leading to soil erosion, the siltation and pollution of drainage channels and water
storages, thus affecting water availability and soil fertility in various catchment areas.
Pressures on water and soil contribute to the catchment degradation and increased cost of
water and land in agriculture in most arid and semi-arid lands of Kenya. Food insecurity,
energy disruption and poverty are corollaries of such increased stress of water and land in
Muooni Dam Catchment. Therefore, what kind of anthropogenic and environmental factors
Risk Management in Environment, Production and Economy
32
affect efficient use of water and land by farmers in this catchment area? Is there a way to
improve the efficiency of farming water use under fluctuating rainfall regimes?
4.2 Screening and scoping strategy
This study was based on risks associated to land-use activities going on in Muooni Dam
Catchment. The key criterion for screening was the intensity of the hydro-geomorphologic
risks assessed on farmlands and Muooni Dam. A scope of most significant risks was
determined from their contribution to the degradation of Muooni Dam catchment. As
presented in Table 2, the most significant land-use activities and their likely hydro-
geomorphologic risks ranged from 1 to 6.
Weight Land-use activity Weight Hydro-geomorphologic risk
1 Tree planting 1 Sheet/ rill erosion on farmland
2
Intensive cultivation using
water pumps/ tanks
2 Encroachment on wetland
3
Subsistence cultivation with
limited irrigation
3
Sand harvesting/ quarrying
impacts on farmland
4
Subsistence cultivation without
irrigation
4 Gully erosion on farmland
5
Livestock keeping with some
cultivation
5 Landslide on farmland
6
Livestock keeping without
cultivation
6
Eucalyptus water over-
abstraction
Table 2. Land-use and associated risks in Muooni Dam Catchment
This table points out that the catchment degradation was basically defined in terms of soil
erosion problems leading to the sedimentation of the dam, and to excess water loss from the
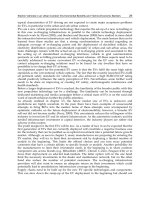
dam reservoir. Gonzalez et al. (1995) mapping technique was applied along with GIS spatial
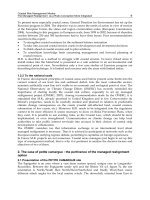
modelling to plot each land-use activity and its likely environmental risk. Figure 2 illustrates
the distribution of land-use activities assessed on farmlands, while Figure 3 suggests a
display of their associated risks. These figures emphasize the fact that agro-forestry and
subsistence cultivation and their associated risks (sheets and rills as well as eucalyptus
water over-abstraction) had very high significance in their occurrence in the catchment.
Following the depletion of the forest cover, they were propounded to be the key factors
hindering water availability in drainage systems and the dam reservoir in Muooni Dam
Catchment. These land-use activities and associated risks represented more than three fourths
of the total farming area surveyed. Other land-use practices, though not significant, included
livestock keeping with some cultivation (12.1%), intensive cultivation using water pumps and
storing devices (10.6%), and subsistence cultivation with limited irrigation (3%). Their related
hydro-geomorphologic risks were mainly gully erosion, landslides and encroachment of farms
on wetlands, which accounted for 8%, 3%, and 8% of farms surveyed, respectively.
This assessment of hydro-geomorphologic risks also looked at environmental externalities
affecting water availability and land fertility in Muooni Dam Catchment. Off-site effects of
environmental changes on the catchment were highly significant in terms of soil erosion
problems and water stress in the catchment. The significance of these environmental
Toward a Hydro-Economic Approach for
Risk Assessment and Mitigation Planning of Water Disasters in Semi-Arid Kenya
33
externalities was elucidated by the effects of El Niño rainfall and heavy wind pressure
associated to the siltation of the dam and drainage channels, deforestation, floods, gully
erosion, and landslides in the catchment. Table 3 summarizes these externalities and their
associated risks.
Note: Numbers 1 to 6 refer to the weight of land-use activities found in Table 2.
Fig. 2. Spatial distribution of land-use activities in Muooni Dam Catchment
Note: Numbers 1 to 6 refer to the weight of hydro-geomorphologic risks found in Table 2.
Fig. 3. Spatial distribution of hydro-geomorphologic risks in Muooni Dam Catchment
Risk Management in Environment, Production and Economy
34
Weight externality Weight Hydro-geomorphologic risk
7
Heavy wind pressure
7
Siltation of dams & drainage systems
8
Heavy wind pressure
8
Deforestation
9
El Niño rainfall
9
Flooding
10
El Niño rainfall
10
Gully erosion in the catchment
11
El Niño rainfall
11
Landslides in the catchment
12
El Niño rainfall
12
Drought
Table 3. Environmental externalities and associated risks in Muooni Dam Catchment
It shall be noted that the rainfall regime in South-East Kenya is mainly dominated by two
dry “monsoon” seasons and two rainy seasons associated with the movement of the ITCZ.
The annual average rainfall fluctuates between 500 and 1,300 mm, with 66% of reliability,
part of it coming from the trade effects of south-eastern winds blowing on slopes (Jaetzold et
al., 2007). In such kind of environment, droughts and floods are likely to be recurrent due to
the effects of “El Niño southern oscillation” (ENSO) (Shisanya, 1996).
4.3 Exposure–response characterization
The hydro-geomorphologic risk assessment conducted in Muooni Dam Catchment revealed
a correlation between on-farm management, farmers’ level of income and education, and
environmental degradation. Most farmers seemed not to be aware of processes going on but
complained about soil erosion problems, wetland degradation and farmland infertility. A
majority among them got used to enhance their soil protection with terraces, contours, cut-
off drains, polyculture and agro-forestry (Tiffen et al., 1994). Yet, eucalyptus and other fast
growing alien trees remained the most dominant plant species in the catchment. Accelerated
land degradation and acute water stress drove governmental agencies to implement some
soil and water conservation measures in this area, especially during the dry season.
In effect, Muooni Dam Catchment area was formerly surrounded by Iveti forest.
Demographic pressure, the expansion of farming areas and other economic activities
contributed to the encroachment of the forest and to the destruction of more than 25% of its
estimated coverage in 1987 (WRMA, 2008). Thence soil erosion, landslides and water over-
abstraction by ecosystems, especially by eucalyptus trees planted in the wetlands, thwarted
farmers’ livelihood and the economic viability of their farming activities. Besides being
intensively cultivated, farmlands had poor soils and soil moisture (Lal, 1993; Waswa, 2006).
Due to the shortness of the rainy seasons, the fluctuations of rainfall affect efficient use of
water and land in agriculture, especially in terms of crop water requirements and crop
treatments. In such circumstances, farming incomes are likely to be insignificant, unless
supplemented by off-farm incomes. The introduction of “marginal” crops with lower
diurnal potential evapo-transpiration (mainly bean and maize species) has proved to be a
salvation for farmers under extreme water stress conditions (Jaetzold et al., 2007).
Unfortunately, chances for high yields and good incomes are ever reduced as soil moisture
declines so quickly due to the smallness of farmlands and to prolonged droughts.
Toward a Hydro-Economic Approach for
Risk Assessment and Mitigation Planning of Water Disasters in Semi-Arid Kenya
35
Consequently, farmers are constrained to adopt unsustainable farming strategies to cope
with these poor yields and incomes during unpredictable droughts. Such strategic farming
methods included excessive intercropping and multiple cropping of perennial indigenous
and alien crop species on small farmlands. Yet, this could not hold their operational costs
and losses significantly back. Water over-abstraction by eucalyptus and other alien trees
along with off-site effects of El Niño flooding and drought accelerated the risk of soil erosion
and water excess loss. Eucalyptus tree planting and subsistence cultivation with irrigation in
Muooni Dam Catchment were limited to overland flow and encroached on wetlands. The
natural vegetation in those wetlands has been substituted by exotic trees, crops and weeds.
These interlopers generally exacerbate the vital functions of the whole ecosystem, owing to
the fact that they are not water friendly (Jansky et al., 2005; Kitissou, 2004). Moreover, the
practice of overland flow irrigation increases the rate of streamflow evaporation beyond
30% of the total water resource available (Shakya, 2001). Therefore, soils in farmlands are
deprived of most of their resilience, fertility and moisture (Lal, 1993).
Potential rich soils are rare in most Kenyan ASALs, especially where shallow topsoil
overlies a light soil. The impact of a raindrop, whether by through-fall or drip from
raindrops intercepted by tree canopy, is a necessary and sufficient condition for soil erosion
to occur in these areas. Thus, sheets and rills in Muooni Dam Catchment appeared in more
than half of the fields surveyed. High rates were recorded in lands managed by full-time
farmers and farmers employed in the private sector. The increase of runoff on the surface
and the decrease of water infiltration in the soil were likely to cause an “overland flow” and
generally resulted in pronounced channels known as “rills” and “inter-rills”
(Soilerosion.net, 2007; Thompson & Scorging, 1995). Inter-rills were to become “gullies”,
when overflowing massive surface materials (cobbles, stones and grasses) were detached on
hillsides during rainstorms and the infiltration capacity of the soil was exceeded. Mass
movements were expected in some parts of the catchment, “when obliterated by weathering
and ploughing” (Morgan, 1995). No doubt that any farmer, who had not been keen to clear
sheets or rills, immediately after their occurrence, had to face acute soil erosion problems.
That is why a majority among farmers wanted to cultivate near the riverbanks and other
wetlands.
The combined effects of all these factors justify the changes observed in the microclimate of
Muooni Dam Catchment through the variation of its temperatures and rainfall regimes.
They might also explain the recurrence of droughts and the phenomenon of seasonal water
courses in this catchment area. The latter nurtured colossal soil loss and sediment load in the
drainage systems of Muooni River and its dam reservoir. This might have led to the
decrease of Muooni Dam active water storage capacity. The following section analyzes the
relation between land-use activities assessed and their associated risks, and between the
risks and Muooni Dam active water storage capacity to establish that assertion.
4.4 Risk quantification
The estimate of the risk magnitude was done in three steps. First, the study sought to
establish a cause-and-effect relationship between land-use activities assessed and their
associated risks. Second, an estimate of the variations of Muooni Dam’s active water storage
capacity under the effects of risks identified was done to predict its trend. Lastly, the
analysis estimated the magnitude of socio-economic impacts.
Risk Management in Environment, Production and Economy
36
4.4.1 Land-use and associated impacts/ risks
The hydro-geomorphologic risk assessment did not establish a direct relationship between
land-use activities assessed and their likely hydro-geomorphologic impacts. Mann-Whitney
U-Test proved with 99.8% confidence level that land-use activities assessed and their likely
impacts on farmlands were randomly drawn from independent populations (Table 4). These
findings were reinforced by Spearman’s rank correlation (Table 5).
No Decision Parameters Decision
1 U
1
= 2,178 n
1
= n
2
=66 The deviations around the means of the two
samples are far significant; so are their differences.
2 μ
1
=1,089 σ
1
=219.725
3 Z
u
= 4.9562 n= 66 Rejection of Ho (μ
1
=μ
2
) stating that there are
significant differences between the populations
from which the two samples were drawn.
4 Z
ρ
= 3.99 α = 0.002
Table 4. Results of Mann-Whitney U-Test
As displayed on Table 5, Spearman’s rank correlation confirmed with 99.8% confidence
level that there was no strong relationship between the two random samples analyzed.
Land-use activities assessed in Muooni Dam Catchment and their likely impacts may have
originated from diverse sources, within and outside the catchment. These two samples were
behaving independently one from another. These hydro-geomorphologic impacts might
have been the results of various risks hastening the degradation of the catchment area.
No Decision Parameters Decision
1 Σdi
2
= 52,081.5 n= 66 There is a weak correlation between land-use
activities and impacts assessed.
2 r
s
= -0.08718 n= 66
3 Z
u
= -0.01081 n-1=65 Acceptance of Ho (ρ
s
=0) stating that there is no
significant relationship between the populations
from which the two samples were drawn.
4 Z
ρ
= -3.99 α =0.002
Table 5. Results of the Spearman’s rank correlation
The on-site effects of soil erosion and eucalyptus water over-abstraction may be explained
by inadequate soil conservation measures used by farmers (Mutisya, 1997). Off-site effects of
soil erosion and high water evaporation from the dam reservoir may be elucidated by the
effects of global warming, El Niño floods and droughts, heavy wind pressures, footpaths
and roadsides, sand harvesting , deforestation and others forces from outside farming
activities. Both on-site and off-site risks were hindering water availability in drainage
systems and the dam reservoir in Muooni Dam Catchment (Luwesi, 2009).
4.4.2 Prediction of Muooni Dam’s active water storage capacity
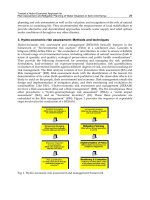
After identifying the actual risks, the analysis proceeded to estimate the variations of
Muooni dammed water and predict its trend. It revealed a decrease of the dam active water
storage capacity, since its construction was completed in 1987 (Figure 4).
Toward a Hydro-Economic Approach for
Risk Assessment and Mitigation Planning of Water Disasters in Semi-Arid Kenya
37
. m
3
Year
Note: Estimates from various data sources provided by key informants and WRMA (2008)
Fig. 4. Variability of Muooni Dam’s active water storage capacity
It was believed by 97% of public officers and key informants interviewed that soil erosion
and landslides were outwitting the Muooni Dam’s active water storage capacity under the
effects of El Niño floods and wind erosion. The decreasing water storage capacity of the
dam was a fact of its siltation by farming activities going on around the dam site. An uplift
has been observed in the years 1997-1998 due to the El Niño rainfall, which effects were
prolonged until a new descent started in the year 2000. Statistical predictions from Table 6
and Figure 5 emphasize a continuous decreasing trend of the dam’s water storage capacity
in the near future.
Year Dam storage capacity (m
3
)
2009 222,190
2010 208,791
2011 196,200
2012 184,368
2013 173,250
2014 162,802
2015 152,984
2016 143,759
2017 135,089
2018 126,943
2019 119,287
Table 6. Prediction of Muooni Dam’s active water storage capacity
Risk Management in Environment, Production and Economy
38
Fig. 5. Trendline of Muooni Dam’s active water storage capacity
The maximum capacity of Muooni Dam reservoir that was established to 1,559,400 m
3
in
1987 has decreased to an estimate of 196,200 m
3
in the year 2011. It will go under its
threshold by the year 2019, storing less than 119,400 m
3
. The analysis also established an
annual decreasing rate of 6.2% of the dam’s active water storage capacity (Table 7).
Model (St)
Coefficients
t-statistic Sig.
B Std. Error
1. (Constant) 872,530 316,576 2.756 0.013
2. t -0.0618 0.017 -3.564 0.005
Note: r = 0.81; R
2
= 0.6565; Mean = 671,874 m
3
; ET = 173,400 m
3
Table 7. Significance of Muooni Dam’s storage capacity trendline
This table shows that the annual mean water storage capacity was 671,874 m
3
with a
standard error (SE) of 316,576 m
3
and an error term (ET) of 173,400 m
3
. The fact that the
deviations around the mean (SE and ET) are far less significant than the sample mean attests
that the model is viable for further predictions. The correlation coefficient (r) and the
coefficient of determination (R
2
) also testify that the regression model is sufficiently strong
to explain the variations of the dam’s active water storage capacity (S
t
) by the time (t). In
fact, the correlation coefficient shows that 81% of the variations of the active water storage
capacity of Muooni Dam reflect its old age. The fluctuations of the dam’s active water
storage capacity have thence the same bearing as the depreciation of its reservoir
infrastructure. The coefficient of determination confirms this result by attributing 65.7% of
the total variation of the dam’s active storage capacity to its logistics obsolescence.
Spearman’s Rho test certifies these assertions (Table 8).
Toward a Hydro-Economic Approach for
Risk Assessment and Mitigation Planning of Water Disasters in Semi-Arid Kenya
39
Statistical Parameters Decision
1. r = 0.81 α = 0.005 There is a strong correlation between S
and t
2. S
r
= 0.134 n-2 = 20 The correlation coefficient is good
3. t
ρ;n-2
= 4.651 t
α;n-2
= 2.84 Rejection of H
0
(ρ=0): S is explained b
y
t.
So, the decreasing trend of the dam's
storage capacity is related to its logistics
old age.
Table 8. Results of the Spearman’s Rho test
This table highlights the fact that the prediction model was sufficiently strong to explain the
decreasing trend of Muooni Dam’s active water storage capacity by its logistics old age. It
reveals with 99.5% confidence level and 20 degrees of freedom that 81% of the variations of
the dam’s active water storage capacity were reflected in the changes of its infrastructure
resistance over years. However, only 65.7% of its total variation could be explained by the
dam's logistics old-age. The decreasing active water storage capacity of Muooni Dam might
have been a consequence of its reservoir logistics depreciation, either by destruction or by
lack of maintenance. Therefore, the study needed to explain the remaining 34.3% of the total
variation of the dam’s active storage capacity not attributed to its logistics obsolescence. This
proportion of the total variation of Muooni dam’s active storage capacity might be due to
the hydro-geomorphologic risks identified earlier, and which were degrading the dam’s
catchment area. Both the dam’s logistics obsolescence and hydro-geomorphologic risks
associated to land-use activities and environmental externalities were threatening the social
welfare and economic stability of farmers, as demonstrated in the following subsection.
4.4.3 Magnitude of social and economic impacts
The decrescendo of Muooni dam’s active storage capacity may have severed smallholder
farming water security, and farmers’ yields and incomes. Due to excess water costs, it could
therefore not be surprising to see farmers using water inefficiently. These inefficient
practices thwarted the economic viability of farmers’activities and led to poverty. Farmers’
poverty in this area was likely due to an accumulation of losses over years, and as a result of
water stress and lack of potential agricultural lands (Table 9).
This table suggests that most farmers surveyed were at the brink of poverty since they were
incurring losses over years due to the decreasing productivity of their farming water and
land resources. The Social impact assessment (SIA) confirmed that poverty was a reality in
the study area. The distribution of farmers by level of income disclosed that 30% of farmers
in Muooni Dam Catchment had a daily average income of less than US $1, with an annual
income averaging US$ 231 (for $1=KES 60). Accordingly, the distribution of farmers by class
of income was dominated by small and Medium-scale farmers (SSF and MSF) earning a
monthly income below KES 3,000, and between KES 3,000 and 5,999, respectively. Hence,
the study needed to assess the variations of actual farmers’ water costs in Muooni Dam
Catchment vis-à-vis the optimum levels of farming water (EOQ, LAC and MES) to establish
their efficiency under fluctuating rainfall regimes.
Risk Management in Environment, Production and Economy
40
N° Operations LSF (KES) MSF (KES) SSF (KES)
1 Farming Income 428,400 273,600 55,800
1.1
Total Income
428,400 273,600 55,800
1.2
Average Income/m
3
85.84 65.68 51.62
2 Farming Expenditures 569,000 276,500 63,530
2.1 Seeds 10,000 17,500 2,110
2.2 Fertilizers 23,000 0 1,900
2.3 Pesticides 8,000 16,000 0
2.4 Water 0 0 12,000
2.5 Water Pumps Fuel 360,000 135,000 0
2.6 Wages 108,000 81,000 0
2.7 Transport 60,000 27,000 11,520
2.8 Food 0 0 36,000
2.9
Total Cost
569,000 276,500 63,530
2.10 Average Cost /m
3
114.9065 66.3773 58.7648
3 Farming Profit -140,600 -8.111 -7,730
3.1
Total Profit
-140,600 -8.111 -7,730
3.2 Average Profit/m
3
-28.1725 -0.701 -7.1502
Note: KES stands for Kenya Shillings
Table 9. Farmers’ annual income and expenses distribution
4.5 Incremental analysis
Results of the “Economic inventory” (EI) show that increased shortage costs of farming
water and the cost of fertile soil excess loss constrained farmers to order less farming water
(W
f
) than required by their crops (W
c
). Large-scale (LSF), Medium-scale (MSF) and Small-
scale farms (SSF) could just afford ordering 28.9%, 12.2% and 4.4% of their actual crop water
requirements, respectively (Figure 6). In such conditions, operational costs of farming water
soared by 175%, 518% and 1,420% of the actual total costs under the ANOR, NOR and
BNOR scenarios, respectively (Figure 7). This underscored a progressive accumulation of
farming losses by a majority of farmers over years.
An analysis of the optimum levels of farming water demand (EOQ, LAC and MES) revealed
that farmers operating in Muooni Dam Catchment recorded high water productivities from
1987 to 2003, under the ANOR rainfall regime. Their unit cost per m
3
averaged KES 197, 188
and 159 for LSF, MSF and SSF, respectively. This water cost was assorted to an “Economic
order quantity” (EOQ) of farming water demand in a very profitable economic conjuncture
at Muooni Dam Catchment.
Toward a Hydro-Economic Approach for
Risk Assessment and Mitigation Planning of Water Disasters in Semi-Arid Kenya
41
Fig. 6. Farmers’ water demand and crop water requirements
Fig. 7. Farming water costs under fluctuating rainfall regimes
From 2004 to date the loss of farming profitability under the NOR scenario is the most
important economic incentive that leads farmers to subdivide their lands. Their average
costs having become significantly high, older farmers have to limit their farming water costs
to a “Limit average cost” (LAC) of KES 444, 415 and 361 for LSF, MSF and SSF, respectively.
Many farmers have adopted inadequate practices such as eucalyptus tree planting , leasing
or even sale of part of their farmlands to new comers in order to limit their farming water
costs. Others have left their farmlands under fallow for several years.
By the year 2019, when the active water storage capacity of Muooni Dam will have gone
under its threshold, a majority will be obliged to abandon their farming activities and adopt
off-farm activities. Some will even embrace small-scale businesses, or jobs in the private and
public sectors. The “survivors” will have to sacrifice their short-term benefits by adjusting
Risk Management in Environment, Production and Economy
42
their farming water demands to a “Minimum efficient scale” (MES) of KES 831, 769.3 and
676.7, for LSF, MSF and SSF, respectively. Using the minimum efficient farming water
demand (MES), farmers will be able to secure more water than their actual water demand
(Actual W
f
) and crop water requirements (W
c
) (Figure 8). This will allow them mitigate the
high risk of crop failures under fluctuating rainfall regimes, particularly under drought.
For efficiency, farmers need to increase their respective actual water demand by at least 42%
to meet their optimal farming water levels under the scenario of ANOR rainfall regime
(EOQ ), NOR rainfall regime (LAC) and BNOR rainfall regime (MES), respectively. By so
doing, they would expect a fall of their farming water costs up to 36%, 78% and 232% under
the three respective scenarios. Such optimization of their farming water demand would
result in a decrease of their operational average costs by a range of 30% to about 100%. This
fall of operational costs would be accompanied by an increase of water productivities due to
high farming yields and good incomes under the ANOR rainfall regime, if the EOQ was to
be respected. This would allow farmers to meet their crop water requirements and ensure
the economic viability of their farming activities in time of water stress and scarcity.
0
5
10
15
20
25
0.25
0.40
0.55
0.70
0.85
1.00
1.10
1.18
1.25
1.35
1.43
1.53
1.60
1.68
1.75
1.83
2.00
2.75
3.50
4.50
7.50
15.00
Cubic Meters
Farm size (in acres)
Wf MES
Actual Wf
Wc
Fig. 8. Minimum farming water demand under rainfall fluctuations
There is not yet a prospect of significant increase of farming yields and incomes under the
NOR rainfall regime, and more less under the BNOR scenario, even where the LAC and the
MES can be applied with scrutiny. Farmers are particularly expecting a significant decrease
of their farming profitability under the BNOR rainfall regime due to farmland subdivisions
and poor soil moisture. This soil moisture decrease is particularly attributed to both the
change of the catchment microclimate and the global climate change. Therefore, how would
farmers ensure the sustainability of their farming efficiency in view of such disasters? The
following subsection presents the strategy that farmers need to apply in order to mitigate
the high risk of crop failures due to water disasters in the course of climate change.
4.6 Strategy for water disasters mitigation in farming
“Water crises are not about too little water but about managing water badly such that
billions of people and the environment suffer badly”(Water Vision, 2000, as cited in Mati,
2006). To curve the trend of water stress and scarcity, the Government of Kenya set a major
goal of implementing an “Integrated Watershed Management” (IWM). The overall
Toward a Hydro-Economic Approach for
Risk Assessment and Mitigation Planning of Water Disasters in Semi-Arid Kenya
43
implementation of IWM includes the creation of “Water resource users’ associations”
(WRUAs) in all the catchments to ensure that the “Water resources management authority”
(WRMA) implements the new water policy in consultation with the public (GWP, 2000;
UNDP, 2007). Talking about such implementation of IWM in Kenya, Förch et al. (2008)
suggest that the government speeds up the process by enforcing key regulations of the
water sector reforms. These include water quality control, water use allocation and
metering, and irrigation schemes and dams coordination. Farmers need to comply with
these rules by paying relevant water charges. Nevertheless, they shall factor these water
charges in their marginal profit calculations by adopting the right crop type and production
method, and by using efficient farming water saving techniques to achieve high profits
through “more crops per drop”. The authors urge farmers to understand that fees are used
to manage the water rationally, up to the end tap, for the benefit of all stakeholders.
However, Ellis (1993) firmly encouraged farmers to make some tradeoffs between on-farm
and off-farm income-generating activities, if efficiency was to achieve. This meant that they
could adopt off-farm activities if their farming water opportunity costs were higher than
elsewhere. They would thus avoid running deficient farming enterprises.
Finally, the incremental analysis showed that farmers’ efficiency was tied to the adjustment
of their crop water requirements with the level of soil moisture. If they could specialize to
less than three water friendly crop species for instance, they would improve their
productivity (GoK, 2007). Yet, they have also to minimize their farming water costs by using
other effective agronomic technologies and efficient on-farm management techniques such
as rational crop treatments and selection, and application of improved farming inputs
(fertilizers, pesticides, fungicides, and rodenticides). Finally, making good use of hydro-
political strategies in the context of “Integrated Watershed Management” (IWM) will also
help them. These include water consumption metering, evapo-transpiration quotas
allocation, green water saving and rainwater harvesting, payment for watershed services,
virtual water import and etc.
5. Conclusion
Traditional soil conservation methods having become rudimentary to control climate
change related risks, the Kenyan government needs to support programmes dealing with
disaster mitigation and adaptation to climate change. This involves making new adaptation
policies and direct investments in water projects, including strategic action plans for
dredging dams and irrigation schemes, and designing early warning systems for
preparedness to ENSO, among others. But prior to implementation of such policies and
schemes, the government needs to conduct a serious risk assessment that encompasses both
environmental and socio-economic risks. This study offered a novel approach for achieving
sustainability in a watershed and mitigating recurrent water shortages in farming. This
hydro-economic risk assessment and management would assist the government to foster the
implementation of “Integrated watershed management” (IWM) in different catchments of
the country. This would curve the trend of food shortages and energy crises in ASALs. The
government shall also encourage public-private partnerships through institutional linkages
between the “Water resources management authority” (WRMA), the “Water services
providers” (WSP), the “Water resource users' associations” (WRUA) and associations of
farmers (Cooperatives, Mutuals, NGOs, CBOs, etc). Thence, the government’s task will
Risk Management in Environment, Production and Economy
44
become easier, as farmers strive to improve their farming efficiency in the course of climate
change using efficient hydro-political strategies, and innovative agronomic technologies.
6. References
Brasington, J., El-Hames, A. & Richards, K. (1998). Hydrological Modelling In Humid Tropical
Catchments. David Harper & Thomas Brown, Chichester, UK
Brown, L.R. (2001). Eco-Economy: Building an Economy for the Earth. W.W.Norton & Company
Ltd., New York, USA
Burdge, R.J. (2008). The focus of impact assessment (and IAIA) must now shift to global
climate change. Environmental Impact Assessment Review, No 28, (2008), pp. 618–622
Ellis, F. (1993). Peasant Economics: Farm Households and Agrarian Development. Cambridge
University Press, ISBN 0 521 45711 4, Cambridge, UK
FAO. (ed.).(1995). Planning for Sustainable Use of Land Resources: Towards a New
Approach. FAO Land and Water Bulletin, No 2, (1995), pp. 25-46
Förch, G., Winnegge, R. & Thiemann, S. (2008). DAAD Alumni Summer School 2008: Water
Demand in Participatory Watershed Management – Ngaciuma-Kinyaritha
Watershed, Kenya - Final Report (Unpublished). Universität Siegen & Kenyatta
University, Meru, Kenya
Ganoulis, J. & Simpson, L. (2006). Environmental Risk Assessment and Management:
Promoting Security in the Middle East and the Mediterranean Region - Report of
the Working Group on Environmental Risk Assessment and Management. In:
Environmental Security and Environmental Management: The Role of Risk Assessment, B.
Morel & I. Linkov, (eds.), Springer, Dordrecht, The Netherlands
GoK. (2007). Kenya Vision 2030. Retrieved from
< />CHURE_July_2007.pdf>
González, A., Díaz de Terán, J.R., Francés, E. & Cendrero, A. (1995). The Incorporation of
Geomorphological Factors into Environmental Impact Assessment for Master
Plans: A Methodological Proposal. In: Geomorphological and Land Management in a
Changing Environment, F. Duncan, M. McGregor & D.A. Thompson, (Eds.), pp. 179-
193, John Wiley & Sons, Chichester, UK
GWP. (ed.).(2000): Integrated Water Resources Management. Global Water Partnership TAC,
No 4, (2000)
Hartnady, C. & Hay, R. (2004). Integrated Water Resource Management (IWRM) and
Disaster Reduction. Paper presented during the Africa Regional Consultation on
Disaster Reduction Workshop, (2-3 June 2004), Johannesburg, RSA
Jaetzold, R., Schmidt, H., Hornetz, B. & Shisanya, C. (2007). Farm Management Handbooks of
Kenya, Vol. 2, Part C East Kenya, Subpart C1 Eastern Province. Ministry of
Agriculture & GTZ, (eds.), pp. 1-571, Nairobi, Kenya
Jansky, L., M. Haigh & H. Prasad. (eds.).(2005). Sustainable Management of Headwater
Resources: Researches from Africa and India. United Nations University Press,
ISBN 92-808-1108-8, Tokyo, Japan
Kitissou, M. (2004). Hydropolitics and Geopolitics: Transforming Conflict and Reshaping
Cooperation in Africa. Africa Notes, (Nov-Dec. 2004)
Lal, R. (1993). Agricultural Sustainability and Soil Resilience. Desertification Control Bulletin,
No. 23, pp. 26-43
Toward a Hydro-Economic Approach for
Risk Assessment and Mitigation Planning of Water Disasters in Semi-Arid Kenya
45
Luwesi, C.N. (2009). An Evaluation of Efficient Use of Agricultural Watershed Resources
under Fluctuating Rainfall Regimes at Muooni Dam Catchment , Machakos
District, Kenya. Masters’ Thesis (Unpublished). Kenyatta University, School of Pure
and Applied Sciences, Nairobi, Kenya
Luwesi, C.N. (2010). Hydro-Economic Inventory in a Changing Environment – An
Assessment of the Efficiency of Farming Water Demand under Fluctuating Rainfall
Regimes in Semi-Arid Lands of South-East Kenya. Lambert Academic Publishing
AG & CO.KG, ISBN 978-3-8433-7607-5, Saarbrüken, Germany
Mati, B. (2006). Regional Perspective of Green Water Management. In: ISRIC First Green
Water Credits Workshop, ISRIC - World Soil Information,(ed.). Retrieved from
< />er+Credits.htm>saving and rainwater harvesting
Morgan, R.P.C. (1995). Soil Erosion and Conservation. Longman Group, Essex, UK
Mutisya, D. (1997). Socio-Economic and Agronomic Factors Influencing Soil Erosion in the
Masinga Dam Catchment. PhD Thesis (Unpublished). Kenyatta University, Faculty
of Arts, Nairobi, Kenya
Shakya NM (2001). Impact of Forest Clearing on Hydrology: Mathematical Modelling of
Khageri River Mathematical modelling of Khageri River. In: Ecohydrology, V.
Subramanian & A. Ramanathan, (eds.), pp. 355-368, Capital Publishing Company,
New Delhi, India
Shisanya, C.A. (1996). Chances and Risks of Maize and Bean Growing in the Semi-Arid Areas of
SE Kenya during Expected Deficient, Normal and Above Normal Rainfall of the Short
Rainy Seasons. Materialien zur Ostafrika-Forschung, Heft 14, ISBN 3-921-599-19-9,
Trier, Germany
Shisanya, C.A. & Khayesi, M. (2007). How is Climate Change Perceived in Relation to Other
Socio-Economic and Environmental Threats in Nairobi, Kenya. Journal of Climate
Change, Vol. 85 (2007), pp. 271-284
Soilerosion.net. (2007). Water Erosion and Rainsplash Redistribution. Retrieved from
<
Tiffen, M., Mortimore, M. & Gichuki, F. (1994). More People Less Erosion: Environmental
Recovery in Kenya. ACTS Press, Nairobi, Kenya
Thompson, D.A. & Scoging, H.M. (1995). Agricultural Terrace Degradation in South-East
Spain: Modelling and Management Strategies”. In: Geomorphological and Land
Management in a Changing Environment, F. Duncan, M. McGregor & D.A.
Thompson, (eds.), pp. 153-175, John Wiley & Sons, Chichester, UK
Uitto, J.I. & Schneider, J. (1997). Freshwater Resources in Arid Lands. United Nations
University Press, ISBN 92-808-0982-8, Tokyo, Japan
UNDP. (2007). Integrated Water Resources Management Plans. Retrieved from
<
Vishnudas S. (2006). Sustainable Watershed Management: Illusion or Reality? A Case of
Kerala State, India. Eburon Academic Publishers, ISBN-10: 90-5972-154-3, Delf , The
Netherlands
Waswa, P.F. (2006). “Opportunities and Challenges for Sustainable Agricultural Land
Management in Kenya”. In: Environment and sustainable development: A guide for
higher education in Kenya, Vol. 1, F. Waswa, S. Otor & D. Mugendi, (eds.), Kenyatta
Risk Management in Environment, Production and Economy
46
University, School of Environmental Studies & Humaine Sciences, ISBN 9966-776-
34-6, Nairobi, Kenya
World Bank. (2007). Water Topics: Monitoring and Evaluation. Retrieved from
<
WRMA. (2008). Athi Water Resources Management Authority Report on Muooni Dam
(Unpublished). Machakos, Kenya.
Zeiller, M. (2000). Methods of Socio-Economic Analysis of Rural Development. Universität
Göttingen, Institute of Rural Development, Göttingen. Retrieved from
<
3
Generation of Added Values Products
Supporting Risk Analysis
Massimo Musacchio
et al.
*
Istituto Nazionale di Geofisica e Vulcanologia, Rome
Italy
1. Introduction
Active volcanoes are spread all over the world and are located in specific areas correlated to
geologic structures. In the last 10,000 years more than 1300 volcanoes have erupted, but only
half of the eruptions have been reported in historical texts. It has been estimated that every
year 50 volcanic eruption may occur threating about 10 % of the worldwide population.
Considering the constant increase in human population and that many major cities are
placed in the proximity of active volcanoes, the number of people subjected to the risks
caused by volcanic eruptions is also increasing. Stated the problem dimension, it shall be
defined the method to counter act the crisis scenario. A volcanic eruption can be faced under
different point of view, on one side it can be deeply studied in order to improve the
knowledge of geophysical mechanism which drives the eruption itself, on the other hand it
is important to set up a service based on the integration of different dataset and aimed to
deliver added values products toward whose are in charge to manage the risk associated.
One response to last sentence is the Sistema Rischio Vulcanico (ASI-SRV) project funded by
the Italian Space Agency (ASI) in the frame of the National Space Plan 2003-2005 under the
Earth Observations section for natural risks management. The ASI-SRV Project is
coordinated by the Istituto Nazionale di Geofisica e Vulcanologia (INGV) which is
responsible, in Iyaly, at national level for the volcanic monitoring. The main goal of the ASI-
SRV project is to define, develop and demonstrate tools and products, based on the
integration Earth Observation data (EO) with data coming from the ground monitoring
network developed at national and local level, to support the risk management decision
procedures. The project philosophy is to implement, by incremental versions, specific
modules which allow to process, store and visualize through a dedicated Web-GIS tools,
added value information derived by EO and No EO data.
*
Malvina Silvestri
1
, Luca Merucci
1
, Stefano Corradini
1
, Claudia Spinetti
1
, Valerio Lombardo
1
, Boris
Behncke
1
, Lorenzo Guerrieri
3
, Gabriele Gangale
3
, Fabrizia Buongiorno
1
, Sergio Perelli
2
, Sergio Teggi
3
,
Sergio Pugnaghi
3
, Angelo Amodio
4
, Eugenio Sansosti
5
, Simona Zoffoli
6
and Chiara Cardaci
7
1
Istituto Nazionale di Geofisica e Vulcanologia, Rome, Italy
2
Advanced Computer System S.p.A, Rome
3
Università degli Studi di Modena e Reggio Emilia, Modena,
4
Galileian plus, via Vito Giuseppe Galati Rome,
5
Istituto per il Rilevamento Elettromagnetico dell'Ambiente-CNR, Naples,
6
Agenzia Spaziale Italiana, Agenzia Spaziale Italiana, Rome
7
Dipartimento della Protezione Civile Rome, Italy
Risk Management in Environment, Production and Economy
48
2. Rationale and goals
The “Volcanic Risk System (ASI-SRV)” is a three year (2007-2010) project, funded by the
Italian Space Agency (ASI), aimed at defining, developing and demonstrating (at a pre-
operational stage) a set of functionalities in support of a decisional system for volcanic risk
management based on the use of Earth Observation (EO) data. Moreover, this pilot project
supports research activities to fill in the gaps between the user needs and the available
technology. The Civil Protection organism represents the National Authority which will get
benefit from the space technology derived products for Volcanic Risk management and
monitoring. During the project lifetime a great effort was dedicated to understand the
organization of Department of the Civil Protection (DPC) in order to get specific
requirements for services and products to be developed in this pre-operational project
taking into account that the DPC is a division of the Italian Presidenza del Consiglio dei
Ministri, and represents the national authority charged for civil protection activity; It
addresses and coordinates all the forces operating on the Italian territory, during the
emergency phases through the National warning system provided by DCP and Regions by
the Functional Centres National Network. The main purpose of CFRV is to collect, share and
synthesize data related to volcanic hazard provided by the monitoring centres (e.g. INGV).
Functional Centres are the operative support units, which are able to collect, elaborate and
exchange every kind of data provided from Competence Centres. These are Institutions
which provide services, information, data, elaboration, technical and scientific contributions
for specific topics.
During the volcanic emergency phases the functional centres for volcanic risk is supported
by Synthesis Group. This group includes volcanologist of the High Risks Committee, the
researchers of Competence Centre involved in the monitoring activities and a civil
protection manager/officer expert in the risk evaluation. The Office “General Direction of
Prevision, Evaluation, Prevention and Mitigation of Natural Risks” takes part in many
European projects and participated in civil protection interventions in foreign countries.
Operative Centre for Volcanic Risk is the scientific decision-support section of the DPC. For
that reasons the End User is the Italian Department for Civil Protection (DPC).
The ASI-SRV system and products have been defined through a detailed User requirement
survey that has been started in the Feasibility Study, funded by ASI in 2004 and integrated
with information acquired in other project such as FP6-PREVIEW (2005-2008). The system
architecture is based on different modules that could be activated depending of the Volcanic
Phase (figure 1) addressed by the Italian Civil Protection Department (DPC):
Early Warning (Knowledge and Prevention)
Crisis
Post-Crisis
Moreover the system is able to add new modules in order to have the flexibility to improve
its performance by using new algorithms or new sensors. ASI-SRV has developed, in its
final version, a centralized HW-SW system located at INGV which will control two
complete processing chains, one located at INGV for Optical data, and the other located at
CNR-IREA for SAR data. The produced results will be disseminated through a W
eb-GIS
interface which will hallow the End User to overview and assimilate the products in a
compatible format respect to local monitoring needs in order to have an immediate use of
the provided information.