Vibration Analysis and Control New Trends and Developments Part 15 pptx
Bạn đang xem bản rút gọn của tài liệu. Xem và tải ngay bản đầy đủ của tài liệu tại đây (1.11 MB, 14 trang )
Changes in Brain Blood Flow on Frontal Cortex Depending on Facial Vibrotactile Stimuli
339
amount of salivation during 114 and 180 Hz-S vibrotactile stimulation for 3 min,
respectively. We finally examined the amount of salivation on resting stimulation for 3 min
(Fig. 1D). We conducted these tests with 19 normal subjects (6 males, 13 females; average
age, 22 years). This experiment was performed between 3 and 5 pm in a temperature-
controlled, quiet room.
Fig. 1. Pictures and diagrams of the vibratory machine (A), experimental techniques (B and
C) and experimental schedules (D and E). B and C. Measuring salivation amount during
vibrotactile stimulation of the bilateral masseter muscle belly (on the parotid glands, B) and
the bilateral angle of the mandibular body (on the submandibular glands, C), using dental
cotton rolls positioned at the opening of the secretory ducts (right and left sides of parotid
glands and right and left sides of submandibular and sublingual glands). D and E. Time
schedules for the vibrotactile stimuli, respectively. The designations 89 Hz-S, 114 Hz-S and
180 Hz-S indicate vibrotactile stimuli at 89, 114, and 180 Hz, respectively, with a single
motor. The designations 89 Hz-D and 114 Hz-D represent vibrotactile stimuli of 89 and 114
Hz with double motors. We allowed a 5-min recovery time shown as “rest hours.” Variation
per day in the effective salivation during 4 or 5 days of continuous use at 89 Hz-S
vibrotactile stimulation for the right and left parotid glands, and the time schedule as shown
in Figure 1D was repeated by subjects for 4 or 5 days.
After the three frequencies were tested on the parotid glands, we determined the most
effective frequencies, which were 89 and 114 Hz-S. Second, we subjected the submandibular
glands to the two frequencies (89 and 114 Hz) and two different amplitudes (Fig. 1C, 1E).
Vibration Analysis and Control – New Trends and Developments
340
The amplitude of the oscillating bodies during vibrotactile stimulation was measured with a
CCD laser displacement gauge (LK-G3000, Keyence Co., Osaka, Japan). We examined the 89
and 114 Hz frequencies and used oscillating bodies added as the frequency with double
motors (single motor had a 1.9 µm amplitude, 89 and 114 Hz-S, and double motors had a 3.5
µm amplitude, 89 and 114 Hz-D). Specifically, 89 and 114 Hz-S, and 89 and 114 Hz-D were
used in the next experiment. We examined the amount of salivation for the four frequencies
(Fig. 1E). We conducted these experiments with 17 normal subjects (15 males, 2 females;
average age, 22 years) for the resting-stimulation examination. This experiment was
performed between 3 and 5 pm in a temperature-controlled, quiet room.
The most effective salivation amount by vibrotactile stimulating the parotid glands occurred
at 89 Hz-S, so we examined changes in salivation for 4 or 5 continuous days with the same
time schedule (Fig. 1D). We also investigated the adaptation periods during continuous use
of vibrotactile stimulation for 4 or 5 continuous days in the same subjects. We conducted
resting-stimulation examinations with 26 normal subjects (11 males and 15 females; average
age 25 years). This experiment was performed between 3 and 5 pm in a temperature-
controlled and quiet room.
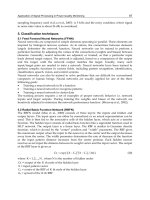
2.3 BBF on the frontal cortex
The recording was conducted using a functional near-infrared spectroscopy (fNIRS) OEG16
instrument (Spectratech Inc., Shelton, CT, USA) from the frontal cortex. As shown in Figures
4A and 4B, the fNIRS probe assembly consisted of six LEDs as light sources, each of which
emitted two wavelengths, 770 nm and 840 nm, and six photodiodes as detectors (Fig. 4A,
4B). The sources and detectors were symmetrically arranged in an area of 3.0×14.0 cm, with
a nearest source-detector separation of 2.0 cm, and measurement points were at 16 points on
the frontal cortex. During scanning, a Velcro band held the probe assembly securely to the
forehead of subjects and extended from ear to ear horizontally and from hairline to
eyebrows vertically. Each of the LEDs was turned on in sequence, and the diffuse NIR light
from each source was acquired through the cortical region at the nearest detector. Thus, 16
source-detector pairs (channels) in total were measured (Fig. 4B). The sampling rate across
all 16 channels was 0.76 Hz. In particular, we showed a 16-channel computerized analysis
(as shown in Fig. 4B) and the original waves of four channel recording areas in the central
parts (original waves in Fig. 4C recorded over the selected areas in Fig. 4A).
We recorded BBF during vibrotactile stimulation. We also conducted a BBF experimental
recording as subjects listened to classical music (Mozart, Eine kleine Nachtmusik). We
conducted the examinations with 10 normal subjects (6 males, 4 females; average age, 22
years) for the resting-stimulation and classical music examinations. This experiment was
performed between 3 and 5 pm in a temperature-controlled, quiet room.
2.4 Pulse frequency during vibrotactile stimulation
We recorded changes in pulse frequency (P225F, Nihon-Kohden Co., Tokyo, Japan) during
vibrotactile stimuli at 89 and 114 Hz-S. Because the hemoglobin in blood absorbs red light
irradiation, a pulse wave was calculated using a ratio between red light irradiation (660 µm)
and infrared light (940 µm). The pulse frequency indicated by this apparatus was measured
by averaging the pulse frequency during the previous eight pulses (Fig. 5C). First, the pulse
frequency during rest was recorded for 1 min, and then those during 89 and 114 Hz-S
vibrotactile stimuli were recorded for 2 min each. A 1-min rest period was taken between
Changes in Brain Blood Flow on Frontal Cortex Depending on Facial Vibrotactile Stimuli
341
the 89 and 114 Hz-S vibrotactile stimuli. Finally, the pulse frequency during rest was
recorded for 30 s. We conducted these examinations with 10 normal subjects (6 males, 4
females; average age, 22 years). This experiment was performed every day between 3 and 5
pm in a temperature-controlled, quiet room.
3. Results
3.1 Vibrotactile stimuli on the parotid and submandibular glands
We examined the differences between vibrotactile stimulating of parotid and
submandibular glands (Fig. 1B, 1C). First, we tested three frequencies of vibrotactile
stimulation, 89, 114, and 180 Hz-S, on the parotid glands and determined the frequency
most effective for salivation (Fig. 2A). We found that the most effective frequencies for
submandibular gland salivation were 89 Hz-S, 89 Hz-D, 114 Hz-S, and 114 Hz-D (Fig. 2B)
and that the erase most effective stimulation was 89 Hz-S (Fig. 2A, 2B; p < 0.05).
We examined the most effective salivation in each gland, including the right parotid, left
parotid, right submandibular and sublingual and left submandibular and sublingual glands.
As a result, the most effective stimulation for salivation of the parotid and submandibular
glands was 89 Hz-S (Fig. 2A-a, 2B-a; resting salivation, 0.89±0.61 mL; 89 Hz-S, 1.46±0.90 mL;
89 Hz-D, 1.04±0.78 mL; 114 Hz-S, 0.93±0.76 mL and 114 Hz-D, 0.80±0.53 mL). Furthermore, a
significant difference was observed between the vibrotactile stimulation at 89 Hz-S and that
at 114 Hz-D (paired t-test; p < 0.05). No other significant difference in each gland was
observed (Fig. 2A-b, 2A-c, 2B-b, 2B-c, 2B-d and 2B-e).
Fig. 2. Salivation from the parotid glands (A) and the submandibular glands (B) after each
vibrotactile stimulation. A-a and B-a. Total number of salivations after each vibrotactile
stimulation. A-b, A-c, B-b, B-c, B-d and B-e. Salivation amount for each gland after various
vibrotactile stimuli. The increased salivation between 89 Hz-S and 114 Hz-D was
significantly different (paired-t-test; p < 0.05). Stimulating the parotid or submandibular
glands at 89 Hz-S was the most effective for salivation. Salivation was not different among
the various glands (parotid and submandibular and sublingual glands on the right and left
sides).
3.2 Variation in effective salivation per day during continuous vibrotactile stimulation
Because patients with hyposalivation often have a psychiatric disorder, we conducted an
experiment to realistically approximate natural conditions. We examined whether effective
salivation occurred continuously when vibrotactile stimulation was performed daily. In
Vibration Analysis and Control – New Trends and Developments
342
particular, we used the 89 Hz-S from the previous experiment, and because no difference
was found between vibrotactile stimulation of the parotid and submandibular glands, we
analyzed salivation evoked by vibrotactile stimulation of the parotid glands. Normal
subjects (15 males, 11 females; average age, 25 years) used this apparatus continuously for 4
or 5 days at the same time and place (Fig. 3). None of the glands (right and left parotid
glands, and right submandibular and sublingual glands) showed an attenuated response.
Regression curves for each gland (Fig. 3A, 3B, 3C and 3D) showed non-adaptation to
continuous stimulation, because they showed parallel or over-increasing curves, indicating
that continuous usage of this apparatus should not be a problem.
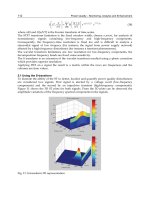
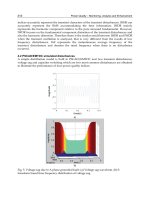
Fig. 3. Variation in effective salivation per day during 4 or 5 days of continuous use of 89
Hz-S vibrotactile stimulation in the right (A) and left parotid (B) and the right (C) and left
submandibular and sublingual glands (D). The time schedule, as shown in Figure 1D, was
repeated by subjects for 4 or 5 days. Vertical lines indicate the increase and decrease in
vibrotactile salivation versus resting salivation (it is shown by a positive value when the
vibrotactile salivation was greater than the resting salivation, and by a negative value when
the vibrotactile salivation was lower than the resting salivation). Abscissa lines indicate time
(4–5 days). Solid lines indicate the regression curve. There was no adaptation to the 89 Hz-S
vibrotactile stimulation in the parotid, submandibular, or sublingual glands.
3.3 Relationship between each stimulation and fNIRS activity
The OEG16 spectroscope was used to record the hemoglobin concentration in the BBF from
areas in the frontal cortex using 16 channels. In particular, we measured original waves in
four channel recording areas (circled 1, 2, 3, and 4 in Fig. 4A). Figure 4B shows the schema of
the oxyhemoglobin (oxyHb) concentration evoked by analyzing 16 channels during
vibrotactile stimulation at 89 Hz-S. The contrasting red and blue zones indicate activity
strength, and no response is shown in white (Fig. 4B). The results showed very weak oxyHb
concentrations during the 89 Hz-S vibrotactile stimulation, as shown in Figure 4C-b.
We provided evidence of the real waves on the central parts (circled 1, 2, 3, 4; Fig. 4A) of the
BBF recording in 16 channels (Fig. 4C). The red lines indicate changes in oxyHb
concentrations, the blue lines indicate deoxyhemoglobin (deoxyHb), and the green lines
indicate total hemoglobin (totalHb) during salivation measurements at rest and for each
vibrotactile stimulation frequency. The first waves in Figure 4C(a) indicate changes during
the resting condition, the second waves (b) show changes during 89 Hz-S vibrotactile
stimulation, the third waves (c) show changes during 89 Hz-D, the fourth waves (d) show
changes during 114 Hz-S, the fifth waves (e) show changes during 114 Hz-D and the bottom
waves (f) show changes during “A-” phonation. Each wave was recorded for 3 min, and
each vibrotactile stimulation provided for 2 min is shown between the vertical lines.
However, “A-“ phonation is shown by four applicable vertical lines. Although each wave
A
B
C
D
days
ml
1.5
0
-0.5
0.5
-1.5
ml
1.0
0.5
0
-0.5
-1.0
Changes in Brain Blood Flow on Frontal Cortex Depending on Facial Vibrotactile Stimuli
343
Fig. 4. A. Frontal cortex recording sites. The circled numbers 1, 2, 3, and 4 indicate the
recording sites for each wave, as shown in C. B. A computerized numerical analysis of
variations in oxyhemoglobin (oxyHb) concentration during 89 Hz-S vibrotactile stimulation.
Red (plus) and blue shading (minus) indicates differences in frontal cortex activation,
whereas the white band indicates non-activation. C. Changes in blood brain flow during 2
min of various vibrotactile stimuli and vocalizing “A-“ sounds are shown at the central
areas of the frontal cortex. C-a. During the resting condition. C-b. During 89 Hz-S
vibrotactile stimulation. C-c. During 89 Hz-D vibrotactile stimulation. C-d. During 114 Hz-S
vibrotactile stimulation. C-e. During 89 Hz-D vibrotactile stimulation. C-f. While vocalizing
“A-“ sounds. The spaces between the solid bars (2 min.) represents the stimulating period.
However, vertical lines during vocalizing “A-“ sounds were the timely accomplishment
between good winds. Red, blue, and green lines indicate oxyhemoglobin, deoxyhemoglobin,
and total hemoglobin concentrations, respectively.
Vibration Analysis and Control – New Trends and Developments
344
measured during resting salivation, at 114 Hz-D, and during “A-“ phonation showed
increased activity, the 89 Hz-D and 114 Hz-S vibrotactile stimuli showed decreased
activities. However, vibrotactile stimulation at 89 Hz-S was fairly close to zero value
(0.14±1.10 mM mm· s). In particular, when we focused on changes in oxyHb based on these
results, increased oxyHb occurred during “A-” phonation, the resting condition (5.20±6.78
mM mm· s) and at 114 Hz-D of vibrotactile stimulation (-0.13±3.54 mM mm· s), whereas a
decrease in oxyHb was revealed during vibrotactile stimulation at 114 Hz-S (-5.48±7.12 mM
mm· s) and at 89 Hz-D (-2.18±10.13 mM mm· s). However, oxyHb during vibrotactile
stimulation at 89 Hz-D (0.29±2.26 mM mm· s) was near zero, similar to all of the data
(oxyHb, deoxyHb, totalHb). From these results, we computed integral rates of oxyHb
during 2 min, as shown by the area between the longitudinal bars in the central part (circled
1, 2, 3, and 4) of the recording wave (Fig. 4C).
Furthermore, we examined the integral rates while subjects listened to classical music for 2
min. We divided the subjects into two groups: one group did not like to listen to classical
music (2.96±6.40 mM mm· s, n = 7) whereas the other group did (0.85±0.05 mM mm· s, n = 3;
Fig. 5A and 5B, respectively). Although the subjects who enjoyed the music did not show a
larger spread of values (±SD), the latter did. In particular, vibrotactile stimulation at 89 Hz-S
revealed a small similar spread of values. Each integral rate during the vibrotactile
stimulation at 89 Hz-S and while the listening to classical music showed similar averages
and SDs (Fig. 5B-b).
3.4 Pulse frequency during vibrotactile stimulation and frontal cortex fNRS activity
We chose three typically responding subjects, as shown in Figure 5C. One subject showed a
decrease in pulse frequency during both 89 Hz-S and 114 Hz-S vibrotactile stimulation,
while the other two showed a decrease in pulse frequency at 89 Hz-S and an increase during
114 Hz-S stimulation (Fig. 5C). We divided the two groups into decrease pulse frequency
and increase pulse frequency groups, based on 114 Hz-S vibrotactile stimulation. Although
the 89 Hz-S vibrotactile stimulation created a sense of relaxation, the 114 Hz-S vibrotactile
stimulation is either liked or disliked. Specifically, the 89 Hz-S vibrotactile stimulation will
produce parasympathetic activity and evoke a relaxation response.
4. Discussion
4.1 Adaptation to vibrotactile stimulation
Continuous exposure to various sensory stimuli induces adaptation (Principles of Neural
Science. 2000c). Thus, we examined whether adaptation occurred to the vibrotactile
stimulation when normal subjects continuously used this apparatus every day for 4 or 5
days. However, we first investigated changes in total saliva secretion quantities by normal
subjects in response vibrotactile stimulation by measuring the weights of cotton rolls set on
the ducts of each gland. For the repeated measurements, we defined a recovery time of 5
min from a previous experiment, as resting salivation values before and after stimulating
salivation were the same (Fig. 1D, 1E).
The most effective frequency for increasing the total amount of salivation during vibrotactile
stimulation of the parotid and submandibular glands was 89 Hz-S (Fig. 2A-a, 2B-a).
Furthermore, as shown in Figures 2A-b and 2A-c, and 2B-b, 2B-c, 2B-d and 2B-e, no
difference was found among the various glands. Because 89 Hz-S vibrotactile stimulation of
the parotid and submandibular glands showed the same results in all glands, the results
Changes in Brain Blood Flow on Frontal Cortex Depending on Facial Vibrotactile Stimuli
345
might not be directly affected by the vibrotactile stimulation on the parotid and
submandibular glands. Specifically, the increased salivation evoked by vibrotactile
stimulation at 89 Hz-S may be the result of somatosensory input from the facial skin and
intraoral cavity.
Burdette and Gale (1988) reported that tonic masticatory muscle activity may be effective for
treating patients with myofacial pain dysfunction. Furthermore, Vrjama and Vanharantra
(1994) reported that discographically painful discs always decrease pain during a vibration
examination. These results assume that the peripheral stimuli provided by the vibration
arrive at the central nervous system (spinal cord and brain stem) and that these effects are
produced by a depressant effect on the cerebral cortex, depending on the somatosensory
information, although they are not clearly organized. We believe that their interpretation
does not adequately explain this situation. We suggest that vibrating stimuli may promote
parasympathetic effects by inhibiting the sympathetic effects elicited by pain. We know
serous salivation is evoked only by a parasympathetic effect. Furthermore, we found that
salivation production responded to a specific frequency and amplitude.
Vibration may effectively activate the muscle spindles of the masseter muscles, because
the tonic vibration reflex (TVR) of the muscle spindles activates with 80–100Hz vibrations
(Desmedt, Codaux 1975). However, we showed the same salivation response in various
glands. We showed that increased salivation evoked by 89 Hz-S vibrotactile stimulation
would be produced by somatosensory inputs from facial skin and the intraoral cavity,
suggesting that increased salivation is not produced by a direct effect of muscle
contraction.
Next, we examined the physiological characteristics of adaptation to vibrotactile stimulation
by testing adaptation in 26 normal subjects for 4 or 5 days. Patients with decreased
salivation (hyposalivation) would be using this machine daily; thus, we wanted to
realistically approximate actual conditions. The results suggested that 89 Hz-S vibrotactile
stimulation to the facial skin of the masseter belly may be appropriate for patients with
decreased salivation, because the regression curve (negative gradient) did not decrease with
continuous use of the apparatus (Fig. 3).
4.2 fNIRS activity in the frontal cortex
The frontal cortex is associated with cognitive function, including memory, attention,
abstract reasoning and higher cognitive activity (Principles of Neural Science. 2000a).
We recorded changes in BBF in the frontal cortex to examine typical changes in fNIRS
parameters based on increases in oxyHb and totalHb and decreased deoxyHb, as reported
by Sakatani et al. (2006). In particular, increased fNIRS activity patterns in the frontal cortex
are associated with speech, and decreased fNIRS activity patterns in the frontal cortex are
associated with playing TV games and are thought to be dependent on network differences
(Sakatani et al. 1999). The fNIRS responses may be influenced by mental stability, because
they indicate control of sophisticated mental functions produced by complex networks.
Because fNIRS activity increases while subjects are speaking and decreases while they play
TV games, we suggest that the autonomic system has a profound effect. Specifically, we
suggest that fNIRS activity during conscious speaking is associated with a sympathetic
effect, and that playing a TV game is associated with reflective movement under a non-
sympathetic effect.
The effect of 89 Hz-S vibrotactile stimulation was almost zero for oxyHb, deoxyHb, and
totalHb (Fig. 4C-b). In particular, the fNIRS activity focuses on the excitatory behaviours to
Vibration Analysis and Control – New Trends and Developments
346
increase oxyHb. In animal experiments, changes in oxyHb and BBF are related, and fNIRS
activity changes in oxyHb are used as a neuronal activity index (Hoshi et al. 2001). Thus,
changes in oxyHb produced by an 89 Hz-S vibrotactile stimulation on the parotid and
submandibular glands may indicate mental stability. The reason may be due to the same
tendency of oxyHb concentration between the 89 Hz-S vibrotactile stimulation and subjects
who liked to listen to classical music (Fig. 5B-b). People relax when they listen to classical
music, so we think that 89 Hz-S vibrotactile stimulation is produced by excitation of the
parasympathetic system. In particular, although the 89 Hz-S vibrotactile stimulation always
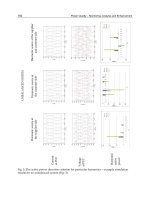
Fig. 5. Integral values of oxyhemoglobin (oxyHb) concentration produced by vibrotactile
stimuli for 2 min are shown in A and B. A. Integral values produced in the resting condition
and after each stimulation (n = 17). B. Integral values produced in the resting condition,
listening to classical music (Mozart, Eine kleine Nachtmusik), 89 Hz-S and listening to noise
(n = 10). One group enjoyed listening to classical music (D-b, n = 3), and one did not (D-a, n
= 7). C. Changes in pulse frequency during vibrotactile stimulation (89 Hz-S and 114 Hz-S).
We assessed 10 normal subjects, and changes in pulse frequencies are shown for three
typical subjects. All subjects had decreased pulse frequency during 89 Hz-S vibrotactile
stimulation, although the 114 Hz-S vibrotactile stimulation divided the subjects into two
groups: one showed an increased pulse frequency and the other showed a decreased pulse
frequency.
Changes in Brain Blood Flow on Frontal Cortex Depending on Facial Vibrotactile Stimuli
347
revealed parasympathetic excitation, listening to classical music showed different activity
depending on music preference (Fig. 5B-a, 5B-b). Those subjects who enjoyed Mozart
classical music accepted it as relaxing, whereas those who disliked it perceived it as noise.
However, 89 Hz-S vibrotactile stimulation may produce a balanced mental condition,
regardless of preference. This phenomenon suggests that the effect caused by the 89 Hz-S
vibrotactile stimulation and the feeling sensed by those listening to Mozart who enjoyed it
may be the same. Thus, we suggest that these feelings were produced by parasympathetic
activity.
Burdette and Gale (1988) reported that tonic masticatory muscle activity might be effective
for treating patients with myofascial pain-dysfunction. Furthermore, Vrjama and
Vanharantra (1884) reported that discography always results in less pain during a vibration
examination. They suggested that peripheral stimuli produced by the vibration arrive at the
central nervous system (spinal cord and brain stem) and that these effects are caused by a
depressant effect on the cerebral cortex, depending on the somatosensory information
(Burdette and Gale, 1988; Vrjama and Vanharantra, 1884). However, we believe that
somatosensory information via the thalamus produces excitability in the primary
somatosensory cortex. Furthermore, somatosensory information in the primary
somatosensory cortex may project to the frontal cortex via the parietal association area
(Handbook of Neuropsychology 1994), and this information may cause the excitatory
effects.
4.3 Parasympathetic effect based on 89 Hz-S vibrotactile stimulation
When we are frightened, our heartbeat increases (Principles of Neural Science. 2000b). The
parasympathetic nervous system is responsible for rest and digestion, and maintaining basal
heart rate, respiration, and metabolism under normal, resting conditions (Principles of
Neural Science. 2000b). We examined the parasympathetic effects with changes in pulse
frequency during vibrotactile stimulation. We showed changes in pulse frequency in typical
normal subjects in response to 89 Hz-S and 114 Hz-S vibrotactile stimuli (Fig. 5C). These
results showed a decrease in pulse frequency during 89 Hz-S stimulation, but an increase in
pulse frequency following the 114 Hz-S vibrotactile stimulation, except for one subject.
Specifically, the 114 Hz-S vibrotactile stimulation showed variable results, because one
subject was relaxed, whereas the others were not. However, the 89 Hz-S vibrotactile
stimulation resulted in decreased pulse frequency in all subjects, suggesting that stimulating
the face evoked parasympathetic stimulation (Fig. 5C). Thus, the parasympathetic activity
elicited by 89 Hz-S vibrotactile stimulation, may produce an increase in salivation. We
reiterate that a relaxed feeling was produced in all subjects during 89 Hz-S vibrotactile
stimulation.
We consider the following schema for this phenomenon. Vibrotactile stimulation to the face
produces somatosensory information activity in the orofacial region, which projects to the
trigeminal sensory complex (principal trigeminal sensory nuclei and trigeminal spinal tract
nuclei) and solitary nuclei (Fig. 6). This somatosensory information is divided into the
parabrachial nuclei, thalamus, and hypothalamus. Information projecting to the
parabrachial nuclei arrives in the hypothalamus, amygdala, and frontal cortex and then to
the thalamus and primary somatosensory cortex (SI). Petrides reported that information
travelling to the SI goes around the frontal cortex via the parietal association area
(Handbook of Neuropsychology 1994). We think that somatosensory information travelling
Vibration Analysis and Control – New Trends and Developments
348
via the parietal association area represents excitability. If the BBF in the frontal cortex via the
parietal association area is excitable and that via the parabrachial nucleus is inhibitory,
which wave forms will be revealed? We believe that BBF to the frontal cortex evoked by
various stimuli shows various wave forms, depending on the condition. In particular, the 89
Hz-S vibrotactile stimulation may produce a relaxed feeling.
4.4 Projection of autonomic activity in the frontal cortex
Autonomic function must ultimately be coordinated by adapting to environmental
changes. The autonomic nervous system is a visceral sensory and motor system, and the
visceral reflex is mediated by local circuits in the brain stem or spinal cord. These reflexes
are regulated by networks of central autonomic control nuclei in the brain stem,
hypothalamus and forebrain and are not under voluntary control, nor do they impinge on
consciousness, with a few exceptions (Principles of Neural Science. 2000b). However, we
think that changes in BBF in the frontal cortex may represent autonomic activity. This
coordination is carried out by a highly interconnected set of structures in the brain stem
and forebrain that form a central autonomic network (Fig. 6 and Principles of Neural
Science. 2000b). Furthermore, the key component of this network is initiated by integral
information in the parabrachial nucleus of the solitary tract and trigeminal sensory
complex in the brain stem. These nuclei receive inputs from somatosensory and visceral
afferents of the trigeminal, facial, glossopharyngeal, and vagus nerves and then use the
information to modulate autonomic function. The somatosensory and visceral sensory
outputs from the trigeminal and solitary nuclei are relayed to the forebrain and amygdala
by the parabrachial nucleus, which is important for the behavioural responses to
somatosensory, taste, and other visceral sensations (Principles of Neural Science. 2000b),
and the information arriving in the amygdala will produce the pleasure-pain feeling. In
contrast, the parabrachial nucleus is a taste-sensation relay nucleus in rats (Scott and
Small 2009), and the rodent parabrachial nucleus sends integral limbic and reward system
information (Yamamoto et al. 2009). Although their function in humans is unknown, we
think that these nuclei may play a role as a relay nucleus for the autonomic system. On
the other hand, we showed a projection from the trigeminal sensory complex, as the
parabrachial nucleus can also record the response to tactile stimuli from facial skin
(Chiang et al, 1994). Furthermore, somatosensory information is projected to the primary
somatosensory cortex and is then relayed to the frontal cortex, via the parietal association
area (Handbook of Neuropsychology 1994).
What does BBF activity in the frontal cortex mean? We think that the information via the
parabrachial nucleus dominates that via the parietal association area. Thus, information in
the frontal cortex is assumed to arrive via the parabrachial nucleus area. The hypothalamus
is the centre of the autonomic system. We perceive emotional experiences such as fear,
pleasure, and contentment and these reflect the interplay between higher brain centres and
sub-cortical regions, such as the hypothalamus and amygdala (Principles of Neural Science.
2000a). Patients in whom the prefrontal cortex or the cingulate gyrus has been removed are
no longer bothered by pain, but exhibit appropriate autonomic reactions; however, the
sensation is not perceived as a powerfully unpleasant experience (Principles of Neural
Science. 2000a). Furthermore, the anatomical connections of the amygdala with the temporal
(cingulate gyrus) and frontal (prefrontal) association cortices provide the means by which
visceral and somatosensory sensations trigger a rich assortment of associations or the
cognitive interpretation of emotional states (Principles of Neural Science. 2000b).
Changes in Brain Blood Flow on Frontal Cortex Depending on Facial Vibrotactile Stimuli
349
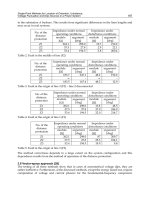
Fig. 6. Pathways distributing somatosensory information in the brain. Somatosensory
information evoked by vibrotactile stimulation is relayed by the trigeminal sensory complex
and solitary and parabrachial nuclei, which arrives at the hypothalamus, thalamus,
amygdala and frontal cortex, respectively. The autonomic system (particularly the
parasympathetic nervous system) produces increased salivation. The lateral branch of the
trigeminal sensory nucleus is projected to the parabrachial nucleus. Information from the
parabrachial nucleus is received by the amygdala and frontal cortex. Furthermore,
somatosensory information is projected to the primary somatosensory cortex and relayed to
the frontal cortex via the parietal association area. Thus, this information finally leads to a
relaxed feeling and BBF waves reflect parasympathetic activity (modified from schemas in
Principles of Neural Science 2000b and Handbook of Neuropsychology 1994).
Vibration Analysis and Control – New Trends and Developments
350
Finally, we showed oxyHb activity during “A-“ phonation (Fig. 4C-f). Sympathetic activity
increases when we speak. From our data, the facial stimulation effects evoked by 89 Hz-S
vibrotactile stimulation evoked parasympathetic activity, depending on the decrease in
pulse frequency, and oxyHb concentration reflected the non-activation of BBF waves in the
frontal cortex. We suggest that the 89 Hz-S vibrotactile stimulation produced a relaxing
sensation depending on excitation in the amygdaloid complex and parasympathetic activity
in the hypothalamic nuclei. The relaxing sensation was reflected by the oxyHb concentration
of the BBF wave in the frontal cortex.
5. Conclusion
We showed that the most effective salivation response was produced by an 89 Hz
vibrotactile stimulation with a single motor (1.9 µm amplitude) on the parotid glands, as
reported previously (Hiraba et al. 2008). In this study, we focused on the submandibular
glands secreting the greatest amount of saliva and explored changes in salivation during
stimulation of the submandibular glands with 89 Hz and 114 Hz vibrotactile stimuli using
single (89 Hz-S and 114 Hz-S) or double motors (3.5 µm amplitude, 89 Hz-D and 114 Hz-D),
respectively. The increased salivation evoked by the 89 Hz-S vibrotactile stimulation was
produced by somatosensory inputs from the facial skin and intraoral cavity. We examined
the effects of vibrotactile stimulation on adaptation in normal subjects to test the effect of
continuously using this apparatus every day by patients with hyposalivation. The results
showed no adaptation with continuous use. Furthermore, we investigated changes in BBF in
the frontal cortex during vibrotactile stimulation. Stimulating the submandibular and
parotid glands at 89 Hz-S resulted in the most salivation. OxyHb concentrations in the BBF
to the frontal cortex during an 89 Hz-S vibrotactile stimulation were the same as those in
subjects who preferred listening to classical music. Furthermore, parasympathetic activity
decreased pulse frequency during an 89 Hz-S vibrotactile stimulation, suggesting a close
relationship between the BBF waves in the frontal cortex and the autonomic system. An
89 Hz-S vibrotactile stimulation may produce relaxation and salivation may be increased by
parasympathetic excitation.
6. Acknowledgements
This work was supported by a Sogoshigaku research grant and the Sato Fund of Nihon
University School of Dentistry, as well grants from the Ministry of Education and Grants-in-
Aid for Scientific Research (21592539).
7. References
Ueda K. 2005. Sessyoku enge rehabilitation. In: Uematsu H, Inaba S, Watanabe M, editors.
Koureishya Shika guidebook. Tokyo: Ishiyaku. pp 248–275 (in Japanese).
Hiraba H., M. Yamaoka, M. Fukano, K. Ueda and T. Fujiwara (2008) Increased secretion of
salivary glands produced by facial vibrotactile stimulation. Somatosensory and
Motor Research 25, 222–229.
Changes in Brain Blood Flow on Frontal Cortex Depending on Facial Vibrotactile Stimuli
351
Despopoulos, A. and Silbernagl, S (2003) 10 Nutrition and digestion. In: Color Atlas of
Physiology. 5
th
ed. New York, Medical science international Ltd. pp
226–265.
Yamaoka, M., Hiraba, H., Ueda, K. and Fujiwara, T. (2007) Development of a vibrotactile
stimulation apparatus for orofacial rehabilitation. Nihondaigaku Shigakubu Kiyou 35 ,
pp. 13–18. (in Japanese)
Burdette BH, Gale EN. (1988) The effects of treatment on masticatory muscle activity and
mandibular posture in myofascial pain-dysfunction patients. J Dent Res 67; 1126–
1130.
Vriama M, Vanharanta H.(1994) Bony vibrotactile stimulation: A new, non-invasive method
for examining intradiscal pain. Eur Spine J 3; 233–235.
Desmedt JE, Codaux E. (1975) Vibration induced discharge patterns of single motor unit in
the masseter muscle in man. J Physiol 253; 420–442.
Ivarsen S., Kupfermann F., Kandel ER. (2000a) 50, Emotional States and Feelings. In: Kandel
ER., Schwartz JH., Jessell TM., editors, Principles of neuronal science, 4
th
ed, New
York: McGraw-Hill. pp 982–997.
Sakatani K, Yamashita D, Yamanaka T (2006) Changes of cerebral blood oxygenation and
optical path length during activation and deactivation in the prefrontal cortex
measured by time-resolved near infrared spectroscopy. Life Sciences 78;
2734–2741.
Sakatani K, Lichty W, Xie Y (1999) Effects of aging on language-activated cerebral blood
oxygenation changes of the left prefrontal cortex. Near infrared spectroscopy
study. J Stroke Cerebrovascular Dis. 8; 398–403.
Hoshi Y, Kobayashi N, Tamura M. (2001) Interpretation of near-infrared spectroscopy
signals: A study with a newly developed perfused rat brain model. J Appl Physiol.
90; 1657–1662.
Ivarsen S., Ivarsen L., Saper CB. (2000b) 49, The Autonomic Nervous System and the
Hypothalamus. In: Kandel ER., Schwartz JH., Jessell TM., editors, Principles of
neuronal science, 4
th
ed, New York: McGraw-Hill. pp 960–981.
Gardner EP, Martin JH. (2000c) 21, Coding of sensory information. In: Kandel ER., Schwartz
JH., Jessell TM., editors, Principles of neuronal science, 4
th
ed, New York: McGraw-
Hill. pp 411–429.
Chiang CY, Hu W and Sessle BJ (1994) Parabrachial area and nucleus raphe magnus-
induced modulation of nociceptive and non-nociceptive trigeminal subnucleus
caudalis neurons activated by cutaneous or deep inputs. J. Neurophysiol. 71,
2430–2445.
Petrides M (1994) Frontal lobes and working memory: evidence from investigations of the
effects of cortical excisions in nonhuman primates. In: Handbook of
Neuropsychology, Vol. 9, F. Boller and J. Grafman (eds.), Elsevier Science B.V.,
Amsterdam, pp. 50–82.
Yamamoto T, Takemura M, Inui T, Torii K, Maeda N, Ohmoto M, Matumoto I, Abe K. (2009)
Functional organization of the rodent parabrachial nucleus. Ann N Y Acad Sci.
1170; 378–382.
Vibration Analysis and Control – New Trends and Developments
352
Scott TR and Small DM (2009) The role of the parabrachial nucleus in taste processing and
feeding. Ann N.Y. Acad Sci. 1170, 372–377.