Supply Chain Management New Perspectives Part 10 docx
Bạn đang xem bản rút gọn của tài liệu. Xem và tải ngay bản đầy đủ của tài liệu tại đây (687.78 KB, 40 trang )
Supply Chain Management - New Perspectives
348
Squeezing as much efficiency as possible through high levels of automation in warehousing
and load management has produced significant efficiencies in warehousing and distribution
industries. However, the effects of congestion are eroding the significant progress that has
been made in inventory management and warehouse control. Two types of changes appear
to be happening simultaneously. First, reductions in labor costs attributable to in-
warehouse efficiencies are being absorbed by the costs of the over-the-road operations (more
equipment and drivers to deal with congestion and driver hours of service limitations).
Second, by re-introducing uncertainty in shipping and receiving attributable to the over-the-
road and “last mile” portion of the supply chain system, businesses are forced into looser
scheduling , setting lower delivery targets, and adding additional inventory (a reversal of
recent trends in lowering inventory) to allow for uncertainty in delivery times.
Impaired Cross-Docking Operations – Congestion impacts are particularly notable for
cross-docking operations. Both the efficiency and feasibility of cross-docking operations are
tied to the ability of originators to deliver inbound loads within a given window of time
needed to reposition loads for outbound customers – typically very early in the morning.
Late inbound delivery creates storage and loading problems. As the communications and
inventory control infrastructure required to support cross-docking operations becomes more
widespread and more critical to improving efficiency and lowering costs of transportation
and logistics, delivery reliability will become an even greater issue in the successful
adoption of cross-docking in warehouse and logistics management. Insofar as this practice
becomes more integrated into transportation and warehousing operations, consideration
will be given to locating new facilities in places where congestion is less of a factor in
creating uncertainty about delivery times.
3.6 Work shifts
While discussions about optimizing supply chains typically focus on cargo movement, labor
is also an input to production processes and a significant component of delivery and
distribution services. And in that sense, it can be useful to consider worker travel related
costs as part of a broader and more comprehensive view of supply chains. The associated
costs may occur as a result of changes in: (a) commuting time and expense, (b) worker
schedule reliability or (c) service delivery related travel.
Commuting Time and Expense –Most employers require employees to bear the costs of
commuting longer travel times to, from and through congested areas. However, there is also
growing evidence that some employers offset some of these higher commuting costs by
offering higher wage rates. And yet an even more problematic situation is now occurring –-
the change towards earlier start times for shift workers, especially in the warehousing and
distribution industries. This is occurring in many congested metropolitan areas to facilitate
continued freight operations that rely on over-the-road movements. In some areas, shifts
are now being staggered to allow for more efficient operations and these staggered shifts
begin as early as 2:00 AM for distribution and warehousing operations attempting to serve
areas where congestion is growing. This constitutes a major change in working conditions.
In addition, it often reduces the ability of workers to use public transit or ridesharing
options, thus representing yet another form of cost increase for workers.
Worker Schedule Reliability - As congestion in larger and rapidly growing metropolitan
areas increases, many businesses have noticed an increase in congestion-related delays for
scheduled start-times. While such incidental (although increasing) arrival delays can
generally be accommodated in service and professional occupations and work
Traffic Congestion Effects on Supply Chains: Accounting for
Behavioral Elements in Planning and Economic Impact Models
349
environments, it can pose a more serious problems for production, manufacturing and
transportation industries.
The costs of start-time delays and arrival reliability are difficult to quantify and have not
traditionally posed a noticeable problem for businesses. However, the increasing frequency
of start-time delays and the cumulative burdens of congestion on business operations are
beginning to focus management attention on all aspects of congestion and its costs for
business operations. This trend is illustrated by a recent US national survey of 1,200
construction contractors, which found that 93% of responding firms reported traffic
congestion is affecting their operations, 64% reported at least one day of productivity loss
per worker annually due to congestion, and 73% reported that congestion adds more than
1% to their total cost of doing business (Associated General Contractors, 2010). While the
survey respondents may not be a totally random sample, the results nevertheless
underscore the importance of traffic congestion as a source of loss for construction firms.
Service Delivery Related Travel - Increased traffic congestion can also affect vehicle
movement during business hours. Such impacts have been reported by larger businesses
including utility companies, the insurance industry and major regional-serving businesses
such as hospitals and medical facilities. The Oregon study found that business travel
between offices, for meetings and for project-related team conferences is also becoming
adversely affected by growth in traffic congestion. This has resulted in more “on-the-clock”
(employer paid) travel time for senior managers as well as project and departmental staff,
and therefore less productive time spent managing and addressing operational issues.
While conference calling and virtual meetings are being pressed into service more
frequently, each of these options has distinct disadvantages that have become evident with
their use over time. Transition from historical multi-site operations for larger, more
concentrated operations centers imposes significant costs for businesses, and compounds
the commuting time/expense burdens borne by workers in these industries.
3.7 Business location
Site location and expansion decisions typically shift as products, markets, technologies and
input requirements evolve over time. As traffic congestion can effectively constrain both
labor markets and freight delivery markets, it can also be a factor affecting the location or
relocation of both: (a) distribution center sites and (b) production sites.
Relocation of Distribution Centers - Increased travel times that result from congestion can
effectively shrink the distribution radius of existing distribution operations, making both
existing service and expansion into new regional markets more difficult. In addition, a
major factor in providing logistics support outside of a metropolitan area can be the effect of
congestion on limiting outbound (morning) truck trips and the timing of afternoon return
trips. Afternoon returns, which often include backhauls, can create an overtime/over-hours
situation for the drivers involved, thereby increasing costs and reducing productivity for
both the vehicles and the drivers. This further cuts into the cost-effectiveness of distribution
operations because efficient backhaul management is one aspect of logistics management
that traditionally provides competitive advantages to these firms.
As a consequence of these congestion effects, many new warehousing, distribution and
transshipment facilities locate far from the metropolitan areas traditionally “home” to such
operations. In the New York metropolitan area, warehousing serving the ports of New York
and New Jersey are currently operating in central New Jersey. In several regions, major
manufacturers and food distribution businesses have located new distribution and
Supply Chain Management - New Perspectives
350
warehousing operations further away (as much as 200 miles or 320 km) from the core metro
markets in order to remain competitive in serving multiple markets.
Relocation of Production Facilities - The location of production on the part of most
manufacturing companies is a complex decision that is based on a unique combination of
factors such as labor, materials and markets. However, transportation has historically
played a role in these decisions. In the Oregon study, almost all of the businesses
interviewed and several of the retailers involved in manufacturing also operate globally –
with manufacturing spanning multiple continents and regions of the globe (including Africa
and the mid-East). This means that for manufacturers, levels of traffic congestion and the
ability of transportation infrastructure to support efficient production processes is an
important factor in their decisions about where to locate new product lines, how and where
to position various aspects of intermediate and final production, and where they may best
serve growing or emerging markets for their products.
3.8 Externalities: Interaction with other activities
As production and distribution activities shift location, partly in response to growth in
traffic congestion delay, those decisions also lead to “externality impacts” – i.e., impacts on
outside parties including (a) residents of urban areas and (b) workers at affected industries.
Localized Effects of Land Use and New Development - Warehousing has traditionally
located at the edge of cities, and it continues to be located in “edge” areas of many urban
regions. In regions experiencing population growth, though, firms that originally located in
relatively low-density areas in the past may now be facing higher levels of congestion on
crowded segments of highways and arterial roads that they depend upon for serving their
customers. The result can be not only congestion delay, but also increasing difficulty with
access to major arterials (such as turning movements from warehouse gates onto local
roadways) due to infill and “densification” in areas that were once semi-rural. Expansion,
especially of warehouse and distribution facilities, is often limited both by new and
proposed non-commercial land uses and by significantly higher land costs. Using existing
facilities with greater intensity may also be limited to the existing footprint for some
transportation and warehousing operations.
For manufacturing businesses with regular, high-volume movements between intermediate
and final production sites, a series of factors may significantly increase the time needed to
move intermediate products, partial assemblies and raw materials. This may occur as a
combination of generalized highway system congestion and specific bottlenecks where there
is reduced capacity on elements of the arterial roadway system (such as bridges and viaduct
underpasses). In some urban areas, especially where older manufacturing sites have been
incorporated into new mixed use developments, the associated gentrification and
conversion of older and unused warehousing space has combined with traffic congestion to
compound delays in routine shipment patterns.
Externalizing Congestion Effects on Workers – As businesses make adjustments to
minimize congestion costs (such as shifting hours of operation or site locations), one obvious
way that they can “externalize” their costs is by passing on requirements to employees to
change their work hours and/or commuting distances. As previously noted, workers asked
to shift to early or late work times may find that public transport is unavailable or poorly
supported at those times. And when distribution sites are moved to outlying areas, workers
may also find that their commute travel times and costs are also increased, while their
options for alternative forms of transportation are reduced or eliminated.
Traffic Congestion Effects on Supply Chains: Accounting for
Behavioral Elements in Planning and Economic Impact Models
351
While providing adequate alternative transportation is clearly not a traditional role of
private businesses, the effects of congestion expansion across the workday, operational
decisions required to address the business costs of congestion, and business location
decisions can together shift the cost and time burden of maintaining job access to
employees. These effects also tend to be most pronounced for longer-term employees who
have worked at the same location and in the same industry for many years.
4. Implications for transportation & economic modeling
4.1 Transportation modeling
The preceding discussion, covering seven classes of economic impact, indicates the
importance of distinguishing key dimensions of congestion in transportation forecasting
and impact models. This includes the composition of affected traffic (distinguishing trucks
and service vehicles for supply chain impacts), time of day and spatial pattern of congestion,
and effects on intermodal connectivity. There are several key reasons:
Time Periods – Congestion can affect both truck and service delivery travel at specific
times of day. For industries that are most affected by congestion delays and schedule
unreliability, there are important differences in the extent of their options to modify
work shifts and delivery schedules. These options vary by industry depending on
abilities to operate and ship during morning, afternoon and/or evening periods.
Spatial Patterns of Congestion – For industries that are most dependent on closely
integrated logistics, congestion can affect deployment and use of truck fleets, and that
can lead to subsequent changes in the number, location and dispersion of
manufacturing and distribution facilities.
Intermodal Linkages – Ultimately, every change in congestion along a segment of the
road network is likely to affect access from some areas to airports, marine ports or rail
intermodal facilities. Conversely, every change affecting the activity at an airport,
marine port or railroad facility is likely to also affect traffic levels on its access routes.
Thus, congestion impact analysis calls for an intermodal perspective.
In an attempt to address these key dimensions of impact, all three of the impact studies
identified in Section 2.3 (Vancouver, Chicago and Oregon) relied on regional travel demand
forecasting systems to assess current and potential future congestion. In each case, the
models could distinguish truck movements from car traffic to estimate peak vs. off-peak
truck traffic changes and to include intermodal connections. Those analyses were also
supplemented by special studies that identified conditions affecting: (a) highway corridors
with particularly high levels of truck movement, (b) key rail and truck corridors providing
access to industrial zones, and (c) road corridors serving airport, marine port and/or
intermodal rail facilities.
4.2 Implications for economic impact modeling
The traffic modeling developed for all three of those studies was used in a transportation
economic impact framework now called TREDIS (Transportation Economic Development
Impact System). This economic framework incorporates a multi-modal structure that is
sensitive to changes in passenger and freight cost, travel time reliability and access
conditions by mode and time of day. The access measures include size of labor markets and
same-day delivery markets as well as connectivity to intermodal ports, terminals and
gateways. Measures of change in transportation system performance and access are applied
Supply Chain Management - New Perspectives
352
to information on how various industries rely on different combinations of transportation
modes and inter-modal connections for access to supply chain and delivery markets. In this
way, changes in modal performance and access conditions lead to different impacts on cost
and economic growth opportunities for various industry sectors. (For a summary of
TREDIS and discussion of model design policy issues, see Weisbrod, 2008.)
While all three studies required multi-modal analysis, there were very different policy
issues in each case. For Chicago, a particularly critical issue was capacity and access for
truck movements to rail yards and industrial corridors. For Vancouver, a critical issue was
capacity of access routes to seaport and airport facilities. For Portland, Oregon, a critical
issue was region-wide truck delivery times for warehousing and distribution facilities. Yet
despite differences in local issues, all three cases shared a common need to examine
economic impacts of congestion growth, and to do so from a multi-modal perspective.
Another notable element of assessing economic impacts is the ability to distinguish
between local-serving industries and “traded industries” (that serve national or
international markets). It is important to recognize that even when businesses adjust
delivery and worker shift schedules to avoid peak congestion, those activity shifts have
some incremental cost for affected businesses. As noted in the Portland report: “. . . local-
serving businesses either absorb added costs and reduce their profits or pass these costs on to people
in the region. Trade-oriented businesses though, can and do move their operations to locations
outside the region.” (Economic Development Research Group, 2005, p.10). All three
regional studies (Chicago, Vancouver and Oregon) calculated employment and income
growth impacts of alternative scenarios involving rates of traffic congestion growth. The
estimated impacts calculated by TREDIS varied by industry and over time, but in each
region they represented total GDP impacts that are quite substantial – ranging from US
$476 million/year in Vancouver to US $2.4 billion/year in Chicago. It is important to note
that the variation in impact found in these studies was due to differences in the specific
transportation scenarios as well as characteristics of the regional economy and freight
infrastructure (sources cited in section 2.3).
5. Conclusion
In examining a range of congestion impacts on supply chains and related business activity,
several conclusions arise. First, it is clear that supply chain simulation models based on
systems dynamics can be useful to illustrate why congestion delays and uncertainty lead
businesses to shift schedules, delivery lot sizes and sometimes even locations. However, the
insights provided by interviews and discussions with businesses presented in this chapter
show that there can be many more facets of congestion impact and associated change in
business organization and behavior beyond those typically identified in such models.
Specifically, congestion impacts can go far beyond mere changes in operating cost, to also
affect the size and nature of business organizations, production processes and customer
markets served. And businesses can have a wide range of responses, depending on the type
of affected business activity and the nature of congestion growth.
In this chapter, we described 26 different elements of business impact and response to traffic
congestion growth, grouped into seven broad classes. These impact elements are inter-
related and they tend to occur as a logical sequence, as illustrated by the conceptual model
presented in Section 3.1. They can be important to consider in planning processes, policy
development and economic impact analysis models. There are some situations where the
economic impacts of traffic congestion can be less than expected because businesses adjust
their operations to help mitigate congestion costs. However, in other situations, the
Traffic Congestion Effects on Supply Chains: Accounting for
Behavioral Elements in Planning and Economic Impact Models
353
economic impacts of traffic congestion can be greater than expected because of additional
impacts on workers and on operators of other transport modes. In addition, there are effects
on land use and business location patterns all of which are unaddressed by models that
assess the direct cost impacts of delivery delay. Many of these additional elements of
economic impact take place slowly over time and may not be noticed until their
consequences are severe (i.e., entire business operations are rescheduled, reconfigured or
relocated), at which time it may be too late to reverse business decisions.
Finally, it should also be clear that it can be misleading to focus research and policy
attention on the overall incidence and average magnitude of congestion impacts on
businesses as a group, since impacts can vary widely depending on the type of affected
business activity (location, products or services offered, degree of localization of suppliers
and customer base, and modal dependencies) and the nature of local congestion growth
(including its severity, spatial and temporal patterns of incidence). In other words, even if
only a small fraction of businesses change their fleets, locations or markets in response to
congestion growth, the impact can be very important for particular business sectors. This
can have significant economic development and public policy implications for some local
areas, occupations and industries, especially if these business sectors are those for which
future region-wide growth and development are dependent. It can also lead to a much
wider and varied set of consequences for regional economies, as demonstrated by the
examples of regional economic impact studies. Future policy and planning should consider
and account for these distributional consequences.
6. References
Associated General Contractors of America (2010). AGC National Traffic Survey Part One:
Measuring the Impact of Highway Congestion on the Construction Industry.
Retrieved from
www.agc.org/galleries/news/National%20Congestion%20Survey.pdf
Bozuwa, J & Hoen, A. (1995). The Economic Importance of Separate Lanes for Freight
Vehicles on Motorways, PTRC Conference, Sept.
Cambridge Systematics (2008). Estimated Cost of Freight Involved in Highway Bottlenecks.
Federal Highway Administration, Washington, DC, USA.
Cohen, H. & Southworth, F. (1999). On the Measurement and Valuation of Travel Time
Variability due to Incidents on Freeways, Journal of Transportation and Statistics,
Vol.2, No.2, pp. 123-132.
Colledge, D. (2007). The Costs of Supply Chain Congestion, Disruption and Uncertainty,
Asia Pacific Gateway and Corridor Initiative, Vancouver, BC, Canada.
Delcan & Economic Development Research Group (2003). Economic Impact Analysis of
Investment in a Major Commercial Transportation System for the Greater Vancouver
Region, Greater Vancouver Gateway Council, Vancouver, BC, Canada.
Disney, S., Naim, M. & Towill, D. (1997). Dynamic Simulation Modelling for Lean Logistics,
International Journal of Physical Distribution and Logistics Management, Vol.20, No.3-4,
pp 194-196.
Economic Development Research Group (2004). Assessing the Economic Impacts of
Congestion Reduction Alternatives, Chapter 7 in The Metropolis Freight Plan:
Delivering the Goods, Chicago Metropolis 2020, Chicago, IL, USA.
Economic Development Research Group (2005). The Cost of Congestion to the Economy of the
Portland Region, Portland Business Council, Metro, Port of Portland & Oregon DOT.
Supply Chain Management - New Perspectives
354
Economic Development Research Group (2007). The Cost of Highway Limitations and Traffic
Delay to Oregon’s Economy, Oregon Business Alliance & Portland Business Council.
Fernie, J, Pfab, F. & Regan, A. (2000). Retail Grocery Logistics in the UK, International Journal
of Logistics Management, Vol.11, No.2, pp. 83-95.
Geunes, J. and Konur, D. (2009). A Competitive Facility Location Game with Traffic
Congestion Costs, University of Florida, Center for Multimodal Solutions for
Congestion Mitigation, Gainesville, FL. Retrieved from
Golob T. and Regan, A. (2003). Traffic Congestion and Trucking Managers” Use of
Automated Routing and Scheduling, Transportation Research Part E: Logistics and
Transportation Review, Vol.39, pp. 61-78.
Graham, D. (2007). Variable Returns to Agglomeration and the Effect of Road Traffic
Congestion, Journal of Urban Economics, Vol.62, No. 1, (July), pp. 103-120.
Grant-Muller, J. and Laird, S. (2006). Cost of Congestion: Literature Based Review of Methodologies and
Analytic Approaches, Institute for Transport Studies, University of Leeds, UK.
Hoppin, D. (2006). How Much Does Congestion Cost?, Logistics Today, Sept. 19, 2006.
Konur, D. and Geunes, J. (2011). Analysis of Traffic Congestion Costs in a Competitive
Supply Chain, Transportation Research Part E: Logistics and Transportation Review,
Vol.47, No. 1, January, pp. 1-17.
Lee, H., Padmanabhan, V. & Whang, S. (1997). The Bullwhip Effect in Supply Chains, Sloan
Management Review, Spring, pp 93-102.
Mason-Jones, R., Namim, M. & Towill, D. (1997). The Impact of Pipeline Control on Supply
Chain Dynamics, International Journal of Logistics Management, Vol.8, No.2, pp 47-61.
McKinnon, A. (1999). The Effect of Traffic Congestion on the Efficiency of Logistical
Operations, International Journal of Logistics: Research and Applications, Vol.2, No.2,
pp. 111-128.
Moinzadeh, K., Klastorin, T. & Emre, B. (1997). The Impact of Small Lot Ordering on Traffic
Congestion in a Physical Distribution System, IIE Transactions, Vol.29, pp. 671-679.
Rao, K. and Grenoble, W. (1991). Traffic Congestion and JIT, Journal of Business Logistics,
Vol.12, No.1.
Sankaran J. & Wood, L. (2007). The Relative Impact of Consignee Behavior and Road Traffic
Congestion on Distribution Companies, Transportation Research Part B:
Methodological, Vol.41, pp. 1033-1049.
Short, J., Trego, T. & White, R. (2010). Developing a Methodology for Deriving Cost Impacts
to the Trucking Industry that Generate from Freight Bottlenecks, Transportation
Research Record, Vol.2168, pp.89-03.
Small, K., Chu, X. & Noland, R. (1997). Valuation of Travel-Time Savings and Predictability in
Congested Conditions for Highway User-Cost Estimation, NCHRP Report #431.
Transportation Research Board, Washington, DC, USA
Weisbrod, G., Vary, D. and Treyz, G. (2001). Economic Implications of Congestion. NCHRP
Report #463. Transportation Research Board, Washington, DC, USA.
Weisbrod, G., Vary, D. & Treyz, G. (2003). Measuring Economic Costs of Urban Traffic
Congestion to Business, Transportation Research Record, No.1839.
Weisbrod, G. (2008). Models to Predict the Economic Development Impact of Transportation
Projects: Historical Experience and New Applications, Annals of Regional Science,
Vo.42, pp.519-543.
Wilson, M. (2008). An Exploration of the Road Traffic Congestion and Supply Chain
Performance, 2008 Oxford Business and Economics Conference, College of Business
Administration, California State Univ., Sacramento.
Part 4
Sustainability Issues Through the Supply Chain
17
Importance of Reverse Logistics
for Retail Acts
Gabriela Cecilia Stănciulescu
The Bucharest Academy of Economic Studies
Romania
1. Introduction
After 1970 — the energy crisis — the literature began to speak of encompassing logistics
materials management and logistics supply production to ensure the efficiency of the
procurement of raw materials and production programs were effectively correlated with the
market objectives. The participants in the Environment for Europe Ministerial Conference in
1995 adopted a program through which the developed countries agreed to encourage
sustainable consumption that translates to the optimum use of resources.
Reverse logistics activities include, collecting useful waste to be returned to the
manufacture, purchasing reusable packaging, re-selling components with low wear, the re-
sale of consumer goods following refurbishment. In other words, when speaking about
reverse logistics we are referring to:
1. a channel conversely, meaning a situation in which a channel or a part of it is designed
for the flow of goods or materials moving forward in the opposite direction to the
consumer;
2. the many activities being the inverse of transportation, handling, storage that unfolds in
reverse channels required for the full use of the products, materials and components
throughout the lifecycle;
3. the regulators that are needed to protect the natural environment; they are being
increasingly accepted even though this is more than the idea that it would increase the
costs of private firms to prevent pollution and to carry out greening actions, thus
causing higher prices and decreased competitiveness (Porter & van der Linde, 2008).
As shown by Porter, properly designed environmental standards can stimulate innovations
leading to increased resource productivity, thus helping companies become more
competitive. The way companies react to environmental problems can be an indicator of
their competitiveness, but these rules do not automatically lead to innovations or superior
productivity. Companies will realize that successful innovations will benefit (Porter & van
der Linde, 2008).
2. Reverse logistics
Logistics is defined by The Council of Logistics Management as the process of planning,
implementing and controlling the efficient, cost-effective flow of raw materials, in-process
Supply Chain Management - New Perspectives
358
inventory, finished goods and related information from the point of origin to the point of
consumption for the purpose of conforming to customer requirements.
Reverse logistics includes all of the activities that are mentioned in the definition above. The
difference is that reverse logistics encompasses all of these activities because they operate in
reverse. Therefore, reverse logistics is the process of planning, implementing, and
controlling the efficient, cost-effective flow of raw materials, in-process inventory, finished
goods and related information from the point of consumption to the point of origin for the
purpose of recapturing value or for proper disposal.
More precisely, reverse logistics is the process of moving goods from their typical final
destination for the purpose of capturing value or proper disposal (Rogers & Tibben-Lembke,
1998). The re-manufacturing and refurbishing activities may also be included in this
definition of reverse logistics. Reverse logistics is more than re-using containers and
recycling packaging materials. Redesigning packaging to use less material or reducing the
energy and pollution from transportation are important activities, but they might be better
placed in the realm of “green” logistics. If no goods or materials are being sent “backwards,”
the activity is probably not a reverse logistics activity. Reverse logistics also includes the
processing of returned merchandise caused by damage, seasonal inventory, restock, salvage,
recalls and excess inventory. It also includes recycling programs, hazardous material
programs, obsolete equipment disposition and asset recovery.
An extended study undertaken in 1998 (Rogers & Tibben-Lembke, 1998) aimed at defining
the state of the art in reverse logistics and to determine the trends and best reverse logistics
practices. Part of the research charter was to determine the extent of the reverse logistics
activity in the U.S.A. Most of the literature examined in preparation for this research
emphasized the “green” or environmental aspects of reverse logistics. In this project, green
issues were discussed, but the primary focus is on the economic and supply chain issues
relating to reverse logistics. The objective was to determine current practices, examine those
practices and to develop information surrounding the trends in reverse logistics practices.
To accomplish this task, the research team interviewed over 150 managers that had a
responsibility for reverse logistics. Visits were made to firms to examine, firsthand, the
reverse logistics processes. Also, a questionnaire was developed and mailed to 1,200 reverse
logistics managers. There were 147 undeliverable questionnaires. From among the 1,053 that
reached their destinations, 311 usable questionnaires were returned for a 29.53% response
rate.
3. Motivators of design for environment-friendly reverse logistics
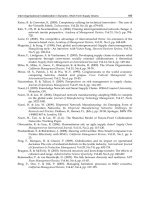
According to Bras (1997) and Rose (2000), mainly four motivators, involving customers
(stakeholders), competition, ISO 14001 system and the most important, legislations, make
organizations and corporations more concerned about environment-friendly products and
technologies on their own initiatives. The integrated relationship of each factor can be
represented in Figure 1. This section provides a brief description of each factor and their
impact on a corporation’s reverse logistics strategy.
The increasing awareness among customers of the importance of saving the environment
will certainly stimulate the corporations to improve their performance in both the green
manufacturing procedure and the products design and recycling to satisfy the customer
Importance of Reverse Logistics for Retail Acts
359
Fig. 1. The Motivators of Design for Reverse Logistics and Their Relationships (Wang, 2008)
demand. The increasingly positive attitudes of consumers on green products, therefore,
accelerate the innovation of products and techniques on environmental safety and further
stimulate organizations to make designs for a product life-cycle strategy. Another important
factor that will influence the consumer’s purchasing willingness is the corporations’ image,
more specifically, the role of the corporation and its contributions for saving the
environment. Wal-Mart provided a good example of being publicly boycotted for its un-
recyclable products with an environment-friendly label.
Competitors that get ahead in product end-of-life processing will stimulate corporations to
make more efforts to recapture the market shares by designing more environment-friendly
and recyclable products and processes, and take more responsibilities for the end-of-life
products (Rose, 2000). Reverse logistics is a complex and comprehensive system that
requires designers to take into account the reusability, disassemble-ability, re-
manufacturability, serviceability and recyclability of the returned products. Meanwhile, the
marketing, finance, safety, health, functionality and manufacturability aspects should also
be considered carefully to obtain a trade-off design for all these factors. Nowadays, many
counties have made efforts to improve the reverse logistics using different systems. The EU
has made specific regulations for monitoring and inspecting the performances of companies
for the treatment and recycling of waste electrical and electronic equipment (WEEE) that has
been proved an effective way for implementation. However, the WEEE recycling and
disposal in China is facing a dilemma because customers, unwilling to end the life of the
products, and the companies doubt the worthiness of an investment in the WEEE recycling
system. Through the investigation of two leading Chinese companies in the household
appliances industry, Wang (2008) finds that:
Supply Chain Management - New Perspectives
360
1. The financial profit is still the fundamental driving force for companies to integrate
reverse logistics into product design process. The management of the companies is
reluctant to invest in the programs in which consumers are not interested.
2. The consciousness of the WEEE among the Chinese consumers is still low, which can be
proved from their definition of “green” products — low in harm to the healthy people
and low energy consumption — which are only a small aspect of environmental
protection and are much less than sufficient.
3. The difficulty of a “take-back” is another barrier for a company’s initiative to establish a
comprehensive reverse logistic system, because they may feel it is not worthwhile
investing much on an idle facility.
4. The WEEE reverse logistics design is far too laggard for the innovation in the new EEE
in China. Also, Chinese companies are more willing to invest in the improvement of
inventory management and customer relationship management rather than obsolete
domestic appliances.
5. The Government should play a more active role in encouraging corporations to take
more responsibility for the recycling and treatment WEEE, closing down the illegal
small warehouses for reselling WEEE after a simple clean and maintenance, and finally,
‘propagandizing’ the importance of the WEEE recycling and treatment and the harm to
the environment caused by illegal recycling.
6. The Haier Co provided a quite new concept — employing sub-contractors to do its
take-back, recycling and treatment jobs. This allows it to have sufficient time to estimate
the benefits from the reverse logistics and to develop a reverse logistics suitable for its
development before investing.
7. There are also some companies that have not even established a WEEE disposal
department. This will eventually impact on their export business, because more and
more countries have published stricter regulations for companies to take more
responsibility for the environment.
8. Integrating reverse logistics into product design, in the long-term view, can shorten the
recycling and treatment time and further cut costs.
Supply chain management is the coordination and management of a complex network of
activities involved in delivering a finished product to the end-user or customer. All stages of
a product’s life-cycle will influence a supply chain’s environment burden, from resource
extraction, to manufacturing, use and reuse, final recycling, or disposal (Zhu et al., 2007).
Environmental issues under legislation and directives from customers, especially in the
U.S.A., the European Union (EU) and Japan, become an important concern for the
manufacturers. As a more systematic and integrated strategy, the Green supply chain
management (GSCM) has emerged as an important new innovation that helps organizations
develop “win-win” strategies that achieve profit and market share objectives by lowering
their environmental risks and impacts, while raising their ecological efficiency.
A research (Zhu, Sarkis, & Lai, 2007) aimed at surveying the current green activities in the
computer parts’ manufacturers in Thailand and evaluating the green supply chain
management. The 11 manufacturers were selected for case studies that provided in-depth
interviews about green procurement, green manufacturing, green distribution and/or
reverse logistics. Their products or services are related to computer parts that are IC, hard
disk drives, power supplies, print circuit boards and monitors. Also, several stakeholders in
Importance of Reverse Logistics for Retail Acts
361
the EOL electronic parts, used computer stores (second-hand markets), waste collectors
(called SaLeng), disassembly/recycle plants and final treatment/landfill companies, are
involved. Most of them comply with the WEEE and the Restriction of Hazardous Substances
(RoHS) Directive( RoHS) directives to minimize the hazardous or toxic elements in
electronic parts
i
. To obtain efficiency and effectiveness in the GSCM, collaboration among
the important stakeholders in the electronics industry must be strongly concerned.
4. Reverse logistics activities
Typical reverse logistics activities would be the processes a company uses to collect used,
damaged, unwanted (stock balancing returns) or outdated products, in addition to the
packaging and shipping materials from the end-user or the reseller. Once a product has
been returned to a company, the firm has many disposal options from which to choose. If
the product can be returned to the supplier for a full refund, the firm may choose this option
first. If the product has not been used, it may be resold to a different customer or it may be
sold through an outlet store. If it is not of sufficient quality to be sold through either of these
options, it may be sold to a salvage company that will export the product to a foreign
market.
If the product cannot be sold “as is” or if the firm can significantly increase the selling price
by reconditioning, refurbishing or remanufacturing the product, the firm may perform these
activities before selling the product. If the firm does not perform these activities in-house, a
third party firm may be contracted or the product can be sold outright to a
reconditioning/remanufacturing/refurbishing firm. After performing these activities, the
product may be sold as a reconditioned or remanufactured product, but not as new. If the
product cannot be reconditioned in any way, because of its poor condition, legal
implications or environmental restrictions, the firm will try to dispose of the product for the
least cost. Any valuable materials that can be reclaimed will be reclaimed and any other
recyclable materials will be removed before the remainder is finally sent to a landfill.
Generally, packaging materials returned to a firm will be reused. Clearly, reusable totes and
pallets will be used many times before disposal. Often, damaged totes and pallets can be
refurbished and returned to use. This work may be done in-house or by using companies
i
While electronic devices have become a way of life for much of the world, their presence have caused
adverse effects on the health of many and the environment. We rely on electronics for nearly every
aspect of life. They allow us to obtain information easily and they are even used to save lives in
hospitals worldwide. However, once these electronic devices become obsolete, their disposal poses
extreme health risks due to the hazardous materials commonly found in electronic parts and
components. In an effort to fix this problem, the Restriction of Hazardous Substances (RoHS) Directive
was created by the European Union and went into effect July 1, 2006.
This directive is intended to regulate toxic materials in electronic devices and electrical systems. In an
effort to reduce toxic e-waste and lesson the negative environmental footprint electronic devices have
on our planet, the European Union has restricted the use of six materials in electronic parts that are
deemed hazardous.
As such, RoHS restricts the use of lead, cadmium, mercury, hexavalent chromium, polybrominated
biphenyls and polybrominated diphenyl ether. These restrictions are intended to apply to the
production of consumer electronic equipment, appliances, tools, toys and medical devices
( />
Supply Chain Management - New Perspectives
362
whose sole mission is to fix broken pallets and refurbish packaging. Once repairs can no
longer be made, the reusable transport packaging must be disposed of. However, before it is
sent to a landfill, all salvageable materials will be reclaimed. European firms are required by
law to take back transport packaging used for their products. To reduce costs, firms attempt
to reuse as much of these materials as possible and reclaim the materials when they can no
longer be reused.
4.1 Interest in reverse logistics
Awareness of the art and science of logistics continues to increase. Additionally, great
interest in reverse logistics has peaked. Many companies that previously did not devote
much time or energy to the management and understanding of reverse logistics have begun
to pay attention. These firms are benchmarking return operations with the best-in-the-class
operators. Some firms are even becoming ISO certified for their return processes. Third
parties specializing in returns have seen a great increase in the demand for their services.
Leading-edge companies are recognizing the strategic value of having a reverse logistics
management system in place to keep goods on the retail shelf and in the warehouse fresh
and in demand (Raicu et.all, 2009). In the case of Romania, the recovery management is
limited to the only three products’ industries, which are:
1. collecting and recovery of old cars (usual older then 10 years) and parts of them,
following some stages of reverse logistics process;
2. collecting and recovery of electronics and electrics products;
3. packaging waste recovering.
For the first products category, the Public Authority supports the fixed cost of car recovery
from the public budget and the financial program is well-known as “crock” program. There
are some recovery centres, and all stages of the reverse management are accomplished by
private operators. The second products category is periodically collected, in front of the final
user’s house. The obligation for providing location of the recovery centres is on the Public
Administrative Authority at local level. According to the Romanian Government Resolution
no.448/ 2005, every county has to provide at least one recovery centre for electronics and
electrical equipment; as well as each of the city having more then 100,000 inhabitants. In
Bucharest, the minimum number of such centre is at least six, one for each of the
administrative sector. The producers and distributors support all the involved costs for all
reverse management activities.
Besides these product types for the recovery there are no other initiative for materials
which still have usage value. Moreover, there is no planning measure to reserve some
space for the purpose of the recovery centre settlements into the outskirts of the new
urban areas.
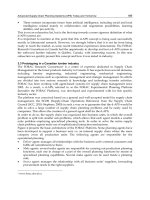
4.2 Return percentages
The reverse logistics process can be broken down into two general areas, depending on
whether the reverse flow consists primarily of products or primarily of packaging. For
product returns, a high percentage is represented by customer returns. Overall customer
returns are estimated to be approximately 6% across all retailers. Return percentages for
selected industries are shown in the following table. In each case, return percentages were
established by several different firms.
Importance of Reverse Logistics for Retail Acts
363
Industr
y
P
ercen
t
Magazine Publishing
Book Publishers
Book Distributors
Greeting Cards
Catalog Retailers
Electronic Distributors
Computer Manufacturers
CD-ROMs
Printers
Mail Order Computer Manufacturers
Mass Merchandisers
Auto Industry (Parts)
Consumer Electronics
Household Chemicals
50%
20–30%
10–20%
20–30%
18–35%
10–12%
10–20%
18–25%
4–8%
2–5%
4–15%
4–6%
4–5%
2–3%
Table 1. Sample Return Percentages (Rogers & Tibben-Lembke, 1998)
Clearly, return rates vary significantly by industry. For many industries, learning to manage
the reverse flow is of prime importance.
5. Reverse logistics – component of environmental sustainability
There are three main principles in sustainable development:
environmental sustainability, ensuring a tolerable development for all essential
ecological processes, especially the diversity of biological resources
social and cultural sustainability, which guarantees a favourable economic
development, members of society, culture and values compatible with the existing
culture and civilization, to preserve community identities
economic sustainability, having a role in ensuring efficient economic development,
resources are handled so that it also will exist in the future.
Reverse Logistics is the process of disposing of used products or a new initial point of the
supply chain, such as the customer returns, overstock, expired food, also redistributing
them using specific rules to collect their management. Reverse logistics refers to recoverable
material components after consumption, waste and packaging, which go on backward, from
the consumer production that is incorporated into a new economic cycle. Reverse logistics
supposes some extra handling operations, which involve certain circuits’, and also specific
charges for the reception from consumers, sorting, loading and unloading. In attempting to
design a total system of distribution, logistics specialists have traditionally approached the
distribution process, starting with the manufacturer and the product flow from the producer
to the consumer. It is well known that, during accelerated economic growth periods, as
emergent economies have known, the urban settlements go to the fringe, creating huge
residential areas. These are acquiring in time (in a nonregular environment) new spatial
functions such as commercial, educational and social ones. Some of them are set up
simultaneously with the residential development stage. This kind of real estate evolution is
presented in the recent development of Bucharest suburbs.
Supply Chain Management - New Perspectives
364
The following two types of residential areas rising up in suburbs are distinguished:
low density zones, with lodgings like villas, having large space and high income
inhabitants;
high density zones, with lodgings on many levels, usually four or eight levels, having
large flat surface and inhabitants with high income, at least greater than the average
income of the city’s inhabitants (Raicu et.all, 2009).
Making a reverse logistics process for a company or a product is very difficult, especially
because, in many cases, there is no systematic plan of distribution. In addition, many
products reach the retailer and consumer brand identity without any product or provider.
Locating these products and sending them back to the producer is a very costly process.
Products may be withdrawn by a company for a variety of reasons, poor packaging,
improper labeling or delivery methods resulting in improper alteration and contamination.
The level of urgency of the withdrawal depends on several factors, most importantly, the
gravity product risk.
Three different levels can be identified, depending on the level of penetration of the product
in the system. At the first level, the product is still under the manufacturer's control, the
deposits under its control or primary distributor warehouses. At this level, the location and
recovery of a product is a logistics specialist for the simple matter of rebuilding the stock. At
the second level, the product should be located and removed from the intermediaries
involved in the product distribution — the wholesalers and retailers. Withdrawal, in this
case, becomes a little more difficult. At the third level, the product is in the hands of the
consumer. Here, we reach the highest level of difficulty.
6. Opportunities for sustainable management of reverse logistics
Many companies realize that there are large amounts of money that can be recovered by
returning the goods. A large number of companies have developed this “recall” business.
Logistics service providers have found that up to 7% of company sales are embedded in the
cost of the return. This figure is hard to imagine because, as part of the answer, they provide
reverse logistics applications worth between US$50,000 and US$500,000 dollars for a single
license for a location.
Logistics companies made between 12 and 15% profit from this industry. One of these
companies is represented by Unyson, whose CEO, Mr Donald Matlby, explains how
companies can do more business if they apply the reverse logistics process. Unyson
manages products returned, destroyed (in whole or in part) and the registration of each
product defects in a specially-designed transport network on the Internet. This allows an in-
transit visibility absolute return, while the returns are forwarded to the center or
distribution center to be discarded or repaired. A company that has a logistics service
provider can create his own internal platform returns, but its cost may exceed US$1 million.
Another way to get your ‘money-back-returns’ policy is enforced by the company Bed, Bath
& Beyond, which pays much attention to their clients so that they remained loyal to the
company's products. BB & B accept products returned by customers who consider them
inadequate without further explanation being required. Products will be replaced or a credit
will be given to customers buying in other company stores. The return process begins when
a customer, vendor, dealer or manufacturer finds something inappropriate in a product
(expired, damaged, broken or wet). This finding needs to initiate a response, through
Importance of Reverse Logistics for Retail Acts
365
automated processes already established, to determine fault, return the transport, also the
eventually physical process of redistribution or recycling and the final payment to the client.
The idea of reverse logistics and return can be difficult, expensive and time-consuming for
everyone involved, manufacturers, retailers and consumers. As an example, the Romanian
Ministry of Finance announced on a press release that the European Commission, on 4 May
2011, has approved the introduction of reverse charge mechanism for domestic supply of
the following products: corn; wheat; rye; sunflower; barley; sugar beet; soya and two-row
barley.
The measure has to be further approved by the Council of the European Union, and will
enter into force 10 days after such approval. The vendors’ and suppliers’ aim is to reduce the
total cost, while increasing the supply chain visibility, through a management program
using the Internet. A company monitoring their returns may reduce between 15 to 30% of
loans granted by the correction process. And those savings can be even more significant.
Shipping and handling costs may be partially or entirely eliminated by consolidating and
also optimizing the delivery, in particular, the elimination of non-returnable products or
materials that would be discarded before being loaded into the truck for the long journey
home.
7. Threats for reverse logistics due to global instability
The network of facilities, processes and people involved in procurement of raw materials,
production, distribution and related information flow are integrated in one complex chain.
However, the consumer is not always the end of the chain and, a return flow of products
should be added to forward flow into a closed loop supply chain.
Products that have failed, recalled products or obsolete ones, spare parts that still have some
value, waste that must be disposed of and even unsold products become subject of take bake
system, as the the responsibility for them shifts back to the producer. Suppliers and
producers are facing new and complex challenges determined by several factors:
Increasing competition in a global environment. Companies adopt more flexible sales
policies and agree to take back unsold products from retailers.
Consumer awareness on companies and their products environmental footprint.
Legal constraints. Original manufacturer is now responsible for final disposal of the
product.
Shortening product life cycles. Products become obsolete more quickly and returns
increase.
There are important characteristics that need to be managed in order to ensure an
economically viable reverse supply chain, listed by Blumberg: uncertain flow of materials,
diversity of returned products depending on the specific customer, time, value
improvement, flexibility of the supply chain, coordination between multiple parties
involved into the returning process.
When both forward and backward system are controlled by one company the result is a
closed loop supply chain with positive effects on reducing costs of returns, transportation,
warehouse expenses and time.
Beyond their choice between compliance with minimum legal requirements and adopt a
pro-active green behavior, companies are facing their utmost challenge: survive the global
financial crisis.
Supply Chain Management - New Perspectives
366
Aberdeen Group researches propose a holistic approach, integrating supply chain
management and financial management of the company through sales and operation
planning, in an attempt to resolve complex challenges and changes of global environment.
They identify strategies for managing complexity within Global Supply Chains, and define
best companies in terms of successful and operations planning and their core capabilities.
The capabilities of best-in-class companies are: employees understanding the business
strategy, products and processes, high level reporting designed for executive management,
ability to consider previous results with regard to forecast accuracy and inventory,
capability to express sales and operations planning in terms of revenues and margins.
Research group considers key performance criteria to distinguish the best- in- class
companies with regard to a successful sales and operations planning :forecast accuracy,
complete and on-time orders delivered to customers, decreased cash- to- cash cycle, gross
profit margins.
The most companies in best class category are focusing on holistic consideration of supply,
demand and finance.
Capgemini Consulting conducted in 2009 a survey on 300 companies reflecting the impact
of economic crisis on the activities and projects that supply chain mangers will execute in
the coming period. On top of the list are inventory optimization projects, followed by
supply chain strategy and improve planning and supply chain visibility projects.
The focus of strategic actions has shifted in 2010 versus 2009 from inventory decrease to
management of volatile demand and integrating the financial planning and budgeting
process with the sales and operations planning.
Global market and recent effect of economic crisis impose changing the traditional supply
chain network required to become more flexible and organized to deliver smaller and more
frequent orders. More flexible supply chain could imply adapting manufacturing and
packaging process for point of sale customization , outsourcing , regionalization of
distribution network and horizontal integration.
Global market in which consumers seek on-demand goods and services can determine
breakdowns in complex supply chain management. Consequently, companies should pay
closer attention to business environment and asses risks associated with both suppliers and
customers. Moreover, global instability and pressure to cut cost can lead to increased risk of
supply chain disruptions.
8. Reverse logistics as a strategic weapon
When companies think about strategic variables, they are contemplating business elements
that have a long-term bottom line impact. Strategic variables must be managed for the
viability of the firm. They are more than just tactical or operational responses to a problem
or a situation. Not long ago, the only strategic variables a firm was likely to emphasize were
business functions, such as finance or marketing. During the late 1970s and 1980s, some
forward thinking companies began to view their logistics capabilities as strategic. Although
more and more firms have begun to view their ability to take back material through the
supply chain as an important capability, the majority of these firms have not yet decided to
emphasize reverse logistics as a strategic variable.
There is no question that the handling of reverse logistics challenges is an essential, strategic
capability. In a celebrated case a few years ago, the McNeil Laboratories division of Johnson
& Johnson experienced a very serious threat when someone poisoned several people by
Importance of Reverse Logistics for Retail Acts
367
placing cyanide inside unopened bottles of Tylenol, a Johnson & Johnson flagship product.
This horrible act happened twice in the space of a few years. The second time, Johnson &
Johnson was prepared with a fine-tuned reverse logistics system and immediately cleansed
the channel of any possibly tainted product. Because Johnson & Johnson acted so quickly
and competently, a mere three days after the crisis, McNeil Laboratories experienced an all-
time record sales day. Undoubtedly, the public would not have responded so positively had
Johnson & Johnson not been able to quickly and efficiently handle its recalled product in
reverse through its existing system. Clearly, the Tylenol incident is an extreme example, but
it illustrates how reverse logistics capabilities can be strategic and how they can
dramatically impact the firm.
Another example of how reverse logistics can be used by retailers as a strategic variable is
by keeping the consumer product fresh and interesting. According to a quotation from Dan
Eisenhuth, executive vice president for asset recovery at the GENCO Distribution System,
“Retailers used to liquidate to compensate for ‘screw-ups’. Today they do it to stay fresh”.
The most important asset a retail store has is its retail space. To maximize the profit per
square foot of selling space, stores have to keep the fresh goods visible. Grocery stores, with
razor-thin profits of one to two per cent, realized long ago that it is critical to keep on the
shelf only those products that will sell. Supermarkets have to turn over their inventories
frequently to prevent spoilage loss and to maximize the return on their space. Now, non-
grocery retailers have begun to adapt supermarket ideas to their own businesses.
Grocery retailers started building reclamation centers in the 1970s. These reclamation
centers were places where old and non-selling products would be sent. In many instances,
reclamation centers would be attached to a store. Later on, supermarket chains began
shipping obsolete or bad product to one central reclamation center for processing. Reverse
logistics is strategically used to allow forward channel participants — such as retailers and
wholesalers — to reduce the risk of buying products that may not be “hot selling” items. For
example, a record company developed a program to adjust return rates for various products
depending on variables such as name recognition of the individual recording artist. This
program produces a win-win environment for both the producer and the retailer, not to
mention the consumer, who gets a broader selection. The program gives the company the
ability to develop new artist franchises. Had the record company not implemented this
program, its retailers would likely be willing to only carry “sure-thing” products.
Another example of the strategic use of returns is the electronic distributor that, during a
period of volatile memory chip prices, created a program to help reseller’s better control
their inventory and balance stocks. By allowing resellers to return anything within a
reasonable time frame, customers were encouraged to keep inventory low and make
purchases just-in-time. Strategic uses of reverse logistics capabilities increase the switching
costs of changing suppliers. A goal of almost every business is to lock customers in so that
they will not move to another supplier. There are many ways to develop linkages that make
it difficult and unprofitable for customers to switch to another supplier. An important
service a supplier can offer to its customers is the ability to take back unsold or defective
merchandise quickly and credit the customers in a timely manner.
If retailers today do not have a strategic vision of reverse logistics, it is likely that they will
be in trouble tomorrow. Retailers in high-return categories — such as catalogs, toys and
electronics — can easily go out of business if they do not have a strong reverse logistics
Supply Chain Management - New Perspectives
368
program. Given the competitive pressure on the North American retailers, the bottom line
contributions provided by good reverse logistics programs are important for the firms’
overall profitability.
R
ole
P
ercenta
g
e
Competitive Reasons 65.2%
Clean Channel 33.4%
Legal Disposal Issues 28.9%
Recapture Value 27.5%
Recover Assets 26.5%
Protect Margin 18.4%
Table 2. Strategic Role of Returns (Rogers & Tibben-Lembke, 1998)
For more than one mass merchandiser included in the research, the bottom line impact of
good reverse logistics was large. Another large retailer found that 25% of the profit of the
entire firm was derived from its reverse logistics improvements during its initial phase. In
this research project, the research team examined several ways that reverse logistics could
be used in a strategic manner. These strategic uses of reverse logistics are presented in
Table 2.
8.1 Competitive reasons
Research respondents stated they initiated reverse logistics as a strategic variable for
competitive reasons. Most retailers and manufacturers have liberalized their return policies
over the last few years owing to competitive pressures. While the trend towards the
liberalization of the return policies has begun to shift a little, firms still believe that a
satisfied customer is their most important asset. A part of satisfying customers involves
taking back their unwanted products or products that the customers believe do not meet
their needs. Generally, customers who believe that an item does not meet their needs will
return it, regardless of whether it functions properly or not. In an interesting example of this
behavior, one retailer recently reported the return of two Ouija boards. Ouija boards are
children’s toys that, supposedly, allow contact with the spirit world. On one Ouija board,
there was a note describing that it did not work because “… no matter how hard we tried,
we could not get any good answers from the ‘other side’…” The other Ouija board returner
said that the reason for return was, “too many spirits responded to the Ouija board session
and things became too scary”. In both cases, the consumers were allowed to return these
“defective” products. These competitive pressures appear to be, in large part, cultural.
North American consumers and businesses are much quicker to return goods than those in
most other countries. In fact, in many other countries, returns are never allowed. Some of
the international managers and academics interviewed in the course of this research
believed that if liberal returns were ever allowed in their country, both businesses and
consumers would abuse them. However, it is clear that, in some countries, business return
models are moving closer to the North American models. Over the next few years, it is likely
that international firms will feel a strong pressure to liberalize their return policies and
improve their reverse logistics capabilities.
Importance of Reverse Logistics for Retail Acts
369
8.2 Good corporate citizenship
Another set of competitive reasons is those that distinguish a firm doing well for other
people. Some firms will use their reverse logistics capabilities for altruistic reasons, such as
philanthropy. For example, Hanna Andersson, a US$50 million direct retailer of infants and
toddlers clothes, developed a program called Hannadowns. In the Hannadowns program,
customers are asked to mail back their children’s gently worn Hanna Andersson clothes.
The company then will give those customers 20% off the purchase price of new Hanna
Andersson clothes. For Hanna Andersson, this program has been very successful. In 1996,
133,000 garments and accessories were returned. These returns were then distributed to
schools, homeless shelters and other charities.
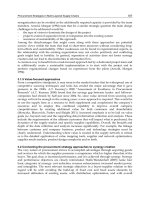
In a second example, a shoe manufacturer and retailer, Kenneth Cole Productions,
encourages consumers to return old shoes to Kenneth Cole stores during the month of
February. In return for bringing in an old pair of shoes, the customer receives a 20%
discount on a new pair of Kenneth Cole shoes.
In Figure 2, an advertisement for the Kenneth Cole shoe donation program is depicted. This
program has been very successful in providing shoes to those in need. Nike also encourages
consumers to bring their used shoes back to the store where they were purchased. These
shoes are shipped back to Nike, where they are shredded and made into basketball courts
and running tracks. Instead of giving consumer discounts, like Andersson or Kenneth Cole,
Nike donates the material to make basketball courts and donates funds to help build and
maintain those courts. Managing these unnecessary reverse flows is costly. However, these
activities enhance the value of the brand and are a marketing incentive to purchase their
products.
Fig. 2. Shoe Return Advertisement (Rogers & Tibben-Lembke, 1998)
Supply Chain Management - New Perspectives
370
Firms are using reverse logistics strategically. They are acting as good corporate citizens by
contributing to the good of the community and assisting people who are probably less
fortunate than their typical customers. While these policies may not be the reason all
customers purchase their products, they are considered a marketing incentive. It is using
reverse logistics to not just be environmentally friendly, but to promote customers at a real
cost to their businesses.
8.3 Clean channel
Reverse logistics competencies are also used to clean out customer inventories, so that those
same customers can purchase more new goods. Auto companies have fairly liberal return
policies in place and a large reverse logistics network that allows them to bring back parts
and components from their dealers. These parts are often remanufactured, so that value is
reclaimed. If new parts held by the dealer are not selling well, the auto companies will give
the dealers a generous return allowance, so that they can buy new parts that they really
need, and therefore, better service the ultimate consumer. Most auto dealers, and many
dealers in other industries, are family-based businesses with limited supplies of capital to
invest in inventories. They often have less than state-of-the-art inventory management
capabilities. It is in the best interest of the parts suppliers to clean out these inventories,
reduce credit-line constraints and improve customer satisfaction.
8.4 Protect margin
Nearly 20% of the firms included in the research use their reverse logistics capabilities to
protect their margins. This strategic usage of reverse logistics is closely related to “cleaning
out the channel”. Firms cleanse their inventories and the inventories of their customers and
their customers’ customers by using reverse logistics processes. Some firms are proactive in
their management of the downstream inventory, as opposed to merely being reactive. These
firms have programs in place that maximize inventory freshness. Fresher inventories can
demand better prices, which in turn, protect the margin. While many companies have yet to
recognize the strategic potential of efficient reverse logistics, it is clear that the tide is
beginning to turn. There is more interest in reverse logistics now than ever before. Firms are
beginning to make serious investments in their reverse logistics systems and organizations.
One clear indication of the strategic importance of a business element is the amount of
money spent on managing that element. Given the volume of returned products
experienced in some industries, it is not surprising that the firms in those industries
consider returns a strategic and core competency. It appears likely that companies in
industries that generally do not place much value on good reverse logistics practices, will,
over the next few years, find that making investments in their return systems will enhance
their profitability. It is clear that for many firms, excellent reverse logistics practices add
considerably to their bottom line.
One of the difficulties in managing returns is the difference in the objectives of the
manufacturers and retailers. The distance between them on many issues can make the
difference seem like a chasm. Whenever a retailer wants to return an item, the retailer and
the manufacturer may disagree on any one of the following:
condition of the item
value of the item
timeliness of the response.
Importance of Reverse Logistics for Retail Acts
371
Often, from the retailer’s perspective, every product was sent back in pristine condition and
any damages must have occurred in transit or must be manufacturing defects. The
manufacturer may suspect the retailer of abusing the return privileges because of poor
planning or of returning a product damaged by the retailer.
Once the condition of the item is agreed upon, the value that the retailer should receive
must be determined. The retailer may claim full credit and the manufacturer may have a
dozen reasons why it should not receive full credit. These issues can be difficult to sort out.
After they have all been decided, the refund never comes quickly enough to suit the retailer.
Retailer returns to the supplier are a method of reducing inventories near the end of a
quarter. Retailers may suddenly move material back to the supplier, or at least notify the
supplier that they are going to do so, and negotiate the details later. For similar reasons,
manufacturers can be slow to recognize returns as a subtraction from sales. They may want
to delay returns until a later accounting period or they may not want to credit the returned
items at the full price. Sometimes, the retailer simply deducts the cost of the items from an
invoice. Often, that invoice is not the same one for the goods being returned.
In the end, both parties need to realize that they have to develop a working partnership to
derive mutual benefits. Obviously, neither one can live without the other; they need to work
together to reduce the number of returns coming back and speed up the processing of those
that do come back. Inefficiencies that lengthen the time for processing returns cause harm to
both firms.
8.5 Zero returns
A number of firms are experimenting with zero returns programs. In a zero returns
program, the manufacturer never again takes possession of a product once it has been sold.
The retailer takes the responsibility for the exhibited product in accordance with the
manufacturer’s stipulations. In return, the retailer receives a payment that is intended to
reimburse him for the cost of the returned items and for exhibiting the product. By
removing the need to handle the returns, the manufacturer expects to save enough costs to
more than offset the increased payments to the retailer.
Under some zero returns programs, the store always receives a credit for a certain
percentage of sales, no matter how high the return rate. If the credit is 6%, and the actual
returns are only 2%, the retailer is happy, because it still receives a 6% credit. When the
opposite happens, the credit is set at 2%, and returns are 6%, the retailer loses. The idea
behind the program is that the credit will be set high enough to exceed the average returns
experienced by the retailer. However, given the power held by the large retailer chains, it
can be difficult for the manufacturer to prevail against the retailer in this situation.
Unfortunately, given the lax controls that many firms keep over their returns, the controls
over zero returns programs are lacking. Some manufacturers accuse retailers of “double-
dipping”, taking payment from the manufacturer for destroying the product and then
quietly selling the product out the back door to a secondary market firm.
8.6 Reverse logistics strategies
Depending on the life cycle of a manufacturer’s products and the value of the products,
firms will discover that different combinations of the above strategies will be needed to
effectively and efficiently handle their returns. For high-value products with short life-
cycles, such as computers, video games and camcorders, a POS system may be a very