Supply Chain Management New Perspectives Part 12 doc
Bạn đang xem bản rút gọn của tài liệu. Xem và tải ngay bản đầy đủ của tài liệu tại đây (896.65 KB, 40 trang )
Reverse Supply Chain Management - Modeling Through System Dynamics
427
Selected Variables
2,000
1,500
1,000
500
0
0 50 100 150 200 250 300 350 400 450 500
Time (Week)
unit/Week
D : Current
PR : Current
RPR : Current
Fig. 6. Demand, production and reprocessing
Selected Variables
200 unit/(Week*Week)
1,000 unit/Week
100 unit/(Week*Week)
500 unit/Week
0 unit/(Week*Week)
0 unit/Week
0 75 150 225 300 375 450
Time (Week)
CCIR : Current unit/(Week*Week)
CCRR : Current unit/(Week*Week)
COR : Current unit/Week
Fig. 7. Collection capacity
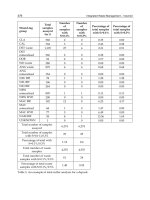
The collection capacity (Fig. 7) and the reprocessing capacity (Fig. 8) increase or decrease
according to the growth or reduction decisions they receive.
Supply Chain Management - New Perspectives
428
Selected Variables
400 unit/(Week*Week)
2,000 unit/Week
200 unit/(Week*Week)
1,000 unit/Week
0 unit/(Week*Week)
0 unit/Week
0 75 150 225 300 375 450
Time (Week)
RCIR : Current unit/(Week*Week)
RCRR : Current unit/(Week*Week)
RPC : Current unit/Week
Fig. 8. Reprocessing capacity
For the residence time (Fig. 9), a random sample of values has been estimated according to
a normal probability distribution with a minimum of 10 weeks, a maximum of 30 weeks,
and an average of 20 weeks with a standard deviation of 2 weeks.
RT
40
32.5
25
17.5
10
0 50 100 150 200 250 300 350 400 450 500
Time (Week)
Week
RT : Current
Fig. 9. Residence time
Reverse Supply Chain Management - Modeling Through System Dynamics
429
The volume of collected products usually exceeds the number of reusable products until the
end of the life of the product, when it increases (Fig. 10).
Selected Variables
2,000
1,500
1,000
500
0
0 50 100 150 200 250 300 350 400 450 500
Time (Week)
unit
CP : Current REP : Current
Fig. 10. Collected products and reusable products
The system also tends to ensure that the number of products disposed in an uncontrolled
manner stabilizes at values lower than those of the controlled disposal (Fig.11)
Selected Variables
80,000
60,000
40,000
20,000
0
0 50 100 150 200 250 300 350 400 450 500
Time (Week)
unit
DP : Current UDP : Current
Fig. 11. Controlled and uncontrolled disposed products
Supply Chain Management - New Perspectives
430
Selected Variables
6 M
4.5 M
3 M
1.5 M
-4
0 50 100 150 200 250 300 350 400 450 500
Time (Week)
€/Week
ILI : Current SI : Current
Fig. 12. Revenue
The revenue of the chain (Fig. 12) comes from sales and the final liquidation of the
inventories.
Selected Variables
20 M
15 M
10 M
5 M
0
0 50 100 150 200 250 300 350 400 450 500
Time (Week)
€/Week
ICOST : Current OCOST : Current
Fig. 13. Costs
Reverse Supply Chain Management - Modeling Through System Dynamics
431
The costs of the chain (Fig. 13) can either be operating costs or investment costs. The
operating costs essentially correspond to storage, transport and production and
reprocessing. The NCV of the whole chain has been estimated (Fig.14), showing that with
the parameters set for this model, the investment is recovered after week 165. It can also be
noted that there is a recovery of value as a result of the liquidation of inventories.
NPVWN
60 M
30 M
0
-30 M
-60 M
0 50 100 150 200 250 300 350 400 450 500
Time (Week)
€
NPVWN : Current
Fig. 14. Cumulative NCV of model
As anticipated at the beginning of this part of the section, the model is highly generic and
the answers obtained can vary greatly as a function of the input parameters which are set
according to the type of product and its life cycles. However, the parameters of expansion
and contraction of the collection and reprocessing capacities (Kc1. KC2, KR1 and KR2) have
a great impact on the results and this phenomenon should be analyzed in some future work.
6. Conclusion
The model developed represents quite accurately the behavior of a reverse supply chain for
a single product with reprocessing, so that the main proposal of this part of the work is
considered to be achieved. Phenomena such as the Bullwhip effect are represented in the
model as well as phenomena such as saturation on reaching the peak of the productive
capacity, and delays in the system responses resulting from the inertias acquired in the
operations.
The assessment of costs and revenues represents the phenomena of investment and
disinvestment in a logical way and the cumulative net present value shows that in the case
simulated, gains are made and it is therefore viable. It should not be forgotten that this is a
Supply Chain Management - New Perspectives
432
test case, a dummy, so that depending on the type of product that the model is applied to,
the economic results can vary significantly.
In short, we consider that modeling with system dynamics is an effective tool for describing
reverse logistics systems due to the existence of delays and feedback loops. Moreover,
system dynamics is a highly valuable and affordable method for performing simulations
since all the variables and parameters are known; it is thus distinct form other simulation
techniques that have more of a "black box" nature. Therefore we can conclude that it is a
highly useful tool for decision-making.
7. Annex 1. Model variables
VARIABLE OR
PARAMETE
R
SIGNIFICANCE OF VARIABLE OR PARAMETER
a-CC Parameter of delay in collection capacity
a-D Parameter delay in demand
a-DI Parameter of delay in distributors’ inventory
a-MI Parameter of delay in wholesalers’ inventory
a-RI Parameter of delay in retailers’ inventory
a-RPC Parameter of delay in reprocessing
a-RR Parameter of delay in reprocessing ratio
CCCCOST Costs of constructions for collection capacity
CCCR Ratio of contraction of collection capacity
CCDE Desired collection capacity
CCDI Discrepancy in collection capacity
CCER Ratio of expansion of collection capacity
CCIR Ratio of increase in collection capacity
CCOST Collection costs
CCRCOST Costs of reduction in collection capacity
CCRR Ratio of reduction in collection capacity
CCWCOST Weekly costs of collection capacity
CD Controlled disposal
CIC Coefficient of investment in collection
COR Collection capacity
CP Collected products
CR Collection ratio
CTCOST Costs of transport to clients
CWCOST Weekly costs of collection
Reverse Supply Chain Management - Modeling Through System Dynamics
433
VARIABLE OR
PARAMETE
R
SIGNIFICANCE OF VARIABLE OR PARAMETER
D Orders
DB Backorders
DCT Time of delivery to clients
DI Distributors’ inventory
DIAT Time of adjustment of distributors’ inventory
DICT Time of coverage of distributors’ inventory
DID Discrepancy with distributors’ inventory
DIDE Inventory of desired distributors
DIL Liquidation of distributors’ inventory
DILI Revenue from liquidation of distributors’ inventory
DILT Time of liquidation of distributors’ inventory
DISCOST Cost of storage of distributors’ inventory
DISWCOST Weekly cost of storage of distributors
DLP Distributors’ liquidation price
DO Distributors’ orders
DORR Ratio of reduction of backorders
DP Waste products
DST Time of delivery to distributors
DTCOST Cost of transport to distributors
DTWCOST Weekly cost of transport to distributors
ED Expected demand
EDO Orders expected from distributors
EMO Orders expected from wholesalers
ERO Orders expected from retailers
FP Percentage of error
ICOST Investment costs
ILI Revenue from liquidation of inventories
ILPI Revenue from liquidation of inventories of the plant
IT Inspection time
Kc1 Parameter of increase in collection capacity
Kc2 Parameter of reduction in collection capacity
Kr1 Parameter of increase in reprocessing capacity
Supply Chain Management - New Perspectives
434
VARIABLE OR
PARAMETE
R
SIGNIFICANCE OF VARIABLE OR PARAMETER
Kr2 Parameter of reduction in reprocessing capacity
LPP Liquidation price in plant
MBO Wholesalers’ Backorders
MFL Minimum for liquidation
MI Wholesalers’ inventory
MIAT Time of adjustment of wholesalers’ inventory
MICT Time of coverage of wholesalers’ inventory
MIDE Inventory of desired wholesalers
MIDI Discrepancy with wholesalers’ inventory
MIL Liquidation of wholesalers’ inventory
MILI Revenue from liquidation of wholesalers’ inventory
MILT Time of liquidation of wholesalers’ inventory
MISCOST Storage costs of wholesalers’ inventory
MISWCOST Weekly storage cost of wholesalers’ inventory
MLP Price of liquidation of retailers
MLPR Price of liquidation of wholesalers
MO Wholesalers’ orders
MOBRR Ratio of reduction in wholesalers’ backorders
MP Materials for processing
MS Deliveries to wholesalers
MSICOST Storage costs of retailers’ inventory
MSIWCOST Weekly storage costs of retailers’ inventory
MST Time of delivery to wholesalers
MTCOST Cost of transport to wholesalers
MTWCOST Weekly cost of transport to wholesalers
NCF Net cash flow
NPVP Current value of the period
NPVWN Current net value of the whole network
OB Backorders
OBRR Ratio of reduction of backorders
OCOST Operating costs
PARU Products accepted for reuse
Reverse Supply Chain Management - Modeling Through System Dynamics
435
VARIABLE OR
PARAMETE
R
SIGNIFICANCE OF VARIABLE OR PARAMETER
PC Production capacity
PCOST Production costs
PD Peak demand
PLIR Revenue from liquidation of retailers’ inventories
PR Production ratio
PRR Products rejected for reuse
PT Production Time
PTCOST Total costs per period
RCC Coefficient of reduction in collection
RCCCOST Costs of constructions for reprocessing capacity
RCCR Ratio of contraction in reprocessing capacity
RCDE Desired reprocessing capacity
RCER Ratio of expansion of reprocessing capacity
RCIR Ratio of increase in reprocessing capacity
RCRCOST Costs of reduction in reprocessing capacity
RCRR Ratio of reduction in reprocessing capacity
RCWCOST Weekly cost of reprocessing capacity
REP Reusable products
RER Expected reprocessing ratio
RI Retailers’ inventory
RIAT Time of adjustment to retailers’ inventory
RICOST Coefficient of investment in reprocessing
RICT Time of coverage of retailers’ inventory
RIDE Inventory of desired retailers’ inventory
RIDI Discrepancy with retailers’ inventory
RIL Liquidation of retailers’ inventory
RILT Time of liquidation of retailers’ inventory
RO Retailers’ orders
ROB Retailers’ backorders
ROBRR Ratio of reduction of retailers’ backorders
RPC Reprocessing capacity
RPCD Discrepancy with reprocessing capacity
Supply Chain Management - New Perspectives
436
VARIABLE OR
PARAMETE
R
SIGNIFICANCE OF VARIABLE OR PARAMETER
RPCOST Reprocessing costs
RPR Reprocessing ratio
RPSCOST Cost of storage of reusable products
RPT Reprocessing time
RRC Coefficient of reduction in reprocessing
RS Deliveries to retailers
RSKT Waiting time for reusable stock
RSPWCOST Weekly cost of storage of reusable products
RST Time of delivery to retailers
RT Time of residence
RTCOST Cost of transport to retailers
RTWCOST Weekly cost of transport to retailers
RWCOST Weekly cost of reprocessing
S Sales
SD Deliveries to distributors
SI Revenue from sales
SMPO Products sent to secondary markets
SP Sales price
STWCOST Weekly cost of sales transport
TIP Total revenue per period
Tc1 Time of increase in collection capacity
Tc2 Time of reduction in collection capacity
TPD Total demand pattern
Tr1 Time of increase in reprocessing capacity
Tr2 Time of reduction in reprocessing capacity
UD Uncontrolled disposal
UDP Products disposed of uncontrollably
UI Useful inventory
UIAT Time of adjustment to useful inventory
UICT Time of coverage of useful inventory
UID Discrepancy with useful inventory
UIDE Desired useful inventory
Reverse Supply Chain Management - Modeling Through System Dynamics
437
VARIABLE OR
PARAMETE
R
SIGNIFICANCE OF VARIABLE OR PARAMETER
UIL Liquidation of useful inventory
UILT Time of liquidation of useful inventory
UISCOST Cost of storage of useful inventory
UISWCOST Weekly cost of storage of useful inventory
UP Used products
WDR Weekly discount rate
WPCOST Weekly production costs
8. Annex 2. Model equations
Below are presented all of the equations that intervene in the model, numbered and ordered
alphabetically according to the name of the variables that describe them.
(001) "a-CC"= 12 Units: week Delay Parameter
(002) "a-D"= 2 Units: week Delay Parameter
(003) "a-DI"=2 Units: week Delay Parameter
(004) "a-MI"=2 Units: week Delay Parameter
(005) "a-RI"=2 Units: week Delay Parameter
(006) "a-RPC"=2 Units: week Delay Parameter
(007) "a-RR"=24 Units: week Delay Parameter
(008) CCCCOST=20000 Units: €/units
(009) CCCR=IF THEN ELSE(CCDE>lbc, MAX(-CCDI*Kc2, 0), COR) Units: units/week
(010) CCDE=SMOOTH(UP, "a-CC") Units: units/week
(011) CCDI=IF THEN ELSE(ABS(CCDE-COR)>lbc, CCDE-COR, 0) Units: units/week
(012) CCER=MAX(Kc1*CCDI, 0) Units: units/week
(013) CCIR=SMOOTH(CCER, Tc1) Units: (units/week)/week
(014) CCOST=5 Units: €/units
(015) CCRCOST= 5000 Units: €/units
(016) CCRR=CCCR/Tc2 Units: units/(week*week)
(017) CCWCOST= CIC*CCCCOST+RCC*CCRCOST Units: €/week
(018) CD=REP/RSKT Units: units/week
(019) CIC=CCER^0.6 Units: units/week
(020) COR= INTEG (CCIR-CCRR,0) Units: units/week
(021) CP= INTEG (CR-PARU-PRR,0) Units: units
(022) CR=MIN(COR, UP) Units: units/week
(023) CTCOST=1 Units: €/units
(024) CWCOST=CR*CCOST Units: €/week
(025) D=TPD(Time) Units: units/week
(026) DB= INTEG (D-DORR,0) Units: units
(027) DCT= 2 Units: week
(028) DI= INTEG (SD-MS-DIL,0) Units: units
Supply Chain Management - New Perspectives
438
(029) DIAT= 1 Units: week
(030) DICT= 2 Units: week
(031) DID= MAX(DIDE-DI, 0) Units: units
(032) DIDE=EMO*DICT Units: units
(033) DIL=IF THEN ELSE(DIDE<MFL, DI/DILT, 0) Units: units/week
(034) DILI=DLP*DIL Units: €/week
(035) DILT=1 Units: week
(036) DISCOST=0.4 Units: €/(units*week)
(037) DISWCOST=DISCOST*DI Units: €/week
(038) DLP= 550 Units: €/units
(039) DO=EMO+DID/DIAT Units: units/week
(040) DORR=S Units: units/week
(041) DP= INTEG (CD+PRR,0) Units: units
(042) DST= 2 Units: week
(043) DTCOST=1 Units: €/units
(044) DTWCOST= DTCOST*SD Units: €/week
(045) ED=SMOOTH(D, "a-D") Units: units/week
(046) EDO= SMOOTH(DO, "a-DI") Units: units/week
(047) EMO= SMOOTH(MO, "a-MI") Units: units/week
(048) ERO= SMOOTH(RO, "a-RI") Units: units/week
(049) FINAL TIME=500 Units: week The final time for the simulation.
(050) FP=0.2 Units: Dmnl
(051) ICOST=CCWCOST+RCWCOST Units: €/week
(052) ILI=DILI+ILPI+MILI+PLIR Units: €/week
(053) ILPI=LPP*UIL Units: €/week
(054) INITIAL TIME=0 Units: week The initial time for the simulation.
(055) IT=1 Units: week
(056) k=1/(1+WDR)^Time Units: Dmnl Expression of discount rate for the net
current value (NCV). The discount rate is for a period of one week.
(057) Kc1=5 Units: Dmnl
(058) Kc2=1 Units: Dmnl
(059) Kr1=50 Units: Dmnl
(060) Kr2=1.8 Units: Dmnl
(061) lbc=0.05*PD Units: units/week
(062) lbr=0.05*PD Units: units/week
(063) LPP=550 Units: €/units
(064) MBO= INTEG (MO-MOBRR,0) Units: units
(065) MFL=10 Units: units
(066) MI= INTEG (MS-MIL-RS,0) Units: units
(067) MIAT=1 Units: week
(068) MICT=2 Units: week
(069) MIDE=ERO*MICT Units: units
(070) MIDI=MAX(MIDE-MI,0) Units: units
(071) MIL=IF THEN ELSE(MIDE<MFL, MI/MILT, 0) Units: units/week
Reverse Supply Chain Management - Modeling Through System Dynamics
439
(072) MILI=MLPR*MIL Units: €/week
(073) MILT= 1 Units: week
(074) MISCOST=0.4 Units: €/units
(075) MISWCOST=MISCOST*MI Units: €/week
(076) MLP= 550 Units: €/units
(077) MLPR=550 Units: €/units
(078) MO=ERO+MIDI/MIAT Units: units/week
(079) MOBRR=MS Units: units/week
(080) MP= INTEG (-PR, 1e+007) Units: units
(081) MS=MAX( MIN(DI, MBO)/MST, 0) Units: units/week
(082) MSICOST=0.4 Units: €/units
(083) MSIWCOST=MSICOST*RI Units: €/week
(084) MST= 2 Units: week
(085) MTCOST=1 Units: €/units
(086) MTWCOST= MTCOST*MS Units: €/week
(087) NCF= (TIP-PTCOST)/(1+0.001) Units: €/week
(088) NPVP=NCF*k Units: €/week. The NCV is calculated for each period;
that is, in intervals of a week.
(089) NPVWN= INTEG (NPVP,0) Units: €. The NCV is calculated for the whole of
the supply chain.
(090) OB= INTEG (DO-OBRR,0) Units: units
(091) OBRR=SD Units: units/week
(092) OCOST= DISWCOST + UISWCOST + RSPWCOST + WPCOST + CWCOST +
RPWCOST + DTWCOST + STWCOST + RTWCOST + MSIWCOST + MISWCOST +
MTWCOST. Units: €/week
(093) PARU=CP*(1-FP)/IT Units: units/week
(094) PC=2000 Units: units/week
(095) PCOST=800 Units: €/units
(096) PD=1000 Units: units/week
(097) PLIR= MLP*RIL Units: €/week
(098) PR=MAX(MIN(PC, MIN( MP/PT, EDO-RER+UID/UIAT)), 0) Units: units/week
(099) PRR= CP*FP/IT Units: units/week
(100) PT=2 Units: week
(101) PTCOST=ICOST+OCOST Units: €/week
(102) RCC= CCRR^0.6 Units: units/week
(103) RCCCOST=120000 Units: €/units
(104) RCCR=IF THEN ELSE(RCDE>lbr, MAX(-RPCD*Kr2, 0), RPC) Units: units/week
(105) RCDE=SMOOTH(S*(1-FP), "a-RPC") Units: units/week
(106) RCER=MAX(Kr1*RPCD, 0) Units: units/week
(107) RCIR=SMOOTH(RCER, Tr1) Units: (units/week)/week
(108) RCRCOST= 40000 Units: €/units
(109) RCRR=RCCR/Tr2 Units: units/(week*week)
(110) RCWCOST= RICOST*RCCCOST+RRC*RCRCOST Units: €/week
(111) REP= INTEG (PARU-CD-RPR,0) Units: units
Supply Chain Management - New Perspectives
440
(112) RER= SMOOTH(RPR, "a-RR") Units: units/week
(113) RI= INTEG (RS-RIL-S,0) Units: units
(114) RIAT= 1 Units: week
(115) RICOST=RCER^0.6 Units: units/week
(116) RICT= 2 Units: week
(117) RIDE=ED*RICT Units: units
(118) RIDI= MAX(RIDE-RI, 0) Units: units
(119) RIL=IF THEN ELSE(RIDE<MFL, RI/RILT, 0) Units: units/week
(120) RILT= 1 Units: week
(121) RO=ED+RIDI/RIAT Units: units/week
(122) ROB= INTEG (RO-ROBRR,0) Units: units
(123) ROBRR=RS Units: units/week
(124) RPC= INTEG (RCIR-RCRR,0) Units: units/week
(125) RPCD=IF THEN ELSE(ABS(RCDE-RPC)>lbr, RCDE-RPC, 0) Units: units/week
(126) RPCOST=25 Units: €/units
(127) RPR= MAX( MIN(REP/RPT, RPC), 0) Units: units/week
(128) RPSCOST= 0.4 Units: €/(week*units)
(129) RPT= 1 Units: week
(130) RPWCOST= RPR*RPCOST Units: €/week
(131) RRC= RCRR^0.6 Units: units/week
(132) RS=MAX( MIN(MI, ROB)/RST, 0) Units: units/week
(133) RSKT=4 Units: week
(134) RSPWCOST=REP*RPSCOST Units: €/week
(135) RST= 2 Units: week
(136) RT=RANDOM NORMAL(10, 30, 20, 2, 5) Units: week
(137) RTCOST=1 Units: €/units
(138) RTWCOST= RS*RTCOST Units: €/week
(139) S=MIN(DB, RI)/DCT Units: units/week
(140) SAVEPER = TIME STEP Units: week [0,?] The frequency with which output is
stored.
(141) SD=MAX( MIN(UI, OB)/DST, 0) Units: units/week
(142) SI=SP*S Units: €/week
(143) SMPO= INTEG (DIL+MIL+RIL+UIL,0) Units: units
(144) SP=1100 Units: €/units
(145) STWCOST=S*CTCOST Units: €/week
(146) Tc1= 8 Units: week
(147) Tc2= 8 Units: week
(148) TIME STEP = 1 Units: week [0,?] The time step for the simulation.
(149) TIP=SI+ILI Units: €/week
(150) TPD([(0,0)-(600,2000)],(0,0),(10,30),(20,100),(30,800),(40,900),(50,1000),(129,1000),
(130,1000),(180,1000),(181,1000),(200,1000),(210,900),(220,800),(230,100),(240,30),(250,0),(300,0)
,(500,0)) Units: units/week. Expected pattern of demand. Estimation according to the life
cycle of the various products.
(151) Tr1=24 Units: week
Reverse Supply Chain Management - Modeling Through System Dynamics
441
(152) Tr2=8 Units: week
(153) UD=UP-CR Units: units/week
(154) UDP= INTEG (UD, 0) Units: units
(155) UI= INTEG (PR+RPR-SD-UIL,0) Units: units
(156) UIAT= 1 Units: week
(157) UICT= 2 Units: week
(158) UID=UIDE-UI Units: units
(159) UIDE=EDO*UICT Units: units
(160) UIL=IF THEN ELSE(UIDE<MFL, UI/UILT, 0) Units: units/week
(161) UILT= 1 Units: week
(162) UISCOST= 0.4 Units: €/(units*week)
(163) UISWCOST=UI*UISCOST Units: €/week
(164) UP=SMOOTH(S,RT) Units: units/week
(165) WDR=0.001 Units: Dmnl An annual discount rate of 5.2%
has been assumed, which means 0.1% per week.
(166) WPCOST=PCOST*PR Units: €/week
9. References
Fleischmann, M., Bloemhof-Ruwaard, J.M., Dekker, R. & van der Laan, E. 1997,
"Quantitative models for reverse logistics: A review", European Journal of Operational
Research, vol. 103, no. 1, pp. 1.
Fleischmann, M., Krikke, H.R., Dekker, R. & Flapper, S.D.P. 2000, "A characterisation of
logistics networks for product recovery", Omega, vol. 28, no. 6, pp. 653.
Forrester, J.W. 1961, Dinámica Industrial, "El Ateneo".
Georgiadis, P. & Vlachos, D. 2004, "The effect of environmental parameters on product
recovery", European Journal of Operational Research, vol. 157, no. 2, pp. 449-464.
Georgiadis, P., Vlachos, D. & Tagaras, G. 2006, "The Impact of Product Lifecycle on Capacity
Planning of Closed-Loop Supply Chains with Remanufacturing", Production and
Operations Management, vol. 15, no. 4, pp. 514.
Guide, V.D.R.,Jr & Srivastava, R. 1997, "Buffering from material recovery uncertainty in a
recoverable manufacturing environment", The Journal of the Operational Research
Society, vol. 48, no. 5, pp. 519.
Inderfurth, K., de Kok, A.G. & Flapper, S.D.P. 2001, "Product recovery in stochastic
remanufacturing systems with multiple reuse options", European Journal of
Operational Research, vol. 133, no. 1, pp. 130.
Jayaraman, V., Guide, V.D.R. & Srivastava, R. 1999, "A closed-loop logistics model for
remanufacturing", The Journal of the Operational Research Society, vol. 50, no. 5, pp.
497.
Kroon, L. & Vrijens, G. 1995, "Returnable containers: An example of reverse logistics",
International Journal of Physical Distribution & Logistics Management, vol. 25, no. 2, pp.
56.
Martín Garcia, J. 2003, Teoría y Ejercicios prácticos de Dinámica de Sistemas, ed. el autor.
Supply Chain Management - New Perspectives
442
Mostard, J. & Teunter, R. 2006, "The newsboy problem with resalable returns: A single
period model and case study", European Journal of Operational Research, vol. 169, no.
1, pp. 81.
Pérez Ríos, J. 1992, Dirección Estratégica y Pensamiento Sistémico, Universidad de Valladolid.
Prahinski, C. & Kocabasoglu, C. 2006, "Empirical research opportunities in reverse supply
chains", Omega, vol. 34, no. 6, pp. 519-532.
Rogers, D. & Tibben-Lembke, R.S. 1999, Going Backwards: Reverse Logistics Trends and
Practices. Pittsburgh: RLEC Press.
Srivastava, S.K. 2007, "Green supply-chain management: A state-of-the-art literature
review", International Journal of Management Reviews, vol. 9, no. 1, pp. 53-80.
Sterman, J.D. 1989, "Modeling Managerial Behavior: Misperceptions Of Feedback In",
Management Science, vol. 35, no. 3, pp. 321.
Vlachos, D., Georgiadis, P. & Iakovou, E. 2007, "A system dynamics model for dynamic
capacity planning of remanufacturing in closed-loop supply chains", Computers &
Operations Research, vol. 34, no. 2, pp. 367-394.
21
Improving the Supply Chain of
Non-Timber Forest Products
in Ghana
Albert Ahenkan and Emmanuel Boon
Human Ecology Department Vrije
Universiteit Brussel,
Laarbeeklaan 103,
Jette-Brussels
Belgium
1. Introduction
Traditionally, NTFPs play an important role worldwide. In many areas, animal and plant
resources derived from forests remain central to subsistence and local economies. The
FAO estimated that (80%) of the population of the "developing" world use NTFPs to meet
some of their health and nutritional needs (FAO, 1997).The importance of NTFPs in
supporting livelihood of forest dependent communities has been widely promoted due to
the recognition that NTFPs can contribute to improve the livelihoods of forest dependent
communities (Belcher et al., 2005; Clendon, 2001; FAO, 2006; Marshall et al 2005; Ros-
Tonen & Wiersum, 2005); household food security and nutrition (Clark & Sunderland,
2004; FAO, 1995; Shacleton & Shackleton, 2004); generate additional employment and
income (Marshall et al., 2003; Peters, 1996; Ros-tonen; 1999); and offer opportunities for
NTFP-based enterprises (Shackleton & Shackleton, 2004; Subedi, 2006). Moreover, NTFPs
are more accessible to the poor (Saxena 2003); contribute to foreign exchange earnings
(Andel, 2000; Shiva & Verma, 2002); and support biodiversity and other conservation
objectives (FAO, 1995, Marshall et al., 2005; Arnold and Ruiz Pérez, 2001; Charlie and
Sheona, 2004).
Furthermore, NTFPs can be harvested with relatively little impact on the forest
environment (FAO, 2008; Myers 1988; Neumann & Hirsch, 2000). The importance of NTFPs
goes beyond meeting basic needs. NTFPs are also rapidly growing at the international
market. A recent FAO study suggests that at least 150 NTFPs are of major significance in
international trade (FAO 1995, Shiva &Verma, 2002), including medicinal plants,
mushrooms, snails, essential oils, tannin extracts, gums, nuts, rattans and bamboo. The total
value in world trade in NTFP is estimated at approximately US$ 11 billion (Ndoye & Ruiz
Perez, 1998; Shiva & Verma, 2002), and the market has grown by nearly 20% annually over
the last several years (Hammet, 1999). Future development of NTFPs offers a potential
for increasing income, expanding opportunities, and diversifying enterprises in rural
areas.
Supply Chain Management - New Perspectives
444
Plant products Animals and animal products
Categories Description Categories Description
Food Ve
g
etal foodstuff and bevera
g
es
provided by fruits, nuts, seeds, roots
Living
animals
Mainly vertebrates such
as mammals, birds,
reptiles
Fodder Animal and bee fodder
provided by leaves, fruits etc.
Honey,
beeswax
Products provided b
y
bees.
Medicines
Medicinal plants (e.g. leaves, bark,
roots) used in traditional medicine
and/or by pharmaceutical
companies
Bushmeat Meat provided by
vertebrates, mainly
mammals
Perfumes
and
cosmetics
Aromatic plants providin
g
essential
(volatile) oils and other products
used for cosmetic purposes
Other edible
animal
products
Mainly edible
invertebrates such as
insects (e.g.
caterpillars), crabs and
other “secondary”
products of animals
(e.g. eggs)
Dying and
tanning
Plant material (mainly bark and
leaves) providing tannins and other
plant parts (especially leaves and
fruits) used as colorants
Hides, skins
Hide and skin of
animals
used for various
purposes
Utensils,
handicrafts
Heterogeneous group of products
including thatch, bamboo, rattan,
wrapping leaves, fibres (e.g.
Arouma,
Bwa Flo, Silk cotton floss,
Screw pine)
Medicine
Entire animals or parts
of animals such as
various organs used for
medicinal purposes
(e.g. caterpillars, crab
legs, snake)
Construction
materials
thatch, bamboo, fibres,
Ornamentals
Entire plants (e.g. orchids,
ferns, philodendron) and
parts of the plants (e.g. pots
made from roots) used for
ornamental purposes
Colorants
Entire animals or parts
of animals such as
various organs used as
colorants
Exudates
Substances such as gums (water
soluble), resins (water insoluble) and
latex (milky or clear juice), released
from plants by exudation
Other
nonedible
animal
products
e.g. bones used as tools
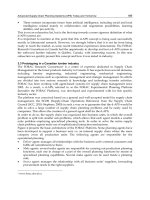
Adapted from FAO, 1995; Shiva & Verma,2002
Table 1. Classification of Non Timber Forest Products
Improving the Supply Chain of Non-Timber Forest Products in Ghana
445
In Ghana, thousands of people across the country produce and market a diverse range of
NTFPs on daily basis in the local, regional and international markets (Ahenkan & Boon,
2010). Despite the enormous potential of NTFPs to support rural livelihoods, the NTFPs
supply chain has received very little attention from the scientific community. Several
constraints hinder an effective management of the NTFPs supply chain for optimizing
income generation and improvement of rural livelihoods. The information base of NTFPs
in Ghana is still poor because research on them is relatively new and has received very
little formal study. There is a serious lack of basic statistical information on their volumes,
trade, income and nutritional values. The low representation of NTFPs in policy-making
is due to the inadequate statistical information on NTFPs.NTFPs have not been accorded
adequate attention in development planning and in nutrition improvement programmes
in the country. Existing information sources are dispersed and no standardized system for
compiling data on NTFPs is in place.
In today’s global market, an effective management of the entire supply chain of NTFPs has
become a key factor for their successful commercialization. The NTFPs supply chain is
typically comprises a range of actors involved in
the production of the products at the farm
level to the final consumer. It is a network of producers, gatherers, collectors, retailers,
distributors, transporters, suppliers and sellers that participate in the delivery and sale of
the products to the final consumer at the local, regional, national and international level.
Improving the supply chain of NTFPs has become very important in the efforts of most
developing countries trying to enhanc
e the economic empowerment of the rural poor. This
chapter seeks to examine the NTFPs supply chain activities, actors and the key challenges of
supply chain management.
1.1 Definition and classification of NTFPs
NTFPs are “biological resources of plant and animal origin, harvested from natural
forests, manmade plantations, wooded land, farmlands, trees outside forests and or
domesticated” (FAO, 1999; Peters, 1996; Marshall et al., 2005; Wong, 2000). NTFPs
include fruits and berries, nuts, spices, medicinal plants, oils, gums, resins, honey,
mushrooms, weaving and dying materials, aromatics, and recreation (FAO, 1995;
Thomas & Schumann, 1993; Shiva &Verma, 2002). These products such as these are vital
sources of income, nutrition and sustenance for many forest-based communities around
the world. A globally applicably standard classification system for NTFPs does not exist
(Shiva & Verma, 2002). However, NTFPs can be classified in many different ways:
according to end use (medicine, food, drink, etc), by the part used (roots, leaves,
barks, etc); or in accordance with major international classification systems such
as the Harmonized Community Description and Coding System developed under the
auspices of the Customs Cooperation Council (Shiva & Verma , 2002). For the purpose
of this research, NTFPs are classified according to their end uses as indicated in
Table 1.
2. Importance of NTFPs in Ghanaian economy
NTFPs play an important role in the Ghanaian economy by way of supporting rural
livelihoods. They contribute significantly to the income and food security of many rural
Supply Chain Management - New Perspectives
446
households in Ghana (Ahenkan & Boon, 2008; Falconer, 1992; FAO, 2001). Aggregate
employment generation in forest product activities in Ghana is estimated to be growing at
6.9 percent per year (Townson, 1995). These products contribute significantly to
household food security, nutrition, health, and income, especially during the lean seasons
(Ahenkan & Boon, 2008). A considerable amount of food and medicinal plants are
gathered from the forest. It is estimated that 20 percent of the economically active
population derive income from NTFPs and 38% of the household in Ghana trade in
NTFPs (Townson, 1995). In a similar study covering households in villages around the
large market centre of Kumasi, Falconer (1994) found that 68% of the households
surveyed were involved in supplying NTFPs to the market. Among persons generating
some income from forest products activities in households surveyed in southern Ghana,
72% identified this income to be important either in absolute terms, or in meeting
particular needs, or because of its timing (Townson,1995). NTFPs are also used by people
in Ghana to cure various diseases (Abbiw, 1990; Ahenkan & Boon, 2008). Rural people
particularly depend very much on traditional medicinal sources for their health. Falconer
(1994) and Abbiw (1990) have tabulated different medicinal plants and animal products
used to cure various diseases in Ghana. Trade and use of plant products have assumed
a wider dimension with more plant medicinal products being traded in the local
markets.
2.1 The conceptual framework of NTFPs supply chain in Ghana
The conceptual framework on which this chapter is anchored is that supply chain
management can help to boost the production of NTFPs and improve rural livelihoods
through commercialization. NTFPs commercialization is a defined as a process of
increasing the value of these products in trade so as to improve income and employment
opportunities. The principal premise of this chapter is that the success of NTFPs
commercialization is dependent on an effective management of the supply chain
challenges.
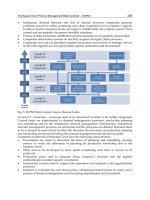
As is illustrated in Figure 1, NTFPs commercialization involves a complex process that
involves farming or wild harvesting, processing, packaging, labeling, transportation
and marketing of the products to final consumers. The marketing channels for NTFPs
are diverse and in some cases, complex (Marshall et al., 2003). A clear understanding of
the commodity chain for specific NTFPs is important if we are to understand where
interventions to benefit harvesters would be most successful and productive. The
relationship between NTFP producers and the markets they supply range from direct
sale to consumers to a complex network of middlemen and retailers. Many hundreds of
millions of people across the developing world trade in a diverse range of NTFPs
everyday and which are marketed primarily in local and regional markets (Scherr et al.
2004). Building materials, fuelwood, charcoal, indigenous foodstuffs, medicines, craft
items (from wood, grass, reeds, and vines), farm and household implements, furniture,
and other more specialised products such as resins, honey, oils and alcoholic
beverages are examples of just some of the products that may be found for sale in the
vast majority of rural markets and in nearby towns and cities. Many of these markets
are growing through both the entry of new products and growth in existing
trade.
Improving the Supply Chain of Non-Timber Forest Products in Ghana
447
Source: Adopted from Ahenkan and Boon, 2010; IUCN, 2008
Fig. 1. The Supply Chain of NTFPs
3. Materials and methods
3.1 Study area
The Bibiani-Bekwai and Sefwi Wiawso Districts are located in the Western Region of Ghana.
They fall within the moist semi-deciduous forest zone of Ghana, which covers most of
Ashanti, Western, Brong Ahafo and Eastern regions. The two districts were selected for the
study because they constitute a major area for NTFPs in Ghana and have common
ecological, social, and economic characteristics that indicate high forest dependence. Figure
2 is a map of Ghana showing the Western Region and the study locations.
Supply Chain Management - New Perspectives
448
3.2 Data collection
The study was designed as an exploratory and qualitative research because little organised
information of NTFPs exist in Ghana. Bibiani-Bekwai and Sefwi Wiawso Districts in the
Western Region of Ghana were the study areas. These two districts were selected because
they constitute a major area for NTFPs in Ghana and have common natural, social, and
economic characteristics that indicate high forest dependence. Previous studies on NTFPs in
other part of the world (Belcher, 2003; Greene et al., 2000; Hammett and Chamberlain, 1999;
Marshall et al., 2005; te Velde et al., 2004) which used exploratory and qualitative designs
provided the inspiration for modeling this study. A field survey was conducted between
May 2010 to July 2010 and in March 2011. The survey aimed at understanding the supply
chain of NTFPs in Ghana, the existing marketing system and the key challenges.
The data was purposively collected through interviews and adminsistration of
questionnaires to 200 actors in the NTFPs chain, including producers, collectors and sellers
of NTFPs from 10 communities in the two districts. Non-probability sampling method was
also utilised: snowball, where market actors were found as a reference from other
respondents. A market survey covering two markets over a period of 6 months was also
carried out to collect data about the types of NTFPs marketed, the local and seasonal
variations in product prices and supply. The market survey also provided data to fill the
gaps in the household survey.
Source:
Fig. 2. Map of Ghana Showing the Western Region and the Study Area
Improving the Supply Chain of Non-Timber Forest Products in Ghana
449
In addition, a stakeholder workshop was organized which brought together 50 participants
including traders, agricultural extension officers and NTFPs farmers/collectors from the 10
selected communities. The workshop identified main production, processing, marketing and
policy challenges facing NTFPs actors. Participant observation comprising of visitation to
NTFPs farms of 50 respondents, market centres and traders during the survey period. The
aim was to experience the production, harvesting, processing and marketing of NTFPs and
also verify and identify various NTFPs that farmers collect, consume or trade in. The
observations and visitations helped to verify and identify various NTFPs that farmers
collect, consume or trade in. The data collected through administration of questionnaires,
interviews and stakeholder consultations were analysed both quantitatively and
qualitatively using statistical methods. The quantitative analysis was done using the
Statistical Package for Social Sciences (SPSS version 17) and the results analyzed and
presented in the form of descriptive statistics descriptive statistics.
4. Results and discussion
4.1 NTFPs supply chain activities and challenges in Ghana
NTFPs supply chain activities involve a network of activities ranging from production to
consumption. A number of critical factors continue to constrain the ability of NTFP
producers/collectors to exploit the full potential of commercialization of NTFPs in Ghana.
The survey identified a number of factors that hinder effective management of the supply
chain of NTFPs during the production, harvesting, processing, packaging and marketing
stages. Generally, NTFPs are produced and harvested for both subsistence and commercial
use under a broad range of regimes, ranging from strictly wild harvested, semi-
domesticated and more intensively managed systems in the study locations. The study
reveals that most of the NTFPs are picked freely from the forest during the season they
blossom. This is obviously unsustainable since the extraction of NTFPs from natural forests
has limited potential. Consequently, sustainable production and supply of NTFPs has been
threatened due to inappropriate harvesting practices. In some cases, collectors cut plants
that are too
young or too close to ground and this inhibits re-sprouting. This over-
exploitation is also
due to the high demand for NTFPs. Some medicinal plants have
progressively become depleted and extinct because their harvesting exceeds annual
production. During the focus group discussions it was revealed that most communities in
the two districts are losing access to these valued NTFPs either because of over-exploitation
and habitat destruction. Three main strategies have been employed to militate against
shortfalls in supply of NTFPs in most of the communities surveyed: travel further to find the
products, substituting a particular product with a similar one or develop a more intensive or
cultivated sources of supply.
As a result of the recognition that the extraction of NTFPs from natural forests has limited
potential for improving household income and nutrition, or cannot be harvested indefinitely
without proper management practices and domestication to sustain their yield, most of the
farmers (54%) have started domesticating some of these products of forest origin, including
honey, mushrooms, snails, grass-cutters, medicinal and aromatic plants and fruits. Key
challenges indentified during the production and harvesting stages include high cost of
production, inadequate supply of inputs and harvesting accessories. In an in-depth with the
District Directorate of Agriculture in the Sefwi Wiawso District, he noted that “any strategy
towards promoting and improving NTFPs farming in the district must tackle the issue of high costs
Supply Chain Management - New Perspectives
450
of production”. The cost of procuring production equipment or construction of NTFPs
domestication structures and inputs for activities such as beekeeping, grass-cutters and
snails is very high.
4.2 Processing skills and storage facilities
Another important challenge facing the supply chain of NTFPs in Ghana is the lack of
processing and packaging skills. The NTFPs enterprise has not received the kind of support
given to agriculture and forestry sectors in Ghana. Producers remain largely neglected by
national and local government development strategies. Though a potential international
market exists, producers cannot exploit it because of their inability of farmers to package
NTFPs to meet domestic and international standards. Most of the farmers lack the necessary
skills in processing, packaging and labeling the products. Over 90 % of the producers sell
products either in their raw form without adding value. A significant proportion of the
respondents (67.5%) cited lack of processing skills, equipment and financial assistance the
most important constraints hindering the supply chain of NTFPs in the districts. The lack of
processing and storage facilities is a major constraint hindering the sustainable management
of NTFPs supply chain in Ghana. Most products like mushrooms get spoilt within a few
days after harvesting. The deplorable state of the feeder road network in the country,
particularly the roads linking agricultural communities to market centres affect the
marketing of NTFPs in Ghana. Absence of local food processing and storage facilities also
affects the marketing of NTFPs also affects the marketing of the products both locally and
internationally.
4.3 NTFPs Labeling and certification challenges
The imprope Labeling and certification of NTFPs are major challenges to the NTFPs supply
chain in Ghana. Compliance with quality standards is one in the marketing of NTFPs in
Ghana. While discussions on NTFPs labeling and certification have increased recently, the
applicability and its impact as a tool to promote the development of NTFPs remains unclear.
Certification is defined by the International Organization for Standardization (ISO, 1996) as
a procedure by which written assurance is given that a product, process or service is in
conformity with certain standards. Standards for labeling of NTFPs in Ghana are not well
developed and are not well developed. This is
hindering the promotion of NTFPs in the
country. Although, the quality aspects of food products are taken care of by Drugs Board,
unfortunately most of the producers are not organized due to their locations. They are
isolated and sell these products locally to individual customers without meeting the
required international standards. Although there is potential for the international market for
some NTFPs in Ghana, farmers have very limited capacity in meeting international
standards. Lack of standardization is an important constraint of NTFPs supply chain in
Ghana. Moreover, the quantities of products produced are insufficient and fail to meet
international market standards. Eighty (80%) of the respondents surveyed have no idea
about packaging and labeling requirements of NTFPs. Trade in certified NTFPs is still
marginal compared to the trade of non-certified products. Major challenges of NTFPs
labeling and certification in Ghana include lack of market demand, high costs of certification
system, insufficient product definition and classification system since many NTFPs are not
included in international classification or standardization systems.
Improving the Supply Chain of Non-Timber Forest Products in Ghana
451
4.4 Marketing of NTFPs in Ghana
According to Marshall et al. (2005), the most constraining processes of NTFP
commercialization are marketing and sales which are also major bottlenecks for many
NTFPs farmers in rural Ghana. Thousands of people, especially women, are involved in the
collection and marketing of NTFPs in Ghana and for many, it provides the main source of
income (Falconer, 1994). It involves a great number of people selling a vast array of
products, including mushroom, snails, bushmeat, honey, leaves, medicinal plants, food
wrapping leaves, and chewing sticks etc. The NTFPs market in the study locations is also
highly characterized by seasonality and differs in social structures. Gender plays an
important role in the marketing of NTFPs. The NTFPs trade is dominated by women.
However, the sale of some wild food products grass-cutters and other plant products
(rattans, bamboo, hides and skins) and other wild animal products are dominated by men.
The key actors in the NTFPs market consist of various levels of local collectors, village
traders, road-head traders and large traders in the districts.
The results indicate that there is a strong market for NTFPs, especially in urban centres, and
there are no signs of any decline. Most NTFPs traders rely on district and urban markets
while others bypass markets altogether and sell their products directly to local restaurants
and consumers in the district capitals. In most cases, the prosperity of a market depends on
good access and the proximity of passing traffic. Most NTFPs traders, especially women,
besiege approaching vehicles at the checking points along high ways to sell their products.
The commonly exploited and traded NTFPs in the study locations are presented in Table 2.
Foods Medicine Household goods
Bush meat Barks Baskets
Fruits Leaves Mats
Honey Fruits Wooden trays
Mushrooms Animal products Grinders
Snails Prepared tonics Mortars
Spices Hides Pestles
cola nuts Seed Spoons
Gums Roots Chewing sticks
Essential oils Essential oils Dyes
Field Survey, 2010
Table 2. Commonly Traded NTFPs in Ghana
Although NTFPs trade is done in both local and urban markets, they have different
characteristics and therefore the real benefits of the trade at the local level are unknown. The
study shows that NTFPs marketing in the study area often occurs in an informal way,
resulting in uncertainty about prices and income effect. Marketing is basically done
individually; it is unorganized, dispersed and producers lack the necessary marketing skills
and information required for optimal performance. As noted by Ndoye (1998), the process
of price setting for NTFPs between the NTFPs farmer (the seller) and the trader (the buyer)
involves bargaining to reach an equilibrium price somewhere between the lowest price the
seller is willing to accept and the highest price the buyer is willing to pay. The bargaining
power of the sellers and buyers is influenced by different factors depending on whether the