Vibration Analysis and Control New Trends and Developments Part 12 potx
Bạn đang xem bản rút gọn của tài liệu. Xem và tải ngay bản đầy đủ của tài liệu tại đây (3.11 MB, 25 trang )
Bearings Fault Detection Using Inference Tools
265
associated with each of the four parts of the bearing. Vibration frequency components
related to each of the four basic fault frequencies; (1) Fundamental train frequency, (2) Ball-
spin frequency, (3) Ball pass outer race and (4) Ball pass inner race, can be calculated using
the following expressions (Bellini et al., 2008):
=
1−
(1)
=
1−
∅
(2)
=
1−
∅ (3)
=
1+
∅ (4)
with:
n: Number of bearing balls
fr: Rotor speed
Bd: Ball diameter
Pd: Bearing Pitch diameter
β
: Contact angle of the ball on the race
Fig. 2. Main bearing design parameters, B
d
: ball diameter, P
d
: pitch diameter,
β
: contact angle.
Regarding the roughness bearings defects, there is a wide variety of causes from
contamination of the lubricant to the shaft currents or misalignment. The generalized
roughness faults produce unpredictable broadband effects in the machines vibration
spectrum, but it seems to be feasible the detection by means of the temporal vibration signal
Root Mean Square (RMS) analysis. As some works and standards (Riley et al., 1999; Cabanas
et al., 1996) set out, a RMS vibration value evaluation of the motor also provides a good
indicator for motor health, allowing machine overall fault diagnosis.
2.2 Stator currents
A Motor Current Signature Analysis (MCSA) represents by the stator currents acquisition an
interesting alternative method with its own particularities and benefits (Cusido et al., 2007a);
the most interesting of them is to avoid accessing inside the motor making it easy to perform
Vibration Analysis and Control – New Trends and Developments
266
its online fault analysis (Cusido et al. 2007b). It has been demonstrated (Schoen et al., 1995) that
the characteristic bearing fault frequencies in vibration can be reflected on stator currents. As a
result of motor airgap length variations due to bearings defect, flux density is influenced and
then an additional magnetic flux appears. This magnetic flux, and its variations associated to
rotor turning, creates additional components that can be found in the stator currents spectra
(Cusido et al., 2005). Using this method it has been widely demonstrated in the literature (El
Hachemi Benbouzid, 2000) that different faults like eccentricity, rotor asymmetry, stator
winding failures, broken bars and bearings damage can be diagnosed. The relationship
between the vibration frequencies and the current frequencies for bearing faults can be
described by equation (5). Therefore, by means of (5), it is possible to analyze the specific fault
harmonics in order to find abnormalities in their amplitude values.
=
|
±∗
|
(5)
with:
f
bg
: Electrical fault characteristic frequency
m: Integer
f
e
: Electrical supply frequency
f
v
: Vibration fault characteristic frequency {(1), (2), (3) or (4)}
It is well established that for bearing single-point defects, the characteristic stator current
fault frequencies are good fault indicators. Even so, it was discovered in several studies, that
for many in situ generated bearing faults, those characteristics fault frequencies are not
observable and may not exist at all in stator current (Stack et al., 2004.). But it is
demonstrated also that these same bearings faults have an effect over the motor eccentricity
(Basak et al., 2006), and these characteristics stator current faults frequencies are easily
detectable as sidebands over the fundamental motor current frequency. Therefore, the
evaluation of the bearings characteristics stator current faults frequencies is useful for
diagnosis proposes, because it can diagnose directly the bearing fault. But as a second
diagnosis step, the analysis of stator current fundamental sidebands, in order to detect
eccentricity, can be useful also for bearing diagnosis. However, it is necessary other fault
indicators in order to classify correctly between eccentricity fault caused by bearing fault or
eccentricity fault caused by other faults in the motor.
Regarding generalized bearing defects, previous works have shown the existing correlation
between vibration and currents RMS values (Riley et al., 1999). Although it is a complex
function that relates both magnitudes, this work tries to check the RMS currents reliability in
order to perform the motor status diagnose.
2.3 High frequency common-mode pulses
One of the biggest culprits for bearings failure are common-mode circulating currents (CMC).
The CMC are generated due to the inverter used to manage motors, because the inverter
creates common mode voltage as figure 3 shows. Each high dv/dt over the inverter
modulation implies a proportional current, which is propagated over the motor trough
different paths to the ground in order to turn back to the inverter (Muetze and Binder, 2007a).
The CMC travels around the motor (and load if it is not electrically isolated), due to the
capacitive effect that two conductive materials separated by means of some isolating
material (dielectric) can create. For instance, the capacitive effect produced between the coil
group and the chassis separated with air gaps in an induction motor.
Bearings Fault Detection Using Inference Tools
267
Fig. 3. Common mode voltage generated with PWM modulation.
The capacitances created inside the motor have a very low value, so the motor intrinsically
gets filter the low frequency currents, but the high frequency currents see low impedance
paths (Binder and Muetze, 2008.). Some current travel over the shaft, that in an electrical
sense, find the bearing rail, lubricant and bearing ball capacitive coupling. The high
frequency CMC pulses current that contain an important amplitude value, provoke a
discharge over the capacitive coupling. This phenomenon is called EDM (Electric Discharge
Machining) (Kar and Mohanty, 2008). The CMC influences on the bearings degradation due
to the effect that every CMC discharge provoke over the lubricant that recover the bearing,
because the continually application of these discharges implies lubricant degradation. This
effect increases the contact between the bearings with the rail accelerating the final bearings
degradation.
As it is shown in figure 4a, circulating currents could follow different paths to the ground
through the stator windings or rotor. One important path of the circulating currents is
through the bearings (Muetze and Binder, 2007b). The electrical scheme of parasitic
capacitive couplings is shown also in figure 4b. This scheme represents the CMC path from
inverter to bearings. As it has been explained previously, the inverter generates common
mode voltage (V
mc
) and at the same time, generates common mode current (I
mc
) which is
propagated trough the wire (L
C
), motor (L
m
) and through the coupling effect between the
motor and chassis, and between the motor and rotor, this last ones cross finally the coupling
effect between the shaft and the bearings.
A temporal CMC acquisition and a single common-mode discharge are shown in figure 5.
These currents typically show a frequency range of mega-hertz with a period of micro-
seconds between bursts. CMC discharges provoke bearings lubricant degradation. This
effect provokes the contact between the bearings with the rail. Therefore, CMC discharges
amplitude is directly depending of the parasitic capacitances which are depending of the
lubricant state and the distance between bearings and rail mainly. Therefore, seems to be
possible the bearings diagnosis by means of the number of CMC pulses that surpassed a
prefixed amplitude threshold during a fixed time, in order to distinguish between fault and
healthy bearings (Delgado et al., 2009). Analyzing the number of CMC pulses that surpassed
a current amplitude threshold value, it is possible to see that a minor number of CMC pulses
surpassing the threshold, is significant of a degradation state of the bearings, because the
capacitive effect rail-lubricant-bearing needs a minor “energy” differential to allow an EDM.
Vibration Analysis and Control – New Trends and Developments
268
a)
b)
Fig. 4. a) Main CMC paths over inverter-motor-load system. b) Electrical Scheme for
capacitive and parasitic couplings.
Therefore, the methodology consists in a first time acquisition over the stator CMC in a test
bench with healthy bearings. The amplitude of the CMC pulses decrease at the same time
that bearings degradation increase, so is necessary to specify a CMC pulses amplitude
threshold and count the number of pulses that surpasses this threshold during a fixed time.
Obviously, the time acquisition and the threshold value make depends the number of CMC
pulses counted. An acquisition time of tens of milliseconds, and a threshold over the 75% of
the maximum CMC pulses amplitude over healthy bearing, is enough to distinguish
between healthy and degraded bearings.
In this work, to limit the CMC acquired signal to only pulses flowing through bearings (the
responsible of balls degradation), a motor modification was introduced. All the ball bearing
under test were isolated from the motor stator frame but in a point connected to ground
through a cable where the pulses were measured. Bearings insulation was achieved by
surrounding the piece with a polytetrafluoroethylene (PTFE) flat ring with a hole
mechanized in it to let the cable pass through.
2.4 Acoustic Emissions
The Acoustic Emission Technique is a very promising tool that has practical application in
several fields, and specifically, recent important relevance in condition monitoring of
Bearings Fault Detection Using Inference Tools
269
machines. Acoustic Emission is defined as a radiation of mechanical elastic waves produced
by the dynamic local rearrangement of the material internal structure. This phenomenon is
associated with cracking, leaking and other physical processes and was described for the
first time by Josef Kaiser in 1950. He described the fact that no relevant acoustic emission
was detected until the pressure applied over the material under test surpassed the
previously highest level applied.
a)
b)
Fig. 5. Examples of common-mode current discharges, a) individual discharge, b) a set of
discharges.
Acoustic Emissions Technique is classified as a passive technique because the object under
test generates the sound and the Acoustic Emission sensor captures it. By contrast, Active
methods rely on signal injection into the system and analysis of variations of the injected
signal due to system interaction. Then an acoustic emission sensor captures the transient
elastic waves produced by cracking or interaction between two surfaces in relative motion
and converts their mechanical displacement into an electrical signal. This waves travel
through the material in longitudinal, transverse (shear) or surface (Rayleigh) waves, but the
majority of sensors are calibrated to receive longitudinal waves. Wherever the crack is
Vibration Analysis and Control – New Trends and Developments
270
placed, the signal generated travels from the point of fracture to the surface of the material.
The transmission pattern will be affected by the type of material crossed and then isotropic
material will lead to spherical wave front types of propagation only affected by material
surfaces or changes, where the Snell law rules their reflection and reflexion. On Figures 6
and 7 is shown the evolution of acoustic waves inside a Material. On figure 6 it is shown
how reflections on waves due to the defect appear.
Fig. 6. Acoustic Emission Wave Propagation
Fig. 7. Acoustic Emission Wave Propagation in fractured Material
The biggest advantage of this method is probably that it is capable of detecting the earliest
cracks of the system and their posterior growth, making possible fault detection before any
other current method. The main drawback is that it requires additional transducers and a
well controlled environment.
3. Experimental results
Next, the experimental test bench and acquisition system, as well as the results obtained by
each of the presented fault indicators are shown, finally, two inference methods are
presented to merge the obtained information.
Bearings Fault Detection Using Inference Tools
271
3.1 Experimental setup
The test rig used during this research work consists of four ABB M2AA 1.1kW induction
motors, three of them with the drive-end ball bearings under test (with different bearing
fault degradation level), and the other one used to regulate the applied load. Both driving
and loading motors were controlled using independent inverters. Motors under test have
also a cable attached to the drive-end bearings housing with the other side connected to
ground (a hole was mechanized in order to pass the cable through the motor shield),
allowing a low resistance path for CMC acquisition proposes.
The three motors under test have SKF 6205 bearings with normal clearance and nine balls
with diameter of 7.9 mm and pitch of 38.5 mm, and a contact angle of 0.66 radians. The
bearings set under test (labeled healthy, lightly and heavily damaged), is composed by a
healthy one (with very similar vibration levels to other new units tested in previous works)
and other two units with different levels of damage due their operation hours, qualitatively
evaluated with a shock pulse tester from SPM Instruments.
Fig. 8. Experimental test bench and acquisition system scheme.
Regarding the acquisition system, it is based on four different sensors connected to a main
acquisition device. A triaxial shear design MMF branded piezoelectric accelerometer model
KS943B.100 with IEPE (Integrated Electronics Piezo Electric) standard output and linear
frequency response from 0.5 Hz to 22 kHz, was attached using stud mounting to the drive-
end motor end-shield and its data was collected at 20kS/s during 1 second for each
measurement. Phase stator currents were acquired using Hall effect Tektronix A622 probes
with a frequency range from DC to 100 kHz and collected at 20 kHz during 1 second for
each measurement. High frequency CMC signal was measured at the cable attached to the
bearings housing with a Tektronix TCPA300 amplifier and TCP303 current probe, which
Vibration Analysis and Control – New Trends and Developments
272
provides up to 15 MHz of frequency range, and acquired at 50 MHz during 100 ms for each
measurement. Acoustic emissions were acquired with the use of a Vallen-Systeme GmbH VS-
150M sensor unit with a range from 100 kHz to 450 kHz and resonant at 150 kHz. A Vallen-
Systeme GmbH AEP4 40dB preamplifier was used before data acquisition at a sampling
frequency of 25MS/s during 20ms each measurement. All the described sensors are
connected to a PXI acquisition system from National Instruments formed by different specific
boards.
3.2 Experimental results
3.2.1 Vibrations
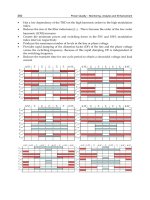
The vibration signal RMS contributes clearly to bearings diagnosis. Figures 9, 10 and 11
show the evolution of the RMS value of each motor vibration signals for different speeds
and load patterns tested. Clearly, the healthy motor, in figure 9, shows lower RMS values of
vibration in comparison with the other two units. Figure 11, corresponding to the unit which
was in the worst operational condition according to the SPM measurements performed,
provide also the highest levels of RMS vibration values.
Fig. 9. RMS vibration for healthy unit, all speeds in rpm and loads in percentage of the
nominal one.
Fig. 10. RMS vibration for lightly damaged unit, all speeds in rpm and loads in percentage
of the nominal one.
Bearings Fault Detection Using Inference Tools
273
Fig. 11. RMS vibration for heavily damaged unit, all speeds in rpm and loads in percentage
of the nominal one.
3.2.2 Stator currents
The figure 12a shows an example of stator-phase current in frequency domain over healthy
test bench condition. The stator phase current characteristics bearing fault frequencies are
related with the bearing construction parameters and the equations from (1) to (4) for m = 1
and 2 that are normally used (Obaid etal., 2003). These fault frequencies are not present
along the frequency axis. The fault indicators thresholds for the stator phase current
a)
b)
Fig. 12. Stator current frequency spectrum, from 0 to 500Hz, a) healthy bearings b) fault
bearing
Vibration Analysis and Control – New Trends and Developments
274
characteristic bearing fault frequencies can be fixed at 5% of the fundamental frequency
amplitude, which is a demanding threshold for diagnosis proposes (Schoen et al., 1995). If
the amplitude of these characteristic fault frequencies surpass the thresholds, imply that it
can be diagnosed clearly the localized bearing fault related, but if this threshold is not
surpassed for any characteristic frequency, it cannot be deduced that bearings are healthy
(Zhou et al., 2009), maybe a generalized bearing defect or a non detectable single defect is
occurring, then, the sidebands of the stator current fundamental harmonic will be analyzed
as general eccentricity fault indicator (Bellini et al., 2008). The stator phase current spectra of
a degraded bearings shows, at figure 10b, sidebands fault frequencies greater than 5% of
fundamental amplitude, but there are not the characteristic bearing fault frequencies. This
effect can be due to eccentricity between rotor and stator for different reasons, so it is
necessary additional features in order to distinguish between eccentricity due to bearings
degradation or due to other fault in the motor.
Regarding the other stator current feature presented, in order to avoid the influence of the
main harmonic power value in the stator current RMS measurement, the acquired signals
have been previously filtered using a band-rejection 5th order Butterworth filter centred in
the power supply main harmonic with a bandwidth of 20 Hz between higher and lower cut-
off frequencies. Tables 1 and 2 compare the RMS filtered values of the heavily and lightly
damaged units with the healthy one.
Heavily Damaged-Healthy ([A] RMS)
Speed [rpm]
Load
[% of nominal torque]
300 750 1050 1500
0 0,004 -0,006 -0,008 -0,007
50 0,036 0,03 0,073 0,044
100 0,018 0,026 0,024 0,024
Table 1. Difference in RMS filtered current value between heavily damaged unit and healthy
one used as reference.
Lightly Damaged-Healthy ([A] RMS)
Speed [rpm]
Load
[% of nominal torque]
300 750 1050 1500
0 0,008 0,002 -0,003 -0,003
50 0,002 -0,011 -0,002 -0,005
100 0,02 0,012 0,003 0,014
Table 2. Difference in RMS filtered current value between lightly damaged unit and healthy
one used as reference.
A significant difference can be clearly appreciated when the motor is heavily damaged
under load condition. Light damage is noticeable under nominal load conditions but its
detection does not seem to be easily reliable.
Bearings Fault Detection Using Inference Tools
275
3.2.3 High frequency bearings pulses
Bearings pulses threshold analysis has been executed to validate theories of correlation
between bearings state (wear, lubrication, distributed defects, etc.) and pulses discharge
over a threshold value. As it can be seen in figure 13 the stator CMC temporal analysis
shows a decrement in the number of pulses surpassing a predefined threshold. The
threshold value is fixed at 75% of the CMC pulse maximal amplitude in healthy cases. A
number of counted pulses less than 75% of counted pulses in healthy bearings, will be the
fault indicator threshold used to distinguish between healthy and degraded bearings.
a)
b)
Fig. 13. Example of common mode current signal acquisition, a) healthy bearings b) fault
bearing.
Vibration Analysis and Control – New Trends and Developments
276
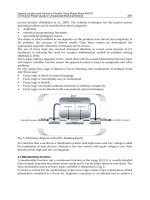
The results summarized in figure 14, show that over a defined threshold level healthy
bearings undergo a bigger number in comparison to the damaged units. It is noticeable also
that this method is able to detect failure at its initial stage if the threshold is correctly placed.
Fig. 14. Number of bearing pulses over threshold value for all motors under test. Healthy,
lightly damaged and heavily damaged.
3.2.4 Acoustic Emission testing
Acoustic Emission acquired data has been statistically classified by means of value binning
tools and histogram presentation. Fifteen sets of data were acquired for each motor and
averaged. Figure 15 shows the results comparing the RMS voltage values acquired for the
different units under test.
Fig. 15. Acoustic Emission voltage values classification
It is advisable that pulses over 8 V only appeared during the damaged motor testing while
under 7 V that unit does not show more activity than the healthy and lightly damaged units.
Then, the fuzzy inference system designed uses as reference the number of pulses that
surpass the 7 V value, which is the zone where the distinction of the fault severity of the unit
seemed to be more noticeable.
Bearings Fault Detection Using Inference Tools
277
3.3 Inference tools
3.3.1 Look-up tables
A look-up table is a common tool applied in diagnosis field. It contents basically a set of
simple association rules applied over obtained data. The operation consists in analyze a
given combination of inputs in order to select one of the outputs. In the diagnosis field, this
kind of inference tool is as a set of if then rules collected in a table.
A proposed look-up table is shown in table 3, where a set of features, from the previously
explained have been selected to generate an improved bearings diagnosis system.
FTF harmonic
amplitude
BSF
harmonic
amplitude
BPFO
harmonic
amplitude
BPFI
harmonic
amplitude
Fundamental
sidebands
amplitude
Number
of pulses
over the
threshold
Diagnosis
>5% of
fundamental
Not
necessary
Not
necessary
Not necessary
Not
necessary
< 75%
Bearing cage
fault
(Localized
defect)
Not necessary
>5% of
fundamental
Not
necessary
Not necessary
Not
necessary
< 75%
Bearing ball
fault
(Localized
defect)
Not necessary
Not
necessary
>5% of
fundamental
Not necessary
Not
necessary
< 75%
Bearing
outer race
fault
(Localized
defect)
Not necessary
Not
necessary
Not
necessary
>5% of
fundamental
Not
necessary
< 75%
Bearing
inner race
fault
(Localized
defect)
<5% of
fundamental
<5% of
fundamental
<5% of
fundamental
<5% of
fundamental
>5% of
fundamental
< 75%
Bearing
degradation
(Distributed
or non-
detectable
localized
defect)
<5% of
fundamental
<5% of
fundamental
<5% of
fundamental
<5% of
fundamental
>5% of
fundamental
< 75%
Eccentricity,
but not for
bearing
degradation
Table 3. Look-up table considering single-point stator current characteristic harmonics,
stator current fundamental frequency sidebands evaluation, and number of common mode
pulses.
3.3.2 Fuzzy logic
Fuzzy logic is a useful tool in order to implement reasoning that is ambiguous or imprecise.
In condition monitoring field, the implementation of tolerant and flexible rules is a more
realistic way to generate a diagnosis than the use of crisp and categorical relations.
Vibration Analysis and Control – New Trends and Developments
278
The analysis of the actual bearing status has been performed using a fuzzy logic inference
implementation (Lou et al., 2004; Ballal et al., 2007), which maps given inputs (in this case
current and vibration RMS values) to a single output, the different signals acquired are
linked to a damage value scaled from 1 to 3.
Fig. 16. Membership function plot for Current RMS. (motor speed: 1500 rpm, motor load: 0%).
Fig. 17. Plotted surface showing the relationship between the system inputs Vibrations RMS
value (g) and Stator Currents RMS value (A) versus the Failure Level output. (Motor speed:
1500 rpm, motor load: 0%)
Unit Matches Success %
Healthy 15 100 %
Lightly Damaged 14 93,33%
Heavy Damage 13 86,66%
Table 4. System testing results.
The membership functions, like figure 16, have been obtained through training and
validation process, for each signal under analysis using real motor data. MATLAB
“Adaptive neuro-fuzzy inference system” tool has been used for this purpose. Figure 17
Bearings Fault Detection Using Inference Tools
279
shows the obtained relationship between Vibration and Stator Current RMS values against
the Failure Level output for a motor speed of 1500 rpm and a load of 0%.
To perform the evaluation of the monitoring system designed, fifteen sets of data were
collected from the same units and processed. Table 4 summarizes the obtained results.
All healthy data sets were correctly identified, whilst one of the lightly damaged was
recognised as a heavily damaged set and two of the heavily damaged sets were identified as
lightly damaged ones. The percentage of success was reasonably high and its improvement
is still possible if more data sets are used during the system training stage.
4. Conclusions
This chapter tries to offer another point of view in the generation of diagnosis systems and
the use of vibration signal analysis for machine condition monitoring. It has been presented
an overview of multisensory inference approaches used to characterize motor ball bearings,
and their application to a set of motors with distributed fault failure. The results show that a
multivariable design contributes positively to damage monitoring of bearings, being a more
solid solution than just using any of the single signals involved, which can be affected not
only by external disturbances, but also by its own diagnosis limitations, especially dealing
with damage severity evaluation. The selection and fusion of different fault indicators from
different physical magnitudes has been solved by two examples: the application of simple
look-up tables, and the development of a fuzzy system. In both proposed solutions, the
bearings diagnosis reaches an important detection capability, including the possibility to
detect different kinds of bearings faults and/or different levels of fault.
5. References
Ballal S., Khan Z. J., Suryawanshi H. M. & Sonolikar R. L., (2007). Adaptive Neural Fuzzy
Inference System for the Detection of Inter-Turn Insulation and Bearing Wear Faults in
Induction Motor, IEEE Transactions on Industrial Electronics, vol. 54, no. 1, pp. 250-258.
Basak D., Tiwari A. & Das S. P., (2006). Fault diagnosis and condition monitoring od
electrical machines – a review, IEEE International Conference on Industrial Technology,
pp. 3061-3066.
Bellini A., Filippetti F., Tassoni C. & Capolino G A., (2008). Advances in Diagnostic
Techniques for Induction Machines," IEEE Transactions on Industrial Electronics, vol.
55, no. 12, pp. 4109-4126.
Binder A. & Muetze A., (2008). Scaling Effects of Inverter-Induced Bearing Currents in AC
Machines, IEEE Transactions on Industrial Applications, vol. 40, no. 3, pp. 769-776.
Cabanas M. F., Melero M. G., Orcajo G. A., Cano Rodríguez J. M. & Juan Solares Sariego,
(1996). Técnicas para el Mantenimiento y diagnóstico de Máquinas Eléctricas
Rotativas, Marcombo, ISBN: 8426711669.
Cusido J., Delgado M., Navarro L., Sala V.M. & Romeral L., (2010). EMA fault detection
using fuzzy inference tools, IEEE AUTOTESTCON, pp.1-6.
Cusido J., Garcia A., Navarro L. M., Delgado M., Romeral L. & Ortega A., (2009). On-line
measurement device to detect bearing faults on electric motors, IEEE
Instrumentation and Measurement Technology Conference, pp.749-752.
Cusido J., Romeral L., Delgado M., Garcia A., & Ortega J. A., (2007a). Induction machines
fault simulation based on FEM modelling, IEEE European Conference on Power
Electronics and Applications, pp.1-8.
Vibration Analysis and Control – New Trends and Developments
280
Cusido J., Rosero J., Aldabas E., Ortega J.A. & Romeral L., (2005). Fault detection techniques
for induction motors, IEEE Compatibility in Power Electronics, pp. 85- 90.
Cusido L. R., Garcia A., Rosero J. A. & Ortega J. A., (2007b). Fault detection in induction
machines by using continuous and discrete wavelet decomposition, IEEE European
Conference on Power Electronics and Applications, pp.1-8.
Delgado M., Garcia A., Ortega J. A., Urresty J. & Riba J. R., (2009). Bearing diagnosis
methodologies by means of Common Mode Current, European Conference on Power
Electronics and Applications, pp.1-10, 8-10.
El Hachemi Benbouzid M., (2000). A review of induction motors signature analysis as a
medium for faults detection, IEEE Transactions on Industrial Electronics, vol. 47, no.
5, pp. 984-993.
Frosini L., Bassi E., Fazzi A. & Gazzaniga C., (2008). Use of the stator current for condition
monitoring of bearings in induction motors, Electrical Machines, International
Conference on, pp. 1-6.
Kar C. and Mohanty A. R., (2008). Vibration and current transient monitoring for gearbox
fault detection using multiresolution Fourier transform, Elsevier Journal of Sound and
Vibration, vol. 311, no. 1-2, pp. 109- 132.
Lou X., Kenneth K. A. & Loparo A., (2004). Bearing fault diagnosis based on wavelet
transform and fuzzy inference, Mechanical Systems and Signal Processing, vol. 18, no.
5, pp. 1077-1095.
Muetze A. & Binder A., (2007). Calculation of Motor Capacitances for Prediction of the
Voltage Across the Bearings in Machines of Inverter-Based Drive Systems, IEEE
Transactions on Industry Applications, vol. 43, no. 3, pp. 665-672.
Muetze A. & Binder A., (2007). Calculation of Circulating Bearing Currents in Machines of
Inverter-Based Drive Systems, IEEE Transactions on Industrial Electronics, vol. 54, no.
2, pp. 932-938.
O’Donell P., (1986). Report of large motor reliability survey of industrial and commercial
installations, IEEE Transactions on Industrial Applications, vol. IA-21, no. 4.
Obaid R. R., Habetler T. G. & Stack J. R., (2003). Stator current analysis for bearing damage
detection in induction motors, Symposium on Diagnostics for Electric Machines, Power
Electronics and Drives, pp. 182-187.
Obaid, R. R, Habetler, T. G. & Stack, J. R. (2003). Stator current analysis for bearing damage
detection in induction motors, IEEE Proceeding on Power Electronics and Drives,
Symposium on Diagnostics for Electric Machines, pp. 182-187.
Riley C. M., Lin B. K., Habetler T. G. & Kliman G. B., (1999). Stator current harmonics and their
causal vibrations: a preliminary investigation of sensorless vibration monitoring
applications, IEEE Transactions on Industry Applications, vol. 35, no. 1, pp. 94-99.
Schoen R. R., Habetler T. G., Kamran F. & Bartfield R. G., (1995). Motor bearing damage
detection using stator current monitoring, IEEE Transactions on Industry
Applications, vol. 31, no. 6, pp. 1274-1279.
Singh G. K. & Saad Ahmed Saleh Al Kazzaz, (2003). Induction machine drive condition
monitoring and diagnostic research-a survey, Electric Power Systems Research, vol.
64, no. 2, pp. 145-158.
Stack J. R., Habetler T. G. & Harley R. G., (2004). Fault Classification and Fault Signature
Production for Rolling Element Bearings in Electric Machines, Symposium on
Diagnostics for Electric Machines, Power Electronics and Drives, vol. 40, no. 3, pp. 735-739.
Zhou W., Lu B., Habetler T. G. & Harley R. G., (2009). Incipient Bearing Fault Detection via
Motor Stator Current Noise Cancellation Using Wiener Filter, IEEE Transactions on
Industry Applications, vol. 45, no. 4, pp.1309-1317.
14
Vibration Analysis of an Oil Production Platform
Submitted to Dynamic Actions Induced by
Mechanical Equipment
José Guilherme Santos da Silva, Ana Cristina Castro Fontenla Sieira,
Luciano Rodrigues Ornelas de Lima and Bruno Dias Rimola
State University of Rio de Janeiro (UERJ)
Brazil
1. Introduction
Structural engineers have long been trying to develop solutions using the full potential of its
composite materials. At this point there is no doubt that the structural solution progress is
directly related to an increase in materials science knowledge.
On the other hand, the competitive trends of the world market have long been forcing
structural engineers to develop minimum weight and labour cost solutions. A direct
consequence of this new trend design is a considerable increase in problems related to
unwanted floor vibrations. For this reason, the structural floors systems can become
vulnerable to excessive vibrations, for example, produced by impacts such as mechanical
equipment (rotating machinery) (Rimola, 2010; Rimola, 2010a; Rimola, 2010b).
This way, the present paper investigated the dynamic behaviour of an oil production
platform made of steel and located in Santos basin, São Paulo, Brazil. The structural model
consists of two steel decks with a total area of 1915 m
2
(upper deck: 445 m
2
and lower deck:
1470 m
2
), supported by vertical sections made of tubular steel members (steel jacket), and
piled into the seabed. A variety of mechanical equipment was located on the steel decks of
the structural model, related to electrical generators and compressors (Rimola, 2010).
The soil representation was based on the Winkler’s Theory (Winkler, 1867). This theory
simulates the soil behaviour as a group of independent springs, governed by the linear-
elastic model. In the Winkler’s model, the soil stiffness was considered as the necessary
pressure to produce a unitary displacement (Winkler, 1867).
The proposed computational model, developed for the oil production platform dynamic
analysis, adopted the usual mesh refinement techniques present in finite element method
simulations implemented in the GTSTRUDL program (GTSTRUDL, 2009). In this finite
element model, floor steel girders and columns were represented by three-dimensional
beam elements, where flexural and torsion effects were considered. The steel decks were
represented by shell finite elements. In this investigation, it was considered that both
structural elements (steel beams and steel deck plates) have total interaction with an elastic
behaviour.
The structural model dynamic response was determined through an analysis of its natural
frequencies and peak accelerations. The results of the dynamic analysis were obtained from
Vibration Analysis and Control – New Trends and Developments
282
an extensive numerical study, based on the finite element method using the GTSTRUDL
program (GTSTRUDL, 2009). In this investigation, dynamic loadings coming from the
rotating machinery (electrical generators and compressors) were applied on the steel decks
of the structural system (production platform).
A numerical analysis was performed, in order to obtain the dynamic impacts on the deck
structure coming from the electrical generators and compressors. Based on the peak
acceleration values, obtained on the structure steady-state response, it was possible to
evaluate the structural model performance in terms of human comfort, maximum tolerances
of the mechanical equipment and vibration serviceability limit states of the structural
system, based on the design code recommendations (CEB 209/91, 1991; ISO 1940-1, 2003;
ISO 2631-1, 1997; ISO 2631-2, 1989; Murray et al., 2003).
2. Vibration analysis of steel floors
Besides the evaluation of the structural systems behaviour when submitted to dynamic
loads, the causes and effects of vibration on people have been subject of many studies and
experiments, due to the fact that they affect people in different ways, causing discomfort,
health problems, reduced ability concentration and efficiency at work or sickness, in the case
of vibrations of very low frequencies.
(Reiher & Meister, 1946) developed a scale used to determine levels of acceptable vibration
in floors. This scale was developed based on experiments in which a group of people was
submitted to vibration, whose frequency varied from 1 Hz to 100 Hz. According to this
scale, the vibration levels can be classified into several levels, depending on the amplitude
and frequency.
(Srinivasulu & Vaidyanathan, 1976) presented the principles of analysis, design and
construction of machines of different types. The authors investigated several factors to be
considered during the design of machine foundations, in order to obtain the best solution,
leading to better operation and reduce the undesirable effects of vibrations on the structure.
(Bachmann & Ammann, 1987) have studied the necessary procedures for the analysis of
structures under dynamic loads coming from machines, including machines with rotating
parts. The authors treat from the load formulation, also dealing with the effects of
machinery induced vibrations in structures and measures to avoid such a problem. In their
work are also included the acceptance criteria, both from the point of view of the structure
and the point of view of human comfort.
(Griffin, 1996) indicates some reasons to measure human exposure to vibration, especially
the following: development of standardized documentation on vibrations in the human
body; determination of vibration levels and reduction in frequency range that can prejudice
the human body and providing data that may be used for comparison between two or more
occupational environments.
(Lenzen, 1996) observed during the development of his research, that the scale developed by
(Reiher & Meister, 1946) did not take into account the influence of damping on the human
perception of vibration. Through his studies in the laboratory, it was modified the scale of
(Reiher & Meister, 1946). This modified scale showed satisfactory results in floors with
damping ratios of up to 5%.
According to (Vasconcelos, 1998), establishing the concept of human vibration discomfort
can be a difficult task. There are several factors that can influence the subjective feeling of
discomfort, such as the socio-cultural people, the type of activity performed, the person’s
Vibration Analysis of an Oil Production
Platform Submitted to Dynamic Actions Induced by Mechanical Equipment
283
psychological state at the time of the event, environmental factors, noise, etc. It is not easy to
simulate these conditions in the laboratory to reduce the variability of individual responses.
Thus, the limit of comfort of people subjected to vibration can be regarded as a rather
subjective measure, generating some controversy as to the acceptable values of accelerations
imposed.
(Zhou & Shi, 2001) considered that the elimination of vibration of rotating machinery is an
important engineering problem. In their study, they presented a detailed review of the
developed research that deals with the active balancing of rotors in real time and active
control of vibration of rotating machinery, as well as dynamic modelling and analysis
techniques for rotating systems. The authors report that the major problem found by the
scheme of active control of vibration is the limited number of actuators to control an
unlimited number of vibration modes.
(Pereira, 2005) presents a study on the vibration related to human comfort and perception,
focusing on the suitability of buildings for vibration levels, aiming the generation of curves
related to the perception and human comfort and vibration by means of laboratory
experiments and comparing the results to the limits of vibration to other investigations and
the design codes (ISO 2631-2, 1989).
The experimental tests developed by (Pereira, 2005) considered 30 volunteers, 15 men and 15
women exposed to vertical vibration at a frequency band ranging from 12 to 80 Hz in sitting
and standing posture. The author also performed an analysis on the uncertainty of the
outcome of the limit of perception, verifying the existence of a range of vibration in which
individuals are not sure whether or not they are able to detect the vibration. It also aimed to
know the vertical vibration levels that people find uncomfortable at their home environment,
to determine the relationship between the perception threshold and comfort. According to
these results, it was proved that the reduction in amplitude of the movement to higher
frequency vibration becomes more difficult to be detected, reducing the sensitivity of people.
(Milet, 2006) discusses the basic concepts of dynamic analysis of machine foundations,
investigating some analytical strategies and numerical methods available for designing. In
this work, some design recommendations were presented and discussed.
(Souza et al., 2007) developed a prototype that allows, looking through a simple system,
based on an unbalanced rotor, possible structural data caused by the resonance
phenomenon, also allowing comparisons to be made with more complex structural systems.
Furthermore, the experiment presented as being practical and simple, can serve as an
analytical tool in the classroom, thus giving a better understanding of phenomena related to
the vibration system.
(Assunção, 2009) addressed the issues and the most important conditions for a dynamic
analysis of elevated frame structures, where equipment were allocated for industrial
processes. The author developed a study related to the main causes of dynamic actions
coming from industrial equipment and examined a framed structure supporting an
unbalanced machine. Through this investigation, the author demonstrated that the
developed computational model was appropriate to simulate the transmission of efforts and
contribution of the vibrating mass on the responses of the framed structures.
3. Loads generated by mechanical equipment (rotating machinery)
Knowledge about the dynamic behaviour of rotors of rotating machinery, even in the design
phase, has become an increasingly crucial factor, considering that it is not desirable to take
Vibration Analysis and Control – New Trends and Developments
284
corrective actions after the beginning of activities. Material costs and delivery of services are
relatively high when compared with the profits increasingly reduced according to the rules
imposed by the market and the fact that such corrective actions still involve a period in
which the equipment will need to become inoperative, which means losses, because it will
not generate any profit for the period.
According to (Dias Junior, 2009), among several factors that contribute to the transmission of
rotational energy to the vibratory movements of the machine, the well-known is
undoubtedly the unbalance of the rotor. The rotor is the rotating part of a machine or engine
which may be coupled elements as disks, generators, gears, etc. According to (Dias Junior,
2009), due to the unbalance, the force that acts at the rotor gravity centre, pull the shaft out
of the line joining the two bearings, forcing the shaft to rotate stressed. This movement is
called precession movement.
Rotors are supported on bearings, which are the elements responsible for connecting the
movable and fixed structure of a rotating machine. In addition to this point, to absorbing
energy, another function of the bearings is to guide or restrict movement during the rotation
axis (Silva, 2004).
The process of balancing a rotor is a key factor to minimize the vibrations generated by
electric motors. Depending on the vibration level of these engines, the structural system that
supports the equipment can be compromised by fatigue or even premature failure. The
balancing process is intended to improve the distribution of mass of a body, so that by
turning around their bearings, produces no unbalance forces, keeping the vibrations and
dynamic loads within suitable limits for the machine operation.
The balance can be achieved up to a certain limit, since after this process the rotor still
presents imperfection in the mass distribution, called residual unbalance. It is worth
mentioning that there is a direct relationship between the residual unbalance and vibration
level of the machine, which depends on many factors (mass housing and the foundation,
stiffness of the bearings and foundation, occurrence of resonances etc.). Anyway, there are
allowable levels of residual unbalance, consistent with good practice of machine design.
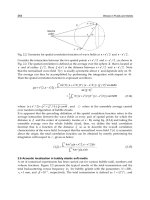
3.1 Excitation forces: Unbalanced mass
Unbalanced mass is defined as a mass located at a distance d measured from the geometric
centre of the shaft. The mass remains in a plane perpendicular to the axis y and it is a
constant coordinate, as illustrated in Figure 1.
Based on Figure 1, it can be deduced that the force caused by unbalanced mass, acting on
the axis, according to directions in the shown coordinate system, can be written as presented
in Equations (1) and (2). In Equations (1) and (2), the dynamic forces generated by
unbalanced mass have a frequency similar to the rotational frequency of the axis
(
)
2
uu
Fm dsint
=
Ω⋅ Ω
(1)
(
)
2
wu
Fmdcost
=
Ω⋅ Ω (2)
3.2 Unbalance quantification
As previously mentioned, the unbalance is characterized by a mass located at a certain
distance from the rotation axis, see Figure 1. Therefore, the unbalance is always measured
by a product mass x distance, see Equation (3). The rotor must be subjected to a balancing
Vibration Analysis of an Oil Production
Platform Submitted to Dynamic Actions Induced by Mechanical Equipment
285
procedure, in order to achieve a tolerable minimum. This value is called the Permissible
Residual Unbalance and designated by the symbol U.
U mass distance
=
× (3)
Fig. 1. Unbalanced mass (López, 2002)
It was observed in Equation (3), that the allowable residual unbalance is directly
proportional to the mass of the rotor, i.e., as heavier was the rotor, greater it will be the
permissible residual unbalance. It is appropriate to relate the allowable residual unbalance,
U, and the rotor mass, m, in terms of the Specific Allowable Residual Unbalance, as shown
in Equation (4).
U
e
m
=
(4)
As larger is the rotation speed, smaller should be the residual unbalance, since the
centrifugal force, F
cent
, increases with the square of the speed of it, as shown in Equation (5).
In Equation (5) the centrifugal force, F
cent
is expressed in N.
2
cent
Fme
=
⋅⋅Ω
(5)
Based on many years of experience, experts decided that the product of the angular velocity
of rotor rotation and the specific allowable residual unbalance must be constant, i.e., to
increase the speed of rotation it is necessary to reduce the specific residual unbalance.
This product is called Balance Quality Grade and it is designated by the letter G, see Table 1.
To find a wide variety of existing rotors it was necessary to assign, depending on the type of
rotor and its application, a value for this constant, see Table 1. Table 1 reproduces the G
values which deals with quality of balancing rotating rigid bodies (ISO 1940-1, 2003).
3.3 Determination of unbalanced forces
As mentioned before, the unbalance of the rotor produces a dynamic load that depends on
the mass, the equipment angular velocity and the eccentricity between the equipment
Vibration Analysis and Control – New Trends and Developments
286
G
e x ω
(mm/s)
Rotor Types - General Examples
G 4000 4000
Crankshaft/drives of rigidly mounted slow marine diesel engines with
uneven number of cylinders.
G 1600 1600 Crankshaft/drives of rigidly mounted large two-cycle engines.
G 630 630
Crankshaft/drives of rigidly mounted large four-cycle engines;
Crankshaft/drives of elastically mounted marine diesel engines.
G 250 250 Crankshaft/drives of rigidly mounted fast four-cylinder diesel engines.
G 100 100
Crankshaft/drives of fast diesel engines with six or more cylinders;
Complete engines (gasoline or diesel) for cars, trucks and locomotives.
G 40 40
Car wheels, wheel rims, wheel sets, drive shafts; Crankshaft/drives of
elastically mounted fast four-cycle engines with six or more cylinders;
Crankshaft/drives of engines of cars, trucks and locomotives.
G 16 16
Drive shafts (propeller shafts, cardan shafts) with special requirements and
parts of crushing machines; Individual components of engines (gasoline or
diesel) for cars, trucks and locomotives; Crankshaft/drives of engines with
six or more cylinders under special requirements.
G 6.3 6.3
Parts of process plant machines; Marine main turbine gears (merchant
service); Centrifuge drums; Paper machinery rolls; print rolls; Fans;
Assembled aircraft gas turbine rotors; Flywheels; Pump impellers;
Machine-tool and general machinery parts; Medium and large electric
armatures (electric motors having at least 80 mm shaft height) without
special requirements; Small electric armatures, often mass produced, in
vibration insensitive applications and/or with vibration-isolating
mountings; Individual components of engines under special requirements.
G 2.5 2.5
Gas and steam turbines, including marine main turbines (merchant
service); Rigid turbo-generator rotors; Computer memory drums and discs;
Turbo-compressors; Machine-tool drives; Medium and large electric
armatures with special requirements; Small electric armatures not
qualifying for one or both of the conditions specified for small electric
armatures of balance quality grade G 6.3; Turbine-driven pumps.
G 1 1
Tape recorder and phonograph (gramophone) drives; Grinding-machine
drives; Small electric armatures with special requirements.
G 0.4 0.1 Spindles, discs and armatures of precision grinders; Gyroscopes.
Table 1. Balance quality values (ISO 1940-1, 2003)
gravity center and the rotation axis. In sequence, Equation (6) determines the dynamic load
amplitude generated by the unbalance of a rotor, as follows:
(
)
2
0
PmR mR
=
⋅⋅Ω= ⋅ Ω⋅Ω (6)
Vibration Analysis of an Oil Production
Platform Submitted to Dynamic Actions Induced by Mechanical Equipment
287
Where:
P
0
: dynamic loading amplitude;
M : total mass in rotation;
Ω : equipment frequency;
R. Ω = G : equipment balance quality grade, see Table 1: (ISO 1940-1, 2003).
For rotors of electric motors, R.Ω was considered equal to 0.0025 m/s. Substituting this
value in Equation (6), it is obtained:
(
)
0
P m 0.0025
=
⋅⋅Ω
(7)
Considering an unbalanced load spinning around an axis, the procedure for obtaining the
global dynamic force acting on a plane is to apply the force in two orthogonal directions.
One of these forces is applied in the horizontal direction with the angle phase φ equal to zero
and the other in vertical direction with the angle phase φ equal to 1/4 of the period of
vibration of unbalanced force.
Thus, as time increases, there is a variation of the two forces so that the composition
(horizontal and vertical directions) results in a harmonic unbalanced force where one
component will be multiplied by sin (Ωt) and the other by sin (Ωt + π/2). This way, when
one harmonic component presents maximum values the other one is equal to zero and vice
versa. The value of the dynamic force is obtained by the vector sum of the components in
the vertical and horizontal directions as presented in Equation (8).
00
P(t) P sin( t) P sin( t )
2
π
=Ω+Ω+
(8)
3.3 Dynamic loading modelling
To perform the numerical analysis of the oil production platform developed in this
investigation, it was used the data in accordance with Table 2. In sequence, Figure 2 shows
the design of the equipment.
Equipment data
Protective cover 1.2 kN
Coupling 5.3 kN
Gear unit 37.5 kN
Motor swing 15 kN
Rotor weight 10.8 kN
Input frequency 30 Hz
Output frequency 0.94 Hz
Table 2. Equipment data
The dynamic load modelling considered two components related to vertical and horizontal
directions. Table 3 shows the dynamic loads applied on the structural system steel deck.
These actions were properly combined in order to better represent the dynamic excitation
induced by equipment on the structure.
Vibration Analysis and Control – New Trends and Developments
288
Fig. 2. Driving unit (motor, coupling and gear) supported by a steel beam (Rimola, 2010)
Equipment Weight (kN) Frequency (rad/s)
Rω (m/s)
P
0
(kN)
Rotor 10.80 188.49 0.0025 0.51
Gear 18.75 6.03 0.0025 0.028
Table 3. Dynamic actions related to the equipment
4. Investigated structural model
The structural system investigated in this paper is related to an oil production platform
made of steel and located in Santos basin, São Paulo, Brazil. The structural model is
supported by vertical sections made of tubular steel members (steel jacket), piled into the
seabed by steel piles and consists of two steel decks with a total area of 1915 m
2
(upper deck:
445 m
2
and lower deck: 1470 m
2
), see Figures 3 and 4.
Fig. 3. Investigated structural model