Vibration Analysis and Control New Trends and Developments Part 14 potx
Bạn đang xem bản rút gọn của tài liệu. Xem và tải ngay bản đầy đủ của tài liệu tại đây (1.25 MB, 25 trang )
6 Vibration Control
2.5 Evaluation of passenger ride comfort according to ISO 2631
Whole-body vibrations are transmitted to the human body of the passengers in a bus, train or
when driving a car. The ISO 2631 standard provides an average, empirically verified objective
quantification of the level of perceived discomfort due to vibrations for human passengers
(ISO, 1997). The accelerations in vertical and horizontal directions are filtered and these
signals’ root mean square (RMS) are combined into a scalar comfort quantity. Fig. 5 shows
the ISO 2631 filter magnitude for vertical accelerations which are considered the only relevant
component in the present study. For the heavy metro car, the highest sensitivity of a human
occurs in the frequency range of f
≈ 4 − 10 Hz. For the scaled laboratory model, all relevant
eigenfrequencies are shifted by a factor of 8 compared to the full-size FEM model. For this
reason, the ISO 2631 comfort filters and the excitation spectra are also shifted by this factor.
Moreover, only unidirectional vertical acceleration signals are utilized as they represent the
main contributions for the considered application.
Frequency in
rad
/s
ISO 2631-filter for rail vehicle ride comfort
shifted filter for laboratory model
Magnitude in dB
25
0
−25
−50
10
0
10
1
10
2
10
3
10
4
Fig. 5. Filter function according to ISO 2631 (yaw axis)
3. Optimal controller design for the metro car body
Two different methods for controller design are investigated in the following: an LQG and a
frequency-weighted
H
2
controller are computed for a reduced-order plant model containing
only the first 6 eigenmodes. The goal of this study is to obtain a deeper understanding on
robustness and controller parameter tuning, since the LQG and the frequency-weighted
H
2
control methods are applied to design real-time state-space controllers for the laboratory setup
in the next chapter.
3.1 LQG controller for a reduced-order system
3.1.1 Theory
The continuous-time linear-quadratic-gaussian (LQG) controller is a combination of an
optimal linear-quadratic state feedback regulator (LQR) and a Kalman-Bucy state observer,
see Skogestad & Postlethwaite (1996). Let a continuous-time linear-dynamic plant subject to
314
Vibration Analysis and Control – New Trends and Developments
MIMO Vibration Control for a Flexible Rail Car Body: Design and Experimental Validation 7
process and measurement noises be given in state space (D = 0 for compactness):
˙x
= Ax + Bu + Ew
y
= Cx + v,(4)
where w and v are assumed to be uncorrelated zero-mean Gaussian stochastic (white-noise)
processes with constant power spectral density matrices W and V.
The LQG control law that minimizes the scalar integral-quadratic cost function
J
= E
lim
T→∞
1
T
T
0
l(x, u)dt
(5)
with
l
(x, u)=x
T
Qx + u
T
Ru (6)
turns out to be of the form
˙
x
= Ax + Bu + H(y − Cx) (7)
u
= −K
LQR
x.(8)
Thereby, E
[
·
]
is the expected value operator, Q = Q
T
0andR = R
T
0 are constant,
positive (semi-)definite weighting matrices (design parameters) which affect the closed-loop
properties, (7) is the Kalman observer equation, and (8) is the LQR state feedback control law
utilizing the state estimate.
The optimal LQR state feedback control law (Skogestad & Postlethwaite, 1996)
u
= −K
LQR
x (9)
minimizes the deterministic cost function
J
=
∞
0
l(x, u)dt (10)
and is obtained by
K
LQR
= R
−1
B
T
X, (11)
where X is the unique positive-semidefinite solution of the algebraic Riccati equation
A
T
X + XA− XBR
−1
B
T
X + Q = 0. (12)
The unknown system states x can be estimated by a general state-space observer (Luenberger,
1964). The estimated states are denoted by x, and the state estimation error ε is defined by
ε :
= x − x. (13)
Choosing the linear relation
˙
x
= Fx + Gu + Hy, (14)
for state estimation, the following error dynamics is obtained:
˙ε
= Fε +(A − HC − F)x +(B − G)u. (15)
315
MIMO Vibration Control for a Flexible Rail Car Body: Design and Experimental Validation
8 Vibration Control
If F = A − HC and G = B hold, and if the real parts of the eigenvalues of F are negative, the
error dynamics is stable, x converges to the plant state vector x, and the observer equation (7)
is obtained.
With the given noise properties, the optimal observer is a Kalman-Bucy estimator that
minimizes E
ε
T
ε
(see Mohinder & Angus (2001); Skogestad & Postlethwaite (1996)). The
observer gain H in (7) is given by
H
= YC
T
V
−1
, (16)
where Y is the solution of the (filter) algebraic Riccati equation
AY
+ YA
T
− YC
T
V
−1
CY + EWE
T
= 0. (17)
Taking into account the separation principle (Skogestad & Postlethwaite, 1996), which states
that the closed-loop system eigenvalues are given by the state-feedback regulator dynamics
A
− BK together with those of the state-estimator dynamics A − HC, one finds the stabilized
regulator-observer transfer function matrix
G
yu
(s)=−K[sI − A + HC + BK]
−1
H . (18)
Remark: The solutions to the algebraic Riccati equations (12) and (17) and thus the LQG
controller exist if the state-space systems
A, B, Q
1
2
and
A, W
1
2
, C
are stabilizable and
detectable (see Skogestad & Postlethwaite (1996)).
3.1.2 LQG controller design and results for strain sensors / non-collocation
The controller designs are based on a reduced-order plant model which considers only the
lowest 6 eigenmodes. The smallest and largest singular values of the system are shown in
Fig. 6 and Fig. 7 (compare Fig. 2 for the complete system). The eigenvalues are marked by
blue circles. The red lines depict the singular values of the order-reduced T
dz,red
(including
the shaping filter (2) for the colored noise of the disturbance signal w).
Since a reduced-order system is considered for the controller design, the separation principle
is not valid any longer for the full closed-loop system. Neither the regulator gain K
LQR
nor
the estimator gain H is allowed to become too large, otherwise spillover phenomena may
occur that potentially destabilize the high-frequency modes. Therefore, the design procedure
is an (iterative) trial-and-error loop as follows: in a first step, the weighting matrices for the
regulator are prescribed and the resulting regulator gain is used for the full-order system
where it is assumed that the state vector can be completely measured. If spillover occurs, the
controller action must be reduced by decreasing the state weighting Q. In a second step, the
design parameters for the Kalman-Bucy-filter are chosen, considering the fact that the process
noise w is no white noise sequence any longer, see (2). Since the process noise covariance is
approximately known as
(84.54 N)
2
for each channel, the weighting for the output noise V is
utilized as a design parameter.
For the optimal regulator the weighting matrices for the states and the input variables are
chosen as
Q
= 9 · 10
8
· I
12×12
, R = I
4×4
, (19)
316
Vibration Analysis and Control – New Trends and Developments
MIMO Vibration Control for a Flexible Rail Car Body: Design and Experimental Validation 9
0
Frequency in
rad
/s
Singular values in dB
min./max. singular values T
wz,red
and T
dz,red
T
wz,red
open loop
T
dz,red
open loop with comfort filter
25
−25
−50
−75
−100
10
0
10
1
10
2
10
3
10
4
Fig. 6. Smallest and largest singular values of the reduced-order open-loop system (6 modes)
Frequency in
rad
/s
min./max. singular values T
wz,red
Singular values in dB
30
30
10
−10
−30
60
100
200
Fig. 7. Smallest and largest singular values of the reduced-order open-loop system (6 modes,
zoomed)
where I
n×n
is the identity matrix (n rows, n columns). The observer weightings are chosen to
be
W
= 84.54
2
· I
4×4
, V =(1.54 · 10
−6
)
2
· I
4×4
. (20)
Table 1 lists the reduction of the ISO-filtered (see Fig. 5) RMS of each performance variable
z
1,ISO
–z
6,ISO
compared to open-loop results. Figures 8–11 contain the maximum/minimum
singular values from the white noise input d (which is related to the colored noise input w
by (3)) to the performance vector z, the time-domain response of two selected performance
317
MIMO Vibration Control for a Flexible Rail Car Body: Design and Experimental Validation
10 Vibration Control
variables z
1
and z
6
, and two pole location plots (overview and zoomed) for the open- and the
closed-loop results.
Performance position index i 123456avg.
RMS reduction z
i,ISO
in % 8.44 11.22 29.64 26.53 30.05 31.80 22.94
Table 1. RMS reduction of the performance vector z by LQG control (strain sensors /
non-collocation), system order 12
open loop
closed loop
max./min. singular values T
dz
Frequency in
rad
/s
Singular values in dB
0
−10
−20
−30
−40
−50
−60
30
100
300
Fig. 8. Reduction of rail car disturbance transfer singular values with non-collocated LQG
control
open loop
closed loop
z
1
z
6
0
0
0.01
0.01
−0.01
−0.01
6
6
6.25
6.25
6.5
6.5
6.75
6.75
7
7
Time in s
Fig. 9. Acceleration signals z
1
and z
6
without/with non-collocated LQG control
318
Vibration Analysis and Control – New Trends and Developments
MIMO Vibration Control for a Flexible Rail Car Body: Design and Experimental Validation 11
open loop
closed loop
Re
Im
0
0
2000
4000
−2000
−4000
−20−40−60−80
Fig. 10. Rail car model open-loop and non-collocated LQG closed-loop pole locations
open loop
closed loop
Re
Im
0
0
200
100
−100
−200
−1−2
−3
−4
Fig. 11. Rail car model open-loop and non-collocated LQG closed-loop pole locations
(zoomed)
3.1.3 Controller design and results for acceleration sensors / collocation
The optimal regulator is designed with the same weighting matrices for the states and the
control variables as for the case strain sensors / non-collocation, see (19). The observer
weightings are chosen to be
W
= 84.54
2
· I
4×4
, V = 0.154
2
· I
4×4
. (21)
Table 2 lists the reduction of the ISO-filtered (see Fig. 5) RMS of each performance variable
z
1,ISO
–z
6,ISO
compared to open-loop results. Figures 12–15 contain the maximum/minimum
singular values from the white noise input d (which is related to the colored noise input w
319
MIMO Vibration Control for a Flexible Rail Car Body: Design and Experimental Validation
12 Vibration Control
by (3)) to the performance vector z, the time-domain response of two selected performance
variables z
1
and z
6
, and two pole location plots (overview and zoomed) for the open- and the
closed-loop results.
Performance position index i 12345 6avg.
RMS reduction z
i,ISO
in % 7.83 8.36 8.04 7.02 8.79 10.23 8.38
Table 2. RMS reduction of the performance vector z by LQG control (acceleration sensors /
collocation), system order 12
open loop
closed loop
max./min. singular values T
dz
Frequency in
rad
/s
Singular values in dB
0
−10
−20
−30
−40
−50
−60
30 100
300
Fig. 12. Reduction of rail car disturbance transfer singular values with collocated LQG
control
open loop
closed loop
z
1
z
6
0
0
0.01
0.01
−0.01
−0.01
6
6
6.25
6.25
6.5
6.5
6.75
6.75
7
7
Time in s
Fig. 13. Acceleration signals z
1
and z
6
without/with collocated LQG control
320
Vibration Analysis and Control – New Trends and Developments
MIMO Vibration Control for a Flexible Rail Car Body: Design and Experimental Validation 13
open loop
closed loop
Re
Im
0
0
2000
4000
−2000
−4000
−20−40
−60
−80
Fig. 14. Rail car model open-loop and collocated LQG closed-loop pole locations
open loop
closed loop
Re
Im
0
0
200
100
−100
−200
−1−2
−3
−4
Fig. 15. Rail car model open-loop and collocated LQG closed-loop pole locations (zoomed)
3.2 Frequency-weighted H
2
controller for a reduced-order system
The LQG controllers designed in the previous section do not take into account the
performance vector z. The design of the regulator and the estimator gains are a trade-off
between highly-damped modes, expressed by the negative real part of the closed-loop poles,
and robustness considerations. The generalization of the LQG controller is the
H
2
controller,
which explicitly considers the performance vector (e.g. one can minimize the deflection
2-norm at a certain point of a flexible system). Another advantage of this type of optimal
controller is the possibility to utilize frequency-domain weighting functions. In doing so, the
controller action can be shaped for specific target frequency ranges. In turn, the controller
can be designed not to influence the dynamic behaviour where the mathematical model is
uncertain or sensitive to parameter variations.
321
MIMO Vibration Control for a Flexible Rail Car Body: Design and Experimental Validation
14 Vibration Control
high-pass filter low-pass filter
P
∗
(s)
P(s)
K(s)
W
act
(s)
W
perf
(s)
u
w
z
y
Fig. 16. Closed-loop system P
(s) with controller K(s) and actuator and performance
weighting functions W
act
(s) and W
perf
(s)
Fig. 16 shows the closed-loop system, where the system dynamics, the controller, and the
frequency-weighted transfer functions are denoted by P
(s), K(s), W
act
(s),andW
perf
(s).
Taking into account the frequency-weights in the system dynamics, the weighted system
description of P
∗
can be formulated:
⎡
⎣
z
y
⎤
⎦
=
P
∗
11
(s) P
∗
12
(s)
P
∗
21
(s) P
∗
22
(s)
⎡
⎣
w
u
⎤
⎦
, (22)
where P
∗
11
(s), P
∗
12
(s), P
∗
21
(s),andP
∗
22
(s) are the Laplace domain transfer functions from the
input variables u and w to the output variables y and z.
3.2.1 H
2
control theory
Let the system dynamics be given in the state-space form (1), fulfilling the following
prerequisites (see Skogestad & Postlethwaite (1996)):
•
(A, B
2
) is stabilizable
•
(C
2
, A) is detectable
• D
11
= 0, D
22
= 0
• D
12
has full rank
• D
21
has full rank
•
⎡
⎣
A
− jωI B
2
C
1
D
12
⎤
⎦
has full column rank for all ω
322
Vibration Analysis and Control – New Trends and Developments
MIMO Vibration Control for a Flexible Rail Car Body: Design and Experimental Validation 15
•
⎡
⎣
A
− jωI B
1
C
2
D
21
⎤
⎦
has full row rank for all ω
For compactness the following abbreviations are introduced:
R = D
12
T
D
12
S = B
2
R
−1
B
2
T
A = A − B
2
R
−1
D
12
T
C
1
Q = C
1
T
C
1
− C
1
T
D
12
R
−1
D
12
T
C
1
0
R = D
21
D
21
T
S = C
2
T
R
−1
C
2
A = A − B
1
D
21
T
R
−1
C
2
Q = B
1
B
1
T
− B
1
D
21
T
R
−1
D
21
B
1
T
0,
where
0 denotes positive-semidefiniteness of the left-hand side. The H
2
control design
generates the controller transfer function K
(s) which minimizes the H
2
norm of the transfer
function T
wz
, or equivalently
T
wz
2
=
1
2π
∞
−∞
T
wz
T
(jω)T
wz
(jω)dω → min . (23)
The controller gain K
c
and the estimator gain K
f
are determined by
K
c
= R
−1
(B
2
T
X
2
+ D
12
T
C
1
) (24)
and
K
f
=(Y
2
C
2
T
+ B
1
D
21
T
)R
−1
, (25)
where X
2
0 and Y
2
0 are the solutions of the two algebraic Riccati equations
X
2
A + A
T
X
2
− X
2
SX
2
+ Q = 0, (26)
AY
2
+ Y
2
A
T
− Y
2
SY
2
+ Q = 0. (27)
The state-space representation of the controller dynamics is given by
˙
x
=(A − B
2
K
c
− K
f
(C
2
− D
22
K
c
))x + K
f
y
u
= −K
c
x,
⇒ u = −K(s)y. (28)
3.2.2 H
2
controller design and results for strain sensors / non-collocation
The frequency-weighting functions have been specified as
W
act
= G
act
· I
4×4
= 4967 ·
(
s + 45)
4
· (s
2
+ 6s + 3034)
(s + 620)
4
· (s + 2000)
2
· I
4×4
(29)
323
MIMO Vibration Control for a Flexible Rail Car Body: Design and Experimental Validation
16 Vibration Control
W
perf
= G
perf
· I
6×6
= 20 · I
6×6
(30)
As in the previous section, the
H
2
controller is designed for the reduced-order model
(12 states). Considering the shaping filter (2) for the disturbance (8
= 4 · 2 states) and the
weighting functions (29) and (30) (24
= 4 · 6 states), one finds a controller of order 44.
Table 3 lists the reduction of the ISO-filtered (see Fig. 5) RMS of each performance variable
z
1,ISO
–z
6,ISO
compared to open-loop results. Figures 17–20 contain the maximum/minimum
singular values from the white noise input d (which is related to the colored noise input w
by (3)) to the performance vector z, the time-domain response of two selected performance
variables z
1
and z
6
, and two pole location plots (overview and zoomed) for the open- and the
closed-loop results.
Performance position index i 1 2 3 4 5 6 avg.
RMS reduction z
i,ISO
in % 26.27 27.95 28.71 27.84 30.99 34.31 29.35
Table 3. RMS reduction of the performance vector z by H
2
control (strain sensors /
non-collocation), system order 44
open loop
closed loop
max./min. singular values T
dz
Frequency in
rad
/s
Singular values in dB
0
−10
−20
−30
−40
−50
−60
30
100
300
Fig. 17. Reduction of rail car disturbance transfer singular values with non-collocated H
2
control
3.2.3 H
2
controller design and results for acceleration sensors / collocation
The frequency-weighting functions have been specified as
W
act
= G
act
· I
4×4
= 4967 ·
(
s + 45)
4
· (s
2
+ 6s + 3034)
(s + 620)
4
· (s + 2000)
2
· I
4×4
, (31)
W
perf
= G
perf
· I
6×6
= 20 · I
6×6
. (32)
Table 4 lists the reduction of the ISO-filtered (see Fig. 5) RMS of each performance variable
z
1,ISO
–z
6,ISO
compared to open-loop results. Figures 21–24 contain the maximum/minimum
singular values from the white noise input d (which is related to the colored noise input w
324
Vibration Analysis and Control – New Trends and Developments
MIMO Vibration Control for a Flexible Rail Car Body: Design and Experimental Validation 17
open loop
closed loop
z
1
z
6
0
0
0.01
0.01
−0.01
−0.01
6
6
6.25
6.25
6.5
6.5
6.75
6.75
7
7
Time in s
Fig. 18. Acceleration signals z
1
and z
6
without/with non-collocated H
2
control
open loop
closed loop
Re
Im
0
0
2000
4000
−2000
−4000
−20−40−60−80
Fig. 19. Rail car model open-loop and non-collocated H
2
closed-loop pole locations
by (3)) to the performance vector z, the time-domain response of two selected performance
variables z
1
and z
6
, and two pole location plots (overview and zoomed) for the open- and the
closed-loop results.
Performance position index i 1 2 3 4 5 6 avg.
RMS reduction z
i,ISO
in % 23.89 28.12 27.23 24.67 28.85 31.27 27.34
Table 4. RMS reduction of the performance vector z by H
2
control (acceleration sensors /
collocation), system order 44
3.3 Interpretation
The main goal for both the LQG and the H
2
controller designs was to increase the damping
of the first three eigenmodes. In the present design task, the LQG controller designed for
325
MIMO Vibration Control for a Flexible Rail Car Body: Design and Experimental Validation
18 Vibration Control
open loop
closed loop
Re
Im
0
0
200
100
−100
−200
−1−2
−3
−4
Fig. 20. Rail car model open-loop and non-collocated H
2
closed-loop pole locations (zoomed)
open loop
closed loop
max./min. singular values T
dz
Frequency in
rad
/s
Singular values in dB
0
−10
−20
−30
−40
−50
−60
30
100
300
Fig. 21. Reduction of rail car disturbance transfer singular values with collocated H
2
control
collocated acceleration sensors (see Section 3.1.3) did not yield satisfactory performance.
The singular value plot shows only marginal magnitude reduction (Figure 12), and also
a time-domain analysis of the performance signals z
1
and z
6
(see Figure 13) shows no
significant improvement. According to Table 2, the reduction of the filtered performance
vector is approximately 8%. However, at ω
≈ 1500
rad
/s one of the frequency response modes
approaches the imaginary axis (Fig. 14 and Fig. 15). Even though the simulated closed loop
remains stable, this spillover is critical for operation at an uncertain real plant which possesses
unknown high-frequency dynamics.
Considering the LQG design for non-collocated strain sensors in Section 3.1.2, the controller
significantly improves the vibrational behaviour. The performance vector is reduced by 23%
(Table 1) and a significant reduction is apparent for the time-domain evaluation in Fig. 9. The
maximum singular values of the first three eigenmodes are reduced (e.g. third eigenmode
326
Vibration Analysis and Control – New Trends and Developments
MIMO Vibration Control for a Flexible Rail Car Body: Design and Experimental Validation 19
open loop
closed loop
z
1
z
6
0
0
0.01
0.01
−0.01
−0.01
6
6
6.25
6.25
6.5
6.5
6.75
6.75
7
7
Time in s
Fig. 22. Acceleration signals z
1
and z
6
without/with collocated H
2
control
open loop
closed loop
Re
Im
0
0
2000
4000
−2000
−4000
−20−40
−60
−80
Fig. 23. Rail car model open-loop and collocated H
2
closed-loop pole locations
−11 dB, see Fig. 8). From the pole location plot one concludes that in the higher frequency
domain the frequency response modes remain unchanged (Fig. 10 and Fig. 11).
Both variants of the
H
2
-optimal controllers (Section 3.2.2 and Section 3.2.3) show significantly
higher performance in simulation than the controllers obtained by the LQG design procedure.
The main advantage of the
H
2
design approach is the possibility to directly incorporate
frequency weights to shape the design, see (29) and (31). Specifically, the frequency
content of the actuator command signals can be modified. The control law actuates
mainly within the frequency range ω
≈ 50 − 70
rad
/s due to the transmission zeros in the
weighting functions W
act
. In the high-frequency domain, W
act
is large for both H
2
designs,
so only small actuator signal magnitudes result at these frequencies which is especially
327
MIMO Vibration Control for a Flexible Rail Car Body: Design and Experimental Validation
20 Vibration Control
open loop
closed loop
Re
Im
0
0
200
100
−100
−200
−1−2
−3
−4
Fig. 24. Rail car model open-loop and collocated H
2
closed-loop pole locations (zoomed)
favorable if the plant dynamics is unknown there. The results for strain/non-collocation and
acceleration/collocation control designs are shown in Figs. 17–20 and Table 3 as well as in
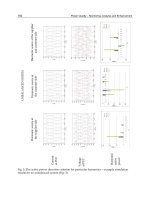
Figs. 21–24 and Table 4. In the first case the vibrations of the time-domain performance signals
z
i,ISO
are reduced by 30% (Fig. 18), which is also indicated by the singular values plot (Fig. 17):
the lowest three modes are reduced on average by 11 dB. Virtually no spillover occurs at high
frequencies (ω
≈ 150 − 4000
rad
/s): The singular values are unchanged (not shown) and also
the pole locations remain unchanged for ω
> 150
rad
/s (seen in Fig. 19 and Fig. 20 where the
open-loop poles (blue circles) and closed-loop poles (black crosses) coincide).
The acceleration sensor / collocation simulation results show similar improvement: Only the
first three modes are strongly damped (Fig. 21 and Fig. 24), the other ones are hardly affected
by the controller action due to the specific choice of the weighting function (31), see Fig. 23.
The average reduction of the ISO-filtered performance variables is 27% (Table 4 and Fig. 22).
As a concluding remark, note that the combination of the
H
2
method with
frequency-weighted transfer functions for the input and the performance signals (W
act
,
W
perf
) provide satisfactory results, which are characterized by their high robustness and
insensitivity to parameter uncertainties. It is shown that the frequency content of the
controller action can be tuned by the input weight W
act
, which affects only the first modes
of interest. Higher modes, which are much more difficult to model, are hardly affected due
to the roll-off of the
H
2
controller. Nevertheless, the LQG controller shows very promising
results for the case of non-collocated strain sensors, although the controller is designed for
a strongly reduced model containing only 6 modes (note that the full order model has 29
modes). If the acceleration signals are measured and sensor and actuators are collocated, the
full-order plant is destabilized by the LQG controller (designed on the reduced-order plant).
Finally, it is noted that so-called reduced-order LQG controllers (see Gawronski (2004)) also
have been designed to control the metro vehicle, see Schöftner (2006). By this method an
LQG controller has been directly designed for the full-order plant model with 29 modes.
Then, the controller transfer functions are evaluated (dynamic systems of order 58) and
transformed to the Gramian-based input/output-balanced form. Hardly observable or
controllable states, indicated by small Hankel singular values, are truncated, yielding a
328
Vibration Analysis and Control – New Trends and Developments
MIMO Vibration Control for a Flexible Rail Car Body: Design and Experimental Validation 21
low-order controller. While this procedure works well for academic problems (for example, a
simply-supported beam), for the metro car body no low-order controller with good vibration
reduction performance could be found, see Schöftner (2006).
3.4 Experimental setup of scaled metro car body
3.4.1 General remarks
Fig. 25 and Fig. 26 show the laboratory testbed in which the metro car body scale model is
operated. The aluminum structure is excited via an electrodynamic shaker, two Piezo patches
measure local structure strain, and two Piezo stack actuators, mounted in consoles on the
structure, provide an efficient means of structural actuation. Fig. 26 also shows the actuation
and measurement setup symbolically with actuator amplifier (AA), shaker amplifier (SA),
antialiasing filters (AF), measurement amplifier (MA) and the laboratory computer (Lab PC)
on which the real-time control algorithms are implemented.
Fig. 25. Scaled metro car body
Fig. 26. Basic sketch of the scaled metro car body with actuators, sensors, and performance
variables
The pole plot and the singular-value plot (Fig. 27 and Fig. 28) of the frequency response
provide information on the identified dynamics of the laboratory setup (200 modes): the
modes relevant for the control problem are the bending mode at f
≈ 65 Hz and the torsional
329
MIMO Vibration Control for a Flexible Rail Car Body: Design and Experimental Validation
22 Vibration Control
mode at f ≈ 75 Hz. The majority of the poles are either negligible high-frequency modes or
other local oscillatory modes.
Re
Im
torsion
mode
bending
mode
suspension
mode
0
0
1000
500
−500
−1000
−10 −8 −6
−4 −2
2
Fig. 27. Pole plot of the identified scaled metro car body (zoomed)
Singular values T
dz
Singular values in dB
torsion mode
bending mode
suspension
mode
Frequency in
rad
/s
0
30
20
10
−10
−20
100
500 1000
Fig. 28. Singular values of the identified scaled metro car body
The goal is to significantly dampen the torsional and the bending modes without destabilizing
other oscillatory modes. For an objective evaluation of the active vibration control problem,
the RMS of the frequency-filtered performance variables z
i,ISO
(i = 1, ,6) are compared
in the open-loop and closed-loop responses. These six performance quantities represent
a quantification of passenger ride comfort. A more detailed analysis can be found in
Kozek & Benatzky (2008) and Schirrer (2010).
330
Vibration Analysis and Control – New Trends and Developments
MIMO Vibration Control for a Flexible Rail Car Body: Design and Experimental Validation 23
3.4.2 LQG controller design
An LQG controller is designed for a reduced-order plant model with 28 states (the system
is identified with 200 states, see Kozek et al. (2011)). Hence the system is transformed into
a modal state space representation and all eigenmodes with an eigenfrequency higher than
f
≈ 75 Hz are truncated and not considered for the controller design. The weighting functions
for the regulator and the estimator design are
Q
=
I
24×24
0
0 6
· 10
6
· I
4×4
, R
= I
2×2
(33)
W
= 0.0054, V = 2 · 10
−4
I
2×2
. (34)
Note that Q in (33) is chosen such that only the bending and the torsional vibrations should
be significantly damped. A discussion of the results for the closed-loop system is given in
Section 3.4.4.
3.4.3 H
2
controller design
The H
2
controller is designed for a plant model which only considers 3 eigenmodes (two
of them describe the bending and torsional behaviour). For an efficient control design the
frequency-dependent actuator and performance functions are specified as
W
act
= G
act
· I
2×2
= 188.5 · 10
9
·
(
s
2
+ 77.91s + 151800)
4
(s + 10000)
8
· I
2×2
. (35)
W
perf
= G
perf
· I
6×6
= I
6×6
(36)
Note that the transmission zeros of W
act
are near the two target modes to be damped, causing
the actuator action to be a maximum for these frequencies. A discussion of the results for the
closed-loop system are given in Section 3.4.4.
3.4.4 Results
Table 5 and Figures 29, 30, 31, and 32 show the damping ability of both types of controllers. In
both cases, the vibrations of the actively controlled system are significantly reduced compared
to the open-loop response of the system. The accelerations at both ends of the structures,
expressed by the performance variables z
1
, z
2
, z
5
and z
6
can be significantly reduced, whereas
z
3
and z
4
are close to the open-loop response. This is explained due to the fact that the
first torsional mode dominates the bending vibrations for the scale laboratory setup. For the
LQG controller the singular values only differ for the torsional and the bending vibrations
(
−14 dB and −10 dB). It is evident that only the eigenvalues of the two targeted flexible
modes are affected by the controller. The unchanged mode at lower frequency is an almost
uncontrollable suspension mode, while the higher flexible modes are not adversely affected
by the control action.
Analogous results could be obtained using the frequency-weighed
H
2
-optimal control design
methodology: the achieved RMS reductions of the performance variables are approximately
the same as for the LQG control method. Note that the bandwidth of the frequency-weighted
controller is narrow around f
= 60 − 75 Hz where the actuator weightings are small. Contrary
to the LQG approach, the target modes as well as other modes with a higher negative real part
are positively influenced. This indicates that the model quality is sufficiently high and that
331
MIMO Vibration Control for a Flexible Rail Car Body: Design and Experimental Validation
24 Vibration Control
the control laws are insensitive to the occurring differences between design plant and actual
system.
Performance position index i 1 2 3 4 5 6 avg.
RMS reduction z
i,ISO
(LQG) in % 41.53 34.69 8.83 6.02 37.28 36.94 27.55
RMS reduction z
i,ISO
(H
2
)in% 41.31 35.69 -4.00 4.59 34.89 36.16 24.77
Table 5. Laboratory testbed results: RMS reduction of the performance vector z by an LQG
(system order 28) and an
H
2
controller (system order 23) utilizing strain feedback sensors
open loop
closed loop
Re
Im
0
0
1000
500
−500
−1000
−80 −60
−40
−20
20
Fig. 29. Pole plot with/without LQG controller
0
10
20
30
open loop
closed loop
Singular values T
dz
Singular values in dB
Frequency in
rad
/s
−10
−20
100
500
1000
Fig. 30. Singular values of the frequency response plot with/without LQG controller
332
Vibration Analysis and Control – New Trends and Developments
MIMO Vibration Control for a Flexible Rail Car Body: Design and Experimental Validation 25
open loop
closed loop
Re
Im
bandwidth
0
0
1000
500
−500
−1000
−80 −60 −40 −20
20
Fig. 31. Pole plot with/without H
2
controller
open loop
closed loop
Singular values in dB
Singular values in dB
Frequency in
rad
/s
0
30
20
10
−10
−20
100
500 1000
Fig. 32. Singular values of the frequency response plot with/without H
2
controller
4. Conclusions
This chapter presents a case study on the design of MIMO control laws to reduce vibrations
in a flexible metro rail car body and thus to improve passenger ride comfort. Direct structural
actuation by Piezo actuators is considered and two sensor concepts – strain sensors (in a
non-collocated setting) and acceleration sensors (collocated) – are evaluated. One part of
the outlined studies focused on a simulation model of a full-size lightweight metro rail car
body; the other part tests the control concepts on a laboratory testbed with a scale model
of the car body. The control laws have been designed by LQG and by frequency-weighted
H
2
-optimal control design methodologies. Both design methods are first studied in the
simulation and compared. It is found that the weighted
H
2
designs yield controllers that
perform satisfactorily in the presence of model uncertainty and independent of the sensor
concept (strain sensors / non-collocation or acceleration sensors / collocation): the first three
333
MIMO Vibration Control for a Flexible Rail Car Body: Design and Experimental Validation
26 Vibration Control
modes of interest are significantly attenuated and the unknown modes in the high-frequency
domain are hardly affected by the controller action, thus increasing the ride comfort for
the passengers. The LQG controller minimizes the vibrations only for strain sensors in
the non-collocated setup. Finally, both design methods, which have been studied for the
lightweight rail car body simulations, are successfully implemented in a scaled laboratory
setup: it is demonstrated that the target modes (torsion and bending) have been significantly
damped by both controller types. A further advantage of the weighted
H
2
controller is that
the controller action can be tuned for a specific bandwidth in the frequency domain, which is
essential if the dynamics of the structure under consideration is uncertain or a control input is
not desired for certain frequencies. The studies’ results show the applicability of weighted
H
2
control for partially uncertain flexible-structure systems. The control goal of improving ride
comfort is directly formulated as a weighted
H
2
minimization problem which justifies the
presented study. However, a range of related publications show the design and application
of robust
H
∞
-optimal controllers for this application, which can give robustness guarantees
based on the structured singular value.
5. References
Benatzky, C. (2006). Theoretical and experimental investigation of an active vibration damping
concept for metro vehicles, PhD thesis, Institute for Mechanics and Mechatronics,
Division of Control and Process Automation, Vienna University of Technology,
Austria.
Benatzky, C. & Kozek, M. (2005). Effects of local actuator action on the control of large flexible
structures, Proceedings of the 16th IFAC World Congress, Prague, Chech Republic.
Benatzky, C. & Kozek, M. (2007a). An actuator fault detection concept for active vibration
control of a heavy metro vehicle, Proceedings of the 14th International Congress on Sound
and Vibration (ICSV14), Cairns, Australia.
Benatzky, C. & Kozek, M. (2007b). An identification procedure for a scaled metro vehicle -
flexible structure experiment, Proceedings of the European Control Conference ECC 2007,
Kos, Greece, Kos, Greece.
Benatzky, C., Kozek, M. & Bilik, C. (2006). Experimental control of a flexible beam using a
stack-bending-actuator principle, Proceedings of the 20th Scientific Conference,Hanoi,
Vietnam.
Benatzky, C., Kozek, M. & Jörgl, H. (2007). Comparison of controller design methods for a
scaled metro vehicle - flexible structure experiment, Proceedings of the 26th American
Control Conference, New York, USA.
Bilik, C. (2006). Aufbau und Inbetriebnahme des Prüfstandmodelles eines
Schienenfahrzeug-Wagenkastens zum Nachwei s von akti ver Schwingungsdämpfung,
Diploma thesis, Vienna University of Technology, Vienna.
Bilik, C., Benatzky, C. & Kozek, M. (2006). A PC-based multipurpose test bed environment for
structural testing and control, Proceedings of the 3rd International Symposium on Remote
Engineering and Virtual Instrumentation, Maribor, Slovenia.
Foo, E. & Goodall, R. M. (2000). Active suspension control of flexible-bodied railway vehicles
using electro-hydraulic and electro-magnetic actuators, Control Engineering Practice
8(5): 507–518.
334
Vibration Analysis and Control – New Trends and Developments
MIMO Vibration Control for a Flexible Rail Car Body: Design and Experimental Validation 27
Frederich, F. (1984). Die Gleislage - aus fahrzeugtechnischer Sicht, Vol. 108 (12) of Gleislauftechnik,
Siemens Verlagsbuchhandlung, pp. 355 – 361.
Gawronski, W. (2004). Advanced structural dynamics and active control of structures,Springer,
New York.
Hansson, J., Takano, M., Takigami, T., Tomioka, T. & Suzuki, Y. (2004). Vibration Suppression
of Railway Car Body with Piezoelectric Elements, JSME International Journal Series C
47(2): 451–456.
ISO (1997). ISO2631-1: Mechanical vibration and shock - evaluation of human exposure to
whole-body vibration. Part 1: General requirements, International Organization for
Standardization. Corrected and reprinted July 15th, 2007.
Kamada, T., Tohtake, T., Aiba, T. & Nagai, M. (2005). Active vibration control of the railway
vehicle by smart structure concept, in S. Bruni & G. Mastinu (eds), 19th IAVSD
Symposium - Poster Papers.
Kozek, M. & Benatzky, C. (2008). Ein maßstäbliches Experiment zur aktiven
Schwingungsdämpfung eines Eisenbahn-Wagenkastens, at - Automatisierungstechnik
10(56): 504–512.
Kozek, M., Benatzky, C., Schirrer, A. & Stribersky, A. (2011). Vibration damping of a flexible
car body structure using piezo-stack actuators, Control Engineering Practice 19(3): 298
– 310. Special Section: IFAC World Congress Application Paper Prize Papers.
URL: http://www .sciencedirect.com/science/article/B6V2H-4X3MR4Y- 2/2/3ef1d868e70c2b
6f10fd9412f9c8c1de
Luenberger, D. G. (1964). Observing the state of a linear system, IEEE Transactions on Military
Electronics 8(2): 74–80.
Mohinder, S. & Angus, P. (2001). Kalman Filtering: Theory and Practice Using MATLAB, Wiley
Interscience, John Wiley & Sons, USA.
Popprath, S., Benatzky, C., Bilik, C., Kozek, M., Stribersky, A. & Wassermann, J. (2006).
Experimental modal analysis of a scaled car body for metro vehicles, Proceedings of
the 13th International Congress on Sound and Vibration (ICSV13), Vienna, Austria.
Popprath, S., Schirrer, A., Benatzky, C., Kozek, M. & Wassermann, J. (2007). Experimental
modal analysis of an actively controlled scaled metro vehicle car body, Proceedings of
the 14th International Congress on Sound and Vibration (ICSV14), Cairns, Australia.
Preumont, A. (2006). Mechatronics: Dynamics of Electromechanical and Piezoelectric Systems,
Springer.
Schandl, G. (2005). Methodenuntersuchung zur aktiven Schwingungsreduktion eines
Schienenfahrzeugwagenkastens, PhD thesis, Vienna University of Technology, Vienna.
Schandl, G., Lugner, P., Benatzky, C., Kozek, M. & Stribersky, A. (2007). Comfort enhancement
by an active vibration reduction system for a flexible railway car body, Vehicle System
Dynamics 45(9): 835–847.
Schöftner, J. (2006). Aktive Schwingungsdämpfung eines Schienenfahrzeugwagenkastens durch
H
2
-Regelung, Master’s thesis, Institute for Mechanics and Mechatronics, Division of
Control and Process Automation, Vienna University of Technology.
Schirrer, A. (2010). Co-Simulation of Rail Car Body Vibration Control with SimPACK
®
,VDM
Verlag Dr. Müller, Saarbrücken, Germany.
Schirrer, A. & Kozek, M. (2008). Co-simulation as effective method for flexible structure
vibration control design validation and optimization, Control and Automation, 2008
16th Mediterranean Conference on, pp. 481 –486.
335
MIMO Vibration Control for a Flexible Rail Car Body: Design and Experimental Validation
28 Vibration Control
Schirrer, A., Kozek, M. & Benatzky, C. (2008). Piezo stack actuators in flexible structures:
Experimental verification of a nonlinear modeling and identification approach, 6th
EUROMECH Nonlinear Dynamics Conference (ENOC 2008), OPEN-ACCESS library.
URL:
Schirrer, A., Kozek, M., Plank, A., Neumann, M., Badshah, S. & Wassermann, J.
(2008). Vibration analysis of an actively controlled flexible structure using speckle
interferometry, Proceedings of 15th International Congress on Sound and Vibration
(ICSV15).
Skogestad, S. & Postlethwaite, I. (1996). Multivariable feedback control, John Wiley & Sons.
Stribersky, A., Müller, H. & Rath, B. (1998). The development of an integrated suspension
control technology for passenger trains, Proceedings of the Institution of Mechanical
Engineers, Part F: Journal of Rail and Rapid Transit, Vol. 212, pp. 33–42.
336
Vibration Analysis and Control – New Trends and Developments
16
Changes in Brain Blood Flow on Frontal Cortex
Depending on Facial Vibrotactile Stimuli
Hisao Hiraba
1
, Takako Sato
2
, Satoshi Nishimura
2
, Masaru Yamaoka
3
,
Motoharu Inoue
1
, Mitsuyasu Sato
1
, Takatoshi Iida
1
, Satoko Wada
1
,
Tadao Fujiwara
3
and Koichiro Ueda
1
1
Departments of Dysphasia Rehabilitation
2
Oral and Maxillofacial Surgery
and
3
Physics, Nihon University, School of Dentistry
Japan
1. Introduction
We provide patients who have problems with reduced salivation (hyposalivation) with
artificial saliva treatment, humectants, and salivary gland massage (Ueda et al. 2005).
However, treatment with artificial saliva and humectants is symptomatic, and although
salivary gland massage can reinvigorate weak glands, to do so is difficult for people with
disabilities and has varying effects, depending on operator skill. Thus, we have focused on
increasing salivation through the use of vibrotactile stimulation, as reported by Hiraba et al.
(2008). Before using this apparatus on patients, it was necessary to first estimate the effect on
normal subjects.
The biggest challenge with continuous use of stimulation is an adaptive effect. In particular,
we were interested in determining whether the effect was continuous without attenuation,
when patients continue using the apparatus every day (Despopoulos and Silbernagel, 2003).
We investigated adaptation to the continuous use of vibrotactile stimuli for 4 or 5 days in
the same subjects to determine whether this resulted in a decrease in salivation
(Despopoulos and Silbernagel, 2003; Principles of Neural Science. 2000a). Before this
experiment was performed, it was necessary to compare resting and stimulating salivary
secretion and to investigate the most effective frequency for increasing salivary secretion.
We examined the amount of salivation during vibrotactile stimuli with a single motor (1.9
µm amplitude) on the bilateral masseter muscle belly (on the parotid glands), using a dental
cotton roll positioned at the opening of the secretory duct for 3 min. Furthermore, we
examined the amount of salivation during vibrotactile stimuli with single and double
motors (1.9 µm and 3.5 µm amplitudes) on the bilateral submandibular angles (on the
submandibular glands). Then, we compared resting and stimulating salivation and
investigated the most effective frequency for increasing salivary secretion. The effect of
increased salivation in normal subjects was determined as the difference between resting
and stimulating salivation.
We defined a 5-min interval as the recovery time between resting and stimulating salivation
from a preliminary study. First, we examined the most effective frequency for salivation of
Vibration Analysis and Control – New Trends and Developments
338
the parotid glands among 89, 114, and 180 Hz with a single motor, and then we found the
most effective frequency for salivation of the submandibular glands between 89 and 114 Hz
with single and double motors. We discuss the effects of vibrotactile stimulation based on
these results.
Furthermore, to study the mechanism of increased salivation evoked by vibrotactile stimuli,
we recorded changes in brain blood flow (BBF) at the frontal cortex and the pulse frequency
during stimulation. When subjects listen to classical music (particularly Mozart), they develop
a relaxed feeling. Specifically, the feeling of relaxation is produced by decreasing BBF in the
frontal cortex. In particular, we suggest that the relaxed feeling is produced by an increase in
parasympathetic activity. Furthermore, we examined changes in the pulse frequency during
vibrotactile stimulation. A decrease in pulse frequency suggests an increase in
parasympathetic activity (Principles of Neural Science. 2000b). Thus, we assumed a
mechanism of increased salivation by exploring oxyhemoglobin (oxyHb) concentration in the
BBF of the frontal cortex and changes in pulse frequency. We believe that the coordination is
carried out by a highly interconnected set of structures in the brain stem and forebrain that
form a central autonomic network (Principles of Neural Science. 2000b).
2. Material and methods
2.1 Vibrotactile stimulation apparatus
The vibrotactile stimulation apparatus consists of an oscillating body and control unit, as
shown in Hiraba et al. (2008) and Yamaoka et al. (2007). The oscillating body is composed of
the headphone headset equipped with vibrators as a substitute for positions of the bilateral
microphones, and vibrators utilizing the vibration electric motor (VEM) (Rekishin Japan Co.,
LE12AOG). The VEM was covered in silicon rubber (polyethyl methacrylate, dental mucosa
protective material, Shyofu Co.) for conglobating the stimulation parts and preventing the
warming of the VEM's temperature produced by the vibration of long periods (Hiraba et al.
2008). The control unit consists of three parts, the pulse width modulation (PWM) circuit in
Figure 1A-a, LCD monitor circuit (Figure 1A-b) and power supply circuit (Figure 1A-c), and
it interfaced with a PWN electric motor, delivered vibration frequencies in the 60-182 Hz
range (Yamaoka et al. 2007).
We examined the amount of salivation during vibrotactile stimuli on the bilateral masseter
muscle belly (on the parotid glands) and on bilateral parts of the submandibular angle (on
the submandibular glands; Fig. 1B, 1C). We determined the amount of salivation using a
dental cotton roll (1 cm across, 3 cm length) positioned at the opening of the secretory ducts
(right and left sides of the parotid glands and right and left sides of the submandibular and
sublingual glands), during vibrotactile stimulation of the bilateral parotid and
submandibular glands. The weights of the wet cotton rolls after 3 min of use were compared
with their dry weights (Hiraba et al. 2008).
2.2 Stimulating salivation in normal subjects
We determined that a 3-min salivation measurement with a 5-min recovery time was
sufficient from a previous experiment (Hiraba et al. 2008). First, we used three frequencies
with a single motor (89, 114, 180 Hz-S) on the parotid glands (Fig. 1B, 1D) and conducted a
practice exercise so that the participants could learn to avoid the foreign-body sensation of
the cotton rolls for 3 min. Next, after a 5-min rest, we examined the amount of salivation
during 89 Hz-S vibrotactile stimulation for 3 min. After every 5 min of rest, we examined the