REGIONAL OFFICE OF EDUCATION #1 NOTES TO FINANCIAL STATEMENTS JUNE 30, 2009 SUMMARY OF SIGNIFICANT ACCOUNTING POLICIES (Continued)_part2 ppt
Bạn đang xem bản rút gọn của tài liệu. Xem và tải ngay bản đầy đủ của tài liệu tại đây (115.24 KB, 10 trang )
REGIONAL OFFICE OF EDUCA
nON
#1
NOTES TO FINANCIAL STATEMENTS
JUNE 30, 2009
Note
13
- TEACHERS' RETIREMENT SYSTEM OF THE STATE OF ILLINOIS (Continued)
The Regional Office
of
Education
#1
makes other types
of
employer contributions directly to TRS.
• 2.2 formula contributions. Employers contribute 0.58 percent
of
creditable earnings for the 2.2
formula change. This rate
is
specified by statute. Contributions for the year ended June 30,
2009 were $527. Contributions for the years ending June 30, 2008, and June 30, 2007, were
$347 and $342, respectively.
• Federal and trust fund contributions. When TRS members are paid from federal and special
trust funds administered
by
the Regional Office
of
Education #1, there is a statutory requirement
for the Regional Office
of
Education
#1
to pay an employer pension contribution from those
funds. Under a policy adopted by the TRS Board
of
Trustees that was first effective in the fiscal
year ended June 30, 2009, employer contributions for employees paid from federal and trust
funds will be the same as the state contribution rate
ofTRS.
For the year ended June 30, 2009, the employer pension contribution was 17.08 percent
of
salaries paid from federal and trust funds. For the year ended June 30, 2008, the employer
contribution was
13
.11
percent
of
salaries paid from federal and trust funds. For the year ended
June 30, 2007, the employer pension contribution was 9.78 percent
of
salaries paid from those
funds. For the year ended June 30, 2009 salaries totaling $46,762 were paid from federal and
trust funds that required employer contributions
of
$7,987. For the years ended June 30, 2008
and June 30, 2007, required contributions were $2,983 and $2,131, respectively.
• Early Retirement Option (ERO). The Regional Office
of
Education
#1
is
also required to
make one-time employer contributions to TRS for members retired under the Early Retirement
Option (ERO). The payments vary depending on the age and salary
of
the member and under
which ERO program the member retires.
Under Public Act 94-0004, a "Pipeline ERO" program is provided for members to retire under
the same terms as the ERO program that expired June 30, 2005, provided they meet certain
conditions and retire on or before July
1,
2007.
If
members do not meet those conditions, they
can retire under the "Modified ERO" program, which requires higher member and employer
contributions to TRS. Also, under Modified ERO, Public Act 94-0004 eliminates the waiver
of
member and employer ERO contributions that had been in effect for members with 34 years
of
services (unless the member qualifies
for
Pipleline ERO).
Under the ERO program that expired on June 30, 2005 and the Pipleline ERO, the maximum
employer contribution
is
100
percent
of
the member's highest salary used in the final average
salary calculation.
Under the Modified ERO, the maximum employer contribution
is
117.5 percent. Both the 100
percent and 117.5 percent maximum apply when the member is age
55
at retirement. For the
three years ended June 30, 2009, the Regional Office
of
Education
#1
paid no employer
contributions under the Early Retirement Option.
38
This is trial version
www.adultpdf.com
REGIONAL OFFICE OF EDUCATION
#1
NOTES TO FINANCIAL STATEMENTS
JUNE 30, 2009
Note
13
- TEACHERS' RETIREMENT SYSTEM
OF
THE STATE OF ILLINOIS (Continued)
• Salary increases over 6 percent and excess sick leave.
Public Act 94-0004 added two new
employer contributions to TRS.
If
the employer grants salary increases over 6 percent and those salaries are used to calculate a
retiree's final average salary, the employer makes a contribution to TRS. The contribution will
cover the difference in actuarial cost
of
the benefit based on actual salary increases and the
benefit based on salary increases
of
up to 6 percent.
For the three years ended June 30, 2009, the Regional Office
of
Education
#1
paid no employer
contributions under salary increases over 6 percent.
If
an employer grants sick leave days
in
excess
of
normal annual allotment and those days are
used
as
TRS service credit, the employer makes a contribution to TRS. The contribution
is
based on the number
of
excess sick leave days used as service credit, the highest salary used to
calculate final average salary, and the TRS total normal cost rate (18.67 percent
of
salary during
the year ended June 30, 2009).
For the three years ended June 30, 2009, the Regional Office
of
Education
#1
paid no employer
contributions under excess sick leave.
TRS financial information, an explanation
ofTRS
benefits, and descriptions
of
members, employer
and state funding requirements can be found in the
TRS Comprehensive Annual Financial Report for
the year ended June 30, 2008. The report for the year ended June 30, 2009,
is
expected to be
available in late 2009. The reports may be obtained
in
writing to the Teacher's Retirement System
of
the State
of
Illinois, PO Box 19253,2815 West Washington Street, Springfield, Illinois 62794-
9253. The most current report
is
also available on the TRS web site at www.trs.illinois.gov.
Note 14 - NEW ACCOUNTING PRONOUNCEMENT
Effective for the year ending June 30, 2009, the Regional Office
of
Education
#1
adopted the
following GASB Statements:
a)
GASB Statement No. 49, Accounting and Financial Reportingfor Pollution Remediation
Obligations.
b) GASB Statement No. 52, Land and Other Real Estate Held as Investments by Endowments.
c) GASB Statement
No.5
5,
The
Hierarchy
of
Generally Accepted Accounting Principles
for
State and Local Governments.
d) GASB Statement No. 56, Codification
of
Accounting and Financial Reporting Guidance
Contained
in
the AICPA Statements
on
Auditing Standards.
There was no significant impact on the Regional Office
of
Education # 1
's
financial statements as a
result
of
adopting statements 49, 52,
55
and 56.
39
This is trial version
www.adultpdf.com
Required Supplemental Information
(Other than Management's Discussion
& Analysis)
This is trial version
www.adultpdf.com
Actuarial
Valuation
Date
12/3112008
12/3112007
12/31/2006
Actuarial
REGIONAL OFFICE OF EDUCATION
#1
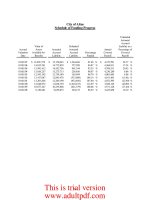
REQUIRED SUPPLEMENTARY INFORMATION
SCHEDULE OF FUNDING PROGRESS
Illinois Municipal Retirement Fund
Actuarial Unfunded
Value
of
Liability AAL
Funded Covered
Assets Entry Age (UAAL) Ratio Payroll
®
(ill
(B-A)
(AlB)
(Q
793,365 910,330 116,965 87.15%
601,769
873,007 796,119 (76,888) 109.66%
546,015
758,337 677,608 (80,729) 111.91% 565,850
40
UAAL as a
Percentage
of
Covered Payroll
[(B-A)!C]
19.44%
0%
0%
This is trial version
www.adultpdf.com
SUPPLEMENTAL INFORMATION
This is trial version
www.adultpdf.com
Regional Office Truants
of
Prevention Alternative
Administrators Effectiveness and Optional
Academ~
Services Education
ASSETS
Cash
and cash equivalents
$ $ (16,393) $ (21,498)
Grants
receivable
19,029 21,498
Prepaid items
109 136
Total assets
$ $
2,745 $ 136
LIABILITIES AND FUND BALANCE
Liabilities
Accounts payable
$
$
5,424
$
Total liabilities
5,424
Fund balances
Fund
balance - reserved
Fund
balance - unreserved
(2,679) 136
Total fund balance (deficit)
(2,679)
136
Total I iabilities and fund balance
$
$
2,745 $ 136
REGIONAL OFFICE OF EDUCATION
#1
COMBINING SCHEDULE OF ACCOUNTS
EDUCA TION FUND
JUNE 30, 2009
Standards General Student State Free
Aligned State Assistance
Lunch and
Classrooms Aid
Pro~ram
Breakfast
$
$
$
$
$
259,625
$ 1,249 $
55
$ 259,625
$
1,304
$
$ $ $
259,625 1,304
259,625 1,304
$ 259,625 $ 1,304 $
See accompanying Independent Auditor's Report
41
624
230
854
854
854
854
National McKinney Regional
Truancy School Lunch Education for Safe Bilingual
Reduction
__
f!:£gram
Homeless Schools Education
$ 940
$
1,843 $
869 $
(5,323)
$
III
40,101
$
940 $ 1,843 $ 869 $ 34,778 $
III
$
$
$
877 $ 32,526
$
877
___
32_,526
940 1,843
(8)
2,252
III
940 1,843 (8) 2,252
III
$ 940
$
1,843 $
869 $ 34,778 $
III
This is trial version
www.adultpdf.com
School
Tech. Prep
Breakfast
Additional
Program
ASSETS
Cash
and cash equivalents
$ 3,312 $ 52
Grants
receivable
Prepaid items
Total assets
$ 3,312 $
52
LIABILITIES AND FUND BALANCE
Liabil ities
Accounts
payable
$ $
Total liabilities
Fund balances
Fund
balance - reserved
Fund
balance - unreserved
3,312
52
Total fund balance (deficit)
3,312 52
Total liabilities and fund balance
$
3,312
$ 52
Special
Education
Grants
REGIONAL OFFICE OF EDUCATION
#1
COMBINING
SCHEDULE
OF ACCOUNTS
EDUCA TION FUND
JUNE
30, 2009
ARRA-
Learn and
General State Serve SAFE
Infant/Toddler Aid America
Program
$
$
$
$
(45,093) $
2
$
$ 1,650
39,685
382
(5,026)
$ 2
$
$
1,650
4,960 $ $
$
4,960
(9,986)
2 1,650
(9,986)
2 1,650
(5,026)
$
2
$
$
1,650
See accompanying Independent Auditor's Report
42
Teachers and
English Administrators
Language System
of
Mentoring Combined
Learners LIPLEPS
SUEEort
~ram
Total
$
(587) $ 3,655 $
(11,368) $
(1,527)
$
172,144
11,368 1,527 133,438
682
$ (587) $ 3,655 $
$
$ 306,264
$
$ 3,654
$ $ $
47,441
3,654 47,441
(587)
258,823
(587) 258,823
$
(587) $ 3,655 $
$ $ 306,264
This is trial version
www.adultpdf.com
Regional Office
of
Prevention
Administrators Effectiveness
Academy
Set\1ices
Revenues
Registration, certification and permit fees
$
$
Local sources
17,674
State sources
20,000 92,864
Federal sources
24,518
Interest income
Total
revenues
20,001 135,056
Expenditures
Salaries and benefits
17,689 84,068
Purchased services
1,022 7,864
Travel
and
entertainment
976 19,261
Supplies and materials
6 5,934
Institute expenses and workshops
Capital outlay
Communication
307
Postage and copies
Payment
to
other governmental units
4,378
Other
162
Total expenditures
20,000 121,667
Net changes
in
fund balances
13,389
Fund
balance - July I, 2008
(16,068)
Fund balance - June 30, 2009
$ (2,679)
REGIONAL
OFFICE
OF EDUCATION
#1
COMBINING
SCHEDULE
OF
REVENUES,
EXPENDITURES AND
CHANGES
IN FUND
BALANCES
EDUCATION FUND ACCOUNTS
FOR
THE
YEAR ENDED
JUNE
30, 2009
Truants
Alternative Standards General Student
and Optional Aligned State
Assistance
Education
Classrooms Aid
Program
$ $
80,118 173,164 70,700
234 2
80,118 173,398 70,702
71,580 50,353
2,577 164 4,218
7,027
4,277 4,702 11,293
402 2,028
9,724
767
581
9,166
144,680
80,184 164 172,490 70,701
(66) (164) 908
202
$ 136
164 258,717 1,303
$ $ 259,625 1,304
See accompanying Independent Auditor's Report
43
State Free
Lunch and
Breakfast
$
854
854
854
$
854
National McKinney Regional
Truancy School Lunch
Education for Safe
Bilingual
Reduction Program Homeless Schools Education
$
$
940 178
130,101
10,833 12,482
940 10,834 12,482
~102
179
10,250
15
520
8,991 820
900
130,104 888
8,991 12,490 130,119 888
940 1,843
(8)
(!
7) (709)
2,269 820
$ 940 1,843 (8) 2,252 $
III
This is trial version
www.adultpdf.com
School
Tech. Prep Breakfast
Additional
___
~!:,=,_gram
Revenues
Registration, certification and
pennit
fees
$ 7,329 $
Local sources
State
sources
Federal sources
3,834
Interest income
4
Total revenues
7,333
3,834
Expenditures
Salaries and benefits
Purchased services
8,127
Travel and entertainment
Supplies and materials
3,782
Institute expenses and workshops
Capital outlay
Communication
Postage and copies
Payment to other governmental units
Other
Total expenditures
8,127
3,782
Net changes
in
fund balances
(794)
52
Fund balance - July
1,2008
4,106
Fund balance - June 30, 2009
$ 3,312 $ 52
REGIONAL OFFICE OF EDUCA
nON
#1
COMBINING SCHEDULE OF REVENUES,
EXPENDITURES AND CHANGES
IN
FUND BALANCES
EDUCA
nON
FUND ACCOUNTS
FOR THE YEAR ENDED JUNE 30, 2009
Special
Education
ARRA-
Learn and
Grants General State Serve SAFE
Infant/Toddler Aid
America
Program
$
$
$
$
$
2,069
310,018
148,667 51,192
1
2
460,755
___
5_1,194
288,591
99,897
24,164
7,078
35,454 51,192
455,184 51,192
5,571 2
(1)
(15,557)
(9,986)
$ 2
$ $
See accompanying Independent Auditor's Report
44
45,818
13
45,831
45,000
45,000
831
819
1,650
Teachers and
English Administrators
Language
System
of
Mentoring Combined
Learners LIPLEPS Support Program Total
$ $ $
$
$ 7,329
12,871
79,550
3,170 1,527 882,516
66,000
48,546
26,852 392,924
2
263
66,002 48,547 42,893 1,527 1,362,582
44,380 36,646 1,527 605,084
19,657 150,568
5,115
70,308
2,612
657
32,310
475 10,199
1,074
10,647
1,642
48,546
461,885
162
68,291
48,546 42,893
1,527 1,342,237
(2,289)
20,345
1,702 238,478
$ (587) $ $
$
$ 258,823
This is trial version
www.adultpdf.com
REGIONAL
OFFICE
OF
EDUCATION
#1
BUDGETARY
COMPARlSON
SCHEDULE
EDUCATION
FUND
ACCOUNTS
FOR
THE
YEAR
ENDED
JUNE
30,
2009
Administrators
Academ~
Variance
Positive
Bud!;;et
Actual
(Ne!;;ative)
Revenues:
Local sources
$ $ $
State sources 20,000
20,000
Federal sources
Interest income
Total revenues
20,000 20,001
Expenditures:
Salaries
and
bene
tits 18,101 17,689 412
Purchased
services I,R99 1,022 877
Travel
and
entertainment
976
(976)
Supplies
and
materials 6 (6)
Institute
expenses
and
workshops
Capital
outlay
Communication
307
(307)
Postage
and
copies
Payment
to
other
governmental units
Other
Total expenditures
20,000
20,000
Net
change in fund
balances
$ $
Fund
halance,
July
1,
2008
Fund
balance, June
30,
2009
$
Re!;;ional
Otlice
of
Prevention
Etfectiveness
Services
Bud!;;et
Actual
Revenues:
Local
sources $ $
State sources
90,411
Federal sources
24,518
Interest income
Total revenues
114,929
Expenditures:
Salaries
and
benetits
79,534
Purchased services
8,661
Travel
and
entertainment
20,244
Supplies
and
materials
6,490
Institute expenses
and
workshops
Capital
outlay
Communication
Postage
and
copies
Payment
to
other
governmental units
Other
Total expenditures
Net
change in fund
balances
Fund
balance,
July 1, 2008
Fund
balance,
June
30,
2009
114,929
$
$
See
accompanying
Independent
Auditor's
Report
45
17,674
92,864
24,518
135,056
84,068
7,864
19,261
5,934
4,378
162
121,667
13,389
(16,068)
(2,679)
Variance
Positive
~Ne!;;ative)
$
17,674
2,453
20,127
(4,534)
797
983
556
(4,378)
~162)
~6,738)
$
13,389
This is trial version
www.adultpdf.com
