Electricity Infrastructures in the Global Marketplace Part 8 doc
Bạn đang xem bản rút gọn của tài liệu. Xem và tải ngay bản đầy đủ của tài liệu tại đây (2.74 MB, 50 trang )
Europe: Impact of Dispersed and Renewable Generation on Power System Structure 319
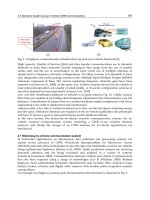
Further, the establishment of an offshore transmission system connecting the large offshore
wind farms with the grids of Norway, Denmark, Germany and Holland may reduce the
impact onto the Danish transmission system.
8.4.3 CHP Units
Since the energy crisis of the 1970s, small-scale CHP power plants have been established to
supply local heating systems of small cities. Simultaneously industrial CHP units have been
installed. This concept has been followed until today resulting in a high share of dispersed
installed capacity, which is not as a matter of course available for power regulation and
thus, does not contribute to system balance.
The distributed CHP-units' range in size is from a few kW up to 100 MW. Most of these
units are gas turbines or gas engines. Traditionally the power production from these units
depends on the heat demand, thus heat and electricity are strongly coupled. To eliminate
this dependence, these units are equipped with heat storage tanks.
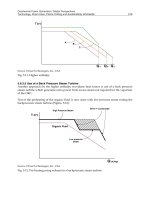
Most of the large thermal units are coal-fired CHP units that can extract steam for heat
production. These units have an operating domain between 20 % and full power load
without heat production. However, the operating domain for the power depends on the
heat production - with higher heat production the minimum power load increases and the
maximum power load decreases. According to the power station specifications [19], these
thermal units have a regulating capability of 4 % of full load/minute in the operating
domain from 50-90% and 2 % of full load/minute below 50 % and above 90 % load. Besides
the normal regulating capabilities these units can disconnect the heat production and, for a
short period, utilize the extracted steam for electricity generation.
Increasing security problems have led to a reconsideration of the traditional high degree of
independence between TSOs and DSOs (distribution system operators).
A new control strategy shall include all local grids with DG into new responsibilities, such as
control of reactive power, provision of data for security analyses, supervision of protection
schemes at local CHP plants, updating under-frequency load shedding schemes and new
restoration plans, including controlling dead start of local plants in emergency cases.
The implementation of such new responsibilities will require development of new control,
communication and information systems. During normal operation all functions should be
automatic. For emergency situations restoration plans have to be carefully prepared and
trained. The targets concerning the systems redesign are:
balance between supply and demand shall be ensured by sufficient available domestic
resources
operators need to have access to an improved knowledge of the actual system
conditions, both locally and centrally
efficient system control shall be available, especially during emergencies
Black start capabilities using local generators shall be provided.
Presently, Energinet.dk is executing a cell controller pilot project (CCPP) defining a
demonstration area of a real distribution network ("cell"), where a new concept
implementing new communication systems and a new controller shall be implemented and
tested according to the following ambitions[20]:
in case of a regional emergency situation reaching the point of no return, the cell shall
disconnect itself from the high voltage grid and transfer to island operation
after a total system collapse, the cell has black-start ability to a state of island operation.
The CCPP aims to:
gather information about feasibility and approaches to utility-scale microgrids
develop requirements, specifications and preliminary solutions for a pilot implementation
of the cell concept
implement measurement and monitoring systems to gather and analyze data from the
pilot area
perform detailed design, development, implementation and testing of a selected pilot
cell.
8.4.4 Aspects Concerning the Energy Market
The Nordic electricity market consists of several markets: the physical day-ahead market
(Elspot), the hour-ahead (Elbas) trade and the real-time market for balance power (Figure
8.22).
The power plants find a Production Balance Responsible (PBR) to sell their energy
production. The PBR sells the production either directly to the Nord Pool spot market or
announces the capacity to Energinet.dk`s regulation power market. Energinet.dk transfers
the regulation power bids to the Nordic TSOs Nordic Operational Information System
(NOIS). In the NOIS a merit order list of the bids, visible to all TSOs, is composed. The
present regulation measures are based on this list. Regulating power prices can differ in the
event of network congestions, when several price areas have to be defined.
The residual market is a market for the production of energy that is not supplied by
prioritized renewable generation. The commercial suppliers face a decreasing power
demand leading to a decrease in the commercial production capacity’s utilization and
thereby a reduction in profit making opportunities.
Electricity Infrastructures in the Global Marketplace320
Fig. 8.22. Electricity Market Overview
8.4.4.1 SivaEl
The approach of defining the volume of the residual market is based on a fictitious west
Danish 100 % thermal system with base-load and peak-load units [21]. The system is
modeled in the simulation tool SIVAEL (simulation of heat and electricity), and the
consequences of increased installation of wind power are analyzed by means of model
simulations. The share of wind power is gradually increased from 0 % to 100 % coverage of
the annual energy consumption. Two types of units are used: coal-fired base-load units and
natural gas-fired gas turbines as peak-load units. Two assumptions are made; namely, base-
load units are preferable when utilization times exceed 2,000 hours, whereas peak-load units
are more profitable when utilization times are less than 2,000 hours. As for the calculations,
the number of units and their distribution on base load or peak load are adjusted
exogenously in the model in such a way that this criterion is observed.
A 100 % thermal west Danish system in 2025 with an annual consumption of about 26 TWh
has been chosen as a basis in order to be able to relate the calculation results to something
well known. Combined heat and power and international connections have been
disregarded to maintain simplicity and generality – this means that the system must be able
to make adjustments for variations in consumption and wind-power production.
The expansion of wind power is assumed to increase onshore and offshore in parallel. A
maximum production of some 6 TWh onshore is assumed. Offshore, wind power
production is some 20 TWh in the case of 100% share of wind power. Wind power
production is included in the model as a time series based on wind-speed measurements
offshore near Horns Rev and the island of Læsø and on wind-power production
measurements from onshore wind turbines in Jutland and on Funen as well as from the
offshore wind farm at Horns Rev.
SIVAEL solves the week-plan problem on an hourly basis and finds the optimum load
dispatch with regard to start-stop, overhauls and outages. The optimum load occurs when
the total variable costs are at a minimum.
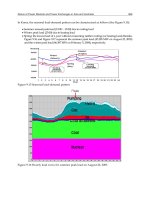
Figure 8.23 shows the wind energy production, the share that can be sold immediately and
the surplus electricity. It shows that the system can absorb about 30% of the wind power
with no surplus electricity. On the other hand, the surplus grows substantially when the
share of wind power is more than approximately 50%.
Following this idea, there will be two different residual markets: one for demand and one
for overflow. The SIVAEL-Model is calculated for a share of 100 % wind power with a
residual energy consumption of 8 TWh / year and a surplus energy of 8 TWh / year, thus
the resulting residual market has an energy volume of 16 TWh and a capacity differential of
about 9,000 MW. (Comparison: For a pure thermal system the volume of the electric energy
market equals 26 TWh and the demand for capacity about 4,500 MW.)
In the future this business area can be cultivated by market players, e.g. by means of
developing new products.
Fig. 8.23. Wind Power Production on an Annual Basis (TWh/year), the Share of Wind
Power that Can Be Sold for the Assumed Consumption (TWh/year) and the Remaining
Surplus
8.4.4.2 Demand response
The increasing share of wind energy has resulted in an increasing need for balance tools,
which also may be located on the demand side. Demand response is defined as a short-term
change in electricity consumption as a reaction to a market price signal [22]. The Nordel
study [23].identifies demand response as both an alternative and a prerequisite for
investments into new production capacity and recommends that all Nordic TSOs prepare
action plans for developing demand response.
Europe: Impact of Dispersed and Renewable Generation on Power System Structure 321
Fig. 8.22. Electricity Market Overview
8.4.4.1 SivaEl
The approach of defining the volume of the residual market is based on a fictitious west
Danish 100 % thermal system with base-load and peak-load units [21]. The system is
modeled in the simulation tool SIVAEL (simulation of heat and electricity), and the
consequences of increased installation of wind power are analyzed by means of model
simulations. The share of wind power is gradually increased from 0 % to 100 % coverage of
the annual energy consumption. Two types of units are used: coal-fired base-load units and
natural gas-fired gas turbines as peak-load units. Two assumptions are made; namely, base-
load units are preferable when utilization times exceed 2,000 hours, whereas peak-load units
are more profitable when utilization times are less than 2,000 hours. As for the calculations,
the number of units and their distribution on base load or peak load are adjusted
exogenously in the model in such a way that this criterion is observed.
A 100 % thermal west Danish system in 2025 with an annual consumption of about 26 TWh
has been chosen as a basis in order to be able to relate the calculation results to something
well known. Combined heat and power and international connections have been
disregarded to maintain simplicity and generality – this means that the system must be able
to make adjustments for variations in consumption and wind-power production.
The expansion of wind power is assumed to increase onshore and offshore in parallel. A
maximum production of some 6 TWh onshore is assumed. Offshore, wind power
production is some 20 TWh in the case of 100% share of wind power. Wind power
production is included in the model as a time series based on wind-speed measurements
offshore near Horns Rev and the island of Læsø and on wind-power production
measurements from onshore wind turbines in Jutland and on Funen as well as from the
offshore wind farm at Horns Rev.
SIVAEL solves the week-plan problem on an hourly basis and finds the optimum load
dispatch with regard to start-stop, overhauls and outages. The optimum load occurs when
the total variable costs are at a minimum.
Figure 8.23 shows the wind energy production, the share that can be sold immediately and
the surplus electricity. It shows that the system can absorb about 30% of the wind power
with no surplus electricity. On the other hand, the surplus grows substantially when the
share of wind power is more than approximately 50%.
Following this idea, there will be two different residual markets: one for demand and one
for overflow. The SIVAEL-Model is calculated for a share of 100 % wind power with a
residual energy consumption of 8 TWh / year and a surplus energy of 8 TWh / year, thus
the resulting residual market has an energy volume of 16 TWh and a capacity differential of
about 9,000 MW. (Comparison: For a pure thermal system the volume of the electric energy
market equals 26 TWh and the demand for capacity about 4,500 MW.)
In the future this business area can be cultivated by market players, e.g. by means of
developing new products.
Fig. 8.23. Wind Power Production on an Annual Basis (TWh/year), the Share of Wind
Power that Can Be Sold for the Assumed Consumption (TWh/year) and the Remaining
Surplus
8.4.4.2 Demand response
The increasing share of wind energy has resulted in an increasing need for balance tools,
which also may be located on the demand side. Demand response is defined as a short-term
change in electricity consumption as a reaction to a market price signal [22]. The Nordel
study [23].identifies demand response as both an alternative and a prerequisite for
investments into new production capacity and recommends that all Nordic TSOs prepare
action plans for developing demand response.
Electricity Infrastructures in the Global Marketplace322
The TSO is responsible for maintaining the instantaneous balance between supply and
demand for each control area. The TSO agrees with the supplier on the amount of power
that has to be available at a certain time. If the reserve is activated it is financially
compensated for according to the supplier’s bid. Sometimes energy is very cheap - even free
(Figure 8.24). It would be valuable to use this cheap energy rather than activating reserve
energy that has to be paid for and simultaneously exporting the wind energy.
A further expansion of wind power capacity makes only sense if consumption is increased
accordingly or thermal production can be reduced. Demand response manual reserves can
be activated by suppliers or consumers, whereas up regulation means interrupted
consumption and down regulation means extra consumption. If there is an unbalance in the
system, either the production can be increased or the consumption decreased or vice versa -
depending on the kind of unbalance. The smallest bid is 10 MW, and the price for being
available as reserve power for the system operator can be between 27,000 EUR/MW/year
and 67,000 EUR/MW/year for up regulation power and up to 20,000 EUR/MW/year for
down regulation power. Thus, not only supply, but also electricity consumption should
follow price signals. The former philosophy of influencing consumer behavior by means of
time-tariffs or campaigns is substituted by new market products, which illustrate the market
value of consumers` reaction and capitalize market gains. The system operator acts as a
catalyst promoting the consumers` price flexibility. By this means utilization of cheap wind
energy instead of valuable coal or oil shall be achieved. During Energinet.dk`s
demonstration projects, for some big customers like such as an iron foundry, it has turned
out to be economically efficient to install a parallel electricity based consumption system
which is used during times of extremely low prices for wind energy.
Fig. 8.24. Energy Prices in Denmark, Norway and at the EEX
In Denmark there is also a large technical potential for increased electricity consumption in
district heating systems to substitute fossil fuels during periods of heavy wind production.
Consequently, the substitution of primary resources is obtained and investments in non-
economic peak load units can be avoided. The respective change of consumer behavior can
be: moving the time of consumption to periods with lower prices; reducing or stopping
consumption during periods when consumer benefit from using electricity does not exceed
the price (possibly by means of substitution to another energy source); or increasing the
consumption during times when the electricity price is lower than the marginal utility and
the price of another energy source, e.g. during times of high wind production. This measure
results in a smaller slope of the demand curve where, due to limited demand response, there
may sometimes be no market clearing point found (Figure 8.25). An action plan has been
made including 22 specific initiatives aiming at the development of demand response in the
electricity market and all Nordic TSOs are cooperating on this topic [24].
Fig. 8.25. Supply and Demand Curve for Different Elasticity Coefficients due to Grade of
Demand Response
In summary, Section 8.4 has highlighted that the Danish system is facing various difficulties
on several levels: Technically, a high share of dispersed generation challenges the
transmission system operator who is responsible for reliability and security of supply and
constantly has to balance supply and demand. This is additionally complicated by high
transits passing through the system. Interconnections to neighboring countries are essential
for the functioning of the system, and a further expansion of the network as well as the
interconnections has to be planned carefully.
Referring to market requirements the Danish transmission system operator, being situated
in two synchronous areas operating with different schedules, has to adapt to both systems
and use the opportunities of the market to improve the national power balance situation by
means of the real time market.
Europe: Impact of Dispersed and Renewable Generation on Power System Structure 323
The TSO is responsible for maintaining the instantaneous balance between supply and
demand for each control area. The TSO agrees with the supplier on the amount of power
that has to be available at a certain time. If the reserve is activated it is financially
compensated for according to the supplier’s bid. Sometimes energy is very cheap - even free
(Figure 8.24). It would be valuable to use this cheap energy rather than activating reserve
energy that has to be paid for and simultaneously exporting the wind energy.
A further expansion of wind power capacity makes only sense if consumption is increased
accordingly or thermal production can be reduced. Demand response manual reserves can
be activated by suppliers or consumers, whereas up regulation means interrupted
consumption and down regulation means extra consumption. If there is an unbalance in the
system, either the production can be increased or the consumption decreased or vice versa -
depending on the kind of unbalance. The smallest bid is 10 MW, and the price for being
available as reserve power for the system operator can be between 27,000 EUR/MW/year
and 67,000 EUR/MW/year for up regulation power and up to 20,000 EUR/MW/year for
down regulation power. Thus, not only supply, but also electricity consumption should
follow price signals. The former philosophy of influencing consumer behavior by means of
time-tariffs or campaigns is substituted by new market products, which illustrate the market
value of consumers` reaction and capitalize market gains. The system operator acts as a
catalyst promoting the consumers` price flexibility. By this means utilization of cheap wind
energy instead of valuable coal or oil shall be achieved. During Energinet.dk`s
demonstration projects, for some big customers like such as an iron foundry, it has turned
out to be economically efficient to install a parallel electricity based consumption system
which is used during times of extremely low prices for wind energy.
Fig. 8.24. Energy Prices in Denmark, Norway and at the EEX
In Denmark there is also a large technical potential for increased electricity consumption in
district heating systems to substitute fossil fuels during periods of heavy wind production.
Consequently, the substitution of primary resources is obtained and investments in non-
economic peak load units can be avoided. The respective change of consumer behavior can
be: moving the time of consumption to periods with lower prices; reducing or stopping
consumption during periods when consumer benefit from using electricity does not exceed
the price (possibly by means of substitution to another energy source); or increasing the
consumption during times when the electricity price is lower than the marginal utility and
the price of another energy source, e.g. during times of high wind production. This measure
results in a smaller slope of the demand curve where, due to limited demand response, there
may sometimes be no market clearing point found (Figure 8.25). An action plan has been
made including 22 specific initiatives aiming at the development of demand response in the
electricity market and all Nordic TSOs are cooperating on this topic [24].
Fig. 8.25. Supply and Demand Curve for Different Elasticity Coefficients due to Grade of
Demand Response
In summary, Section 8.4 has highlighted that the Danish system is facing various difficulties
on several levels: Technically, a high share of dispersed generation challenges the
transmission system operator who is responsible for reliability and security of supply and
constantly has to balance supply and demand. This is additionally complicated by high
transits passing through the system. Interconnections to neighboring countries are essential
for the functioning of the system, and a further expansion of the network as well as the
interconnections has to be planned carefully.
Referring to market requirements the Danish transmission system operator, being situated
in two synchronous areas operating with different schedules, has to adapt to both systems
and use the opportunities of the market to improve the national power balance situation by
means of the real time market.
Electricity Infrastructures in the Global Marketplace324
In Denmark a further wind energy expansion is expected, but it has been decided, that there
will be a maximum limit for the price at which energy can be sold. Consequently, the future
role of small-scale CHP units has to be newly defined aiming at better utilization through
operation on market terms.
Also, the use of electricity is being re-discussed. A demand response project illustrated the
potential of integrating the consumer into the well functioning of the market. For example,
in times of high wind production it can be economically efficient to use electricity for district
heating systems by using heat pumps or heat boilers.
8.5 Further Reading
Further reading on integrating dispersed renewable generation sources into European Grids
is given in References [25].
8.6 Acknowledgement
This Chapter has been prepared by Zbigniew A. Styczynski (Head and Chair of Electric
Power Networks and Renewable Energy Sources, Otto-von-Guericke University,
Magdeburg, Germany and President, Center of Renewable Energy Saxonia Anhalt,
Germany). Contributors include Johan Driesen and Ronnie Belmans (KU Leuven, Leuven,
Belgium), Bernd Michael Buchholz (Director, PTD Services, Power Technologies, Siemens
AG, Erlangen, Germany), Thomas J. Hammons (Chair International Practices for Energy
Developments and Power Generation IEEE, University of Glasgow, UK), and Peter B.
Eriksen, Antje G. Orths and Vladislav Akhmatov (Analysis and Methods, Energinet.dk,
Fjordvejen, Fredericia, Denmark)
8.7 References
[1] IEA, Distributed Generation in Liberalised Electricity Markets, Paris, 128 pages, 2002.
[2] Eto J., Koomey J., Lehman B., Martin N., “Scoping Study on Trends in the Economic
Value of Electricity Reliability to the US Economy,” LBLN-47911, Berkeley,2001, 134
pages.
[3] Renner H., Fickert L., 1999. Costs and responsibility of power quality in the deregulated
electricity market, Graz.
[4] Dondi P., Bayoumi D., Haederli C., Julian D., Suter M., “Network integration of
distributed power generation,” Journal of Power Sources, 106, 2002, pp.1–9.
[5] Woyte A., De Brabandere K., Van Dommelen D., Belmans R., Nijs J, “International
harmonisation of grid connection guidelines: adequate requirements for the
prevention of unintentional islanding,” Progress in Photovoltaics: Research
Applications, 2003, Vol.11, No.6, pp.407-424.
[6] Gatta F.M., Iliceto F., Lauria S. Masato P. “Behaviour of dispersed generation in
distribution networks during system disturbances. Measures to prevent
disconnection,” Proceedings CIRED 2003, Barcelona, 12-15 May 2003.
[7] Ackermann T., Andersson G., Soder L., “Distributed generation: a definition,” Electric
Power Systems Research, 57, 2001, 195–204.
[8] CIRED, 1999: Dispersed generation, Preliminary report of CIRED working group WG04,
June, p. 9+Appendix (p.30).
[9] Jenkins N., Allan R., Crossley P., Kirschen D., Strbac G., Embedded Generation, The
Institute of Electrical Engineers, London, 2000
[10] B. Buchholz a.o. Advanced planning and operation of dispersed generation ensuring
power quality, security and efficiency in distribution systems. CIGRE 2004, Paris,
29.August - 3.September 2004
[11] J. Scholtes, C. Schwaegerl. Energy Park KonWerl. Energy management of a
decentralized Supply system. Concept and First results. First international
conference on the integration of Renewable energy sources and Distributed energy
resources. Brussels, 1 3. December 2004
[12] IEC 61850 Part 1-10. Communication networks and systems in substations
[13] IEC 612400-25-2. Wind Turbines. Communication for monitoring and control of wind
turbines. Part 25-2. Information models. IEC 88/214/CD
[14] IEC 62350. Communication systems for distributed energy resources. IEC 57/750/CD
[15] Bumiller, G., Sauter, T., Pratl, G. Treydl, A. Secure and reliable wide area power line
communication for soft real- time applications within REMPLI. 2005 International
Symposium on Power Line Communications and its Applications, Vancouver,
April 6-8 2005
[16] V. Akhmatov; H. Abildgaard; J. Pedersen; P. B. Eriksen: "Integration of Offshore Wind
Power into the Western Danish Power System" in Proc. 2005 Copenhagen Offshore
Wind International conference and Exhibition, October 2005, Copenhagen,
Denmark.
[17] Specifications TF 3.2.5, "Connection Requirements for Wind Turbines connected to
voltages over 100 kV" (in Danish) Available: .
[18] P. B. Eriksen; Th. Ackermann; H. Abildgaard et. al.: "System Operation with High
Wind Penetration", IEEE Power and Energy Magazine, vol 3 No. 5, pp 65-74, Nov.
2005.
[19] Power Station Specifications for Plants > 50 MW, Elsam, Denmark, SP92-230j, 16 pages
+ 3 pg annex, August 1998; Kraftværskspecifikationer for produktionsanlæg
mellem 2 og 50 MW: Elsam, Denmark, SP92-017a, 16 sider + 5 sider bilag,
september 1995 (in Danish).
[20] P. Lund, S. Cherian, T. Ackermann: "A Cell Controller for Autonomous Operation of a
60 kV Distribution Area" in Proc. 10th Kasseler Symposium Energie-Systemtechnik
2005, ISET, Kassel. pp. 66-85.
[21] J. Pedersen: "System and Market Changes in a Scenario of Increased Wind Power
Production " in Proc. 2005 Copenhagen Offshore Wind International conference
and Exhibition, October 2005, Copenhagen, Denmark.
[22] K. Behnke, S. Dupont Kristensen: "Nordel - Danish Action Plan for Demand response",
Elkraft/ eltra, Nov. 2004 (intern document)
[23] ["Enhancing Efficient Functioning of the Nordic Electricity market", Nordel, Februar
2005. Available: .
[24] "Ensuring Balance between Demand and Supply in the Nordic Electricity Market",
Nordel, 2004, Available: .
[25] T. J. Hammons: “Integrating Renewable Energy Sources into European Grids”,
International Journal of Electrical Power and Energy Systems, vol. 30, (8), 2008, pp.
462-475.
Europe: Impact of Dispersed and Renewable Generation on Power System Structure 325
In Denmark a further wind energy expansion is expected, but it has been decided, that there
will be a maximum limit for the price at which energy can be sold. Consequently, the future
role of small-scale CHP units has to be newly defined aiming at better utilization through
operation on market terms.
Also, the use of electricity is being re-discussed. A demand response project illustrated the
potential of integrating the consumer into the well functioning of the market. For example,
in times of high wind production it can be economically efficient to use electricity for district
heating systems by using heat pumps or heat boilers.
8.5 Further Reading
Further reading on integrating dispersed renewable generation sources into European Grids
is given in References [25].
8.6 Acknowledgement
This Chapter has been prepared by Zbigniew A. Styczynski (Head and Chair of Electric
Power Networks and Renewable Energy Sources, Otto-von-Guericke University,
Magdeburg, Germany and President, Center of Renewable Energy Saxonia Anhalt,
Germany). Contributors include Johan Driesen and Ronnie Belmans (KU Leuven, Leuven,
Belgium), Bernd Michael Buchholz (Director, PTD Services, Power Technologies, Siemens
AG, Erlangen, Germany), Thomas J. Hammons (Chair International Practices for Energy
Developments and Power Generation IEEE, University of Glasgow, UK), and Peter B.
Eriksen, Antje G. Orths and Vladislav Akhmatov (Analysis and Methods, Energinet.dk,
Fjordvejen, Fredericia, Denmark)
8.7 References
[1] IEA, Distributed Generation in Liberalised Electricity Markets, Paris, 128 pages, 2002.
[2] Eto J., Koomey J., Lehman B., Martin N., “Scoping Study on Trends in the Economic
Value of Electricity Reliability to the US Economy,” LBLN-47911, Berkeley,2001, 134
pages.
[3] Renner H., Fickert L., 1999. Costs and responsibility of power quality in the deregulated
electricity market, Graz.
[4] Dondi P., Bayoumi D., Haederli C., Julian D., Suter M., “Network integration of
distributed power generation,” Journal of Power Sources, 106, 2002, pp.1–9.
[5] Woyte A., De Brabandere K., Van Dommelen D., Belmans R., Nijs J, “International
harmonisation of grid connection guidelines: adequate requirements for the
prevention of unintentional islanding,” Progress in Photovoltaics: Research
Applications, 2003, Vol.11, No.6, pp.407-424.
[6] Gatta F.M., Iliceto F., Lauria S. Masato P. “Behaviour of dispersed generation in
distribution networks during system disturbances. Measures to prevent
disconnection,” Proceedings CIRED 2003, Barcelona, 12-15 May 2003.
[7] Ackermann T., Andersson G., Soder L., “Distributed generation: a definition,” Electric
Power Systems Research, 57, 2001, 195–204.
[8] CIRED, 1999: Dispersed generation, Preliminary report of CIRED working group WG04,
June, p. 9+Appendix (p.30).
[9] Jenkins N., Allan R., Crossley P., Kirschen D., Strbac G., Embedded Generation, The
Institute of Electrical Engineers, London, 2000
[10] B. Buchholz a.o. Advanced planning and operation of dispersed generation ensuring
power quality, security and efficiency in distribution systems. CIGRE 2004, Paris,
29.August - 3.September 2004
[11] J. Scholtes, C. Schwaegerl. Energy Park KonWerl. Energy management of a
decentralized Supply system. Concept and First results. First international
conference on the integration of Renewable energy sources and Distributed energy
resources. Brussels, 1 3. December 2004
[12] IEC 61850 Part 1-10. Communication networks and systems in substations
[13] IEC 612400-25-2. Wind Turbines. Communication for monitoring and control of wind
turbines. Part 25-2. Information models. IEC 88/214/CD
[14] IEC 62350. Communication systems for distributed energy resources. IEC 57/750/CD
[15] Bumiller, G., Sauter, T., Pratl, G. Treydl, A. Secure and reliable wide area power line
communication for soft real- time applications within REMPLI. 2005 International
Symposium on Power Line Communications and its Applications, Vancouver,
April 6-8 2005
[16] V. Akhmatov; H. Abildgaard; J. Pedersen; P. B. Eriksen: "Integration of Offshore Wind
Power into the Western Danish Power System" in Proc. 2005 Copenhagen Offshore
Wind International conference and Exhibition, October 2005, Copenhagen,
Denmark.
[17] Specifications TF 3.2.5, "Connection Requirements for Wind Turbines connected to
voltages over 100 kV" (in Danish) Available: .
[18] P. B. Eriksen; Th. Ackermann; H. Abildgaard et. al.: "System Operation with High
Wind Penetration", IEEE Power and Energy Magazine, vol 3 No. 5, pp 65-74, Nov.
2005.
[19] Power Station Specifications for Plants > 50 MW, Elsam, Denmark, SP92-230j, 16 pages
+ 3 pg annex, August 1998; Kraftværskspecifikationer for produktionsanlæg
mellem 2 og 50 MW: Elsam, Denmark, SP92-017a, 16 sider + 5 sider bilag,
september 1995 (in Danish).
[20] P. Lund, S. Cherian, T. Ackermann: "A Cell Controller for Autonomous Operation of a
60 kV Distribution Area" in Proc. 10th Kasseler Symposium Energie-Systemtechnik
2005, ISET, Kassel. pp. 66-85.
[21] J. Pedersen: "System and Market Changes in a Scenario of Increased Wind Power
Production " in Proc. 2005 Copenhagen Offshore Wind International conference
and Exhibition, October 2005, Copenhagen, Denmark.
[22] K. Behnke, S. Dupont Kristensen: "Nordel - Danish Action Plan for Demand response",
Elkraft/ eltra, Nov. 2004 (intern document)
[23] ["Enhancing Efficient Functioning of the Nordic Electricity market", Nordel, Februar
2005. Available: .
[24] "Ensuring Balance between Demand and Supply in the Nordic Electricity Market",
Nordel, 2004, Available: .
[25] T. J. Hammons: “Integrating Renewable Energy Sources into European Grids”,
International Journal of Electrical Power and Energy Systems, vol. 30, (8), 2008, pp.
462-475.
Electricity Infrastructures in the Global Marketplace326
Status of Power Markets and Power Exchanges in Asia and Australia 327
Status of Power Markets and Power Exchanges in Asia and Australia
Author Name
X
Status of Power Markets and Power
Exchanges in Asia and Australia
Integration of electric power systems and power exchanges among countries, regions and
companies is an objective tendency in world power industry development. The Asian region
is rather promising in this respect since the sources of energy resources for electricity pro-
duction are often very remote from the load centers. Besides, there are the so-called system
effects from electric power systems integration that are beneficial for all the participants. The
role of power exchanges increases still further under deregulated electricity markets particu-
larly in terms of the possibilities to decrease the market prices of electricity.
The following viewpoints are discussed in this Chapter:
Ideas of the different countries in Asia and Oceania of either the positive or negative
role of power exchanges in a market environment;
Estimations of potential limits in the power exchanges and substantiation of such limits
if there are any;
Concrete results of the studies on power exchanges in the feasibility studies of prospec-
tive projects of power exchanges.
9.1 Status of Reform and Power Exchange in India: Trading, Scheduling,
and Real Time Operation Regional Grids
Though India opened up its power sector in nineties to private sector investment, initial
impact was mainly in the form of generation addition and then with unbundling of genera-
tion, transmission and distribution, to some extent on the last segment also. Transmission as
natural monopoly remains still under government-owned companies, both at central and
state level, though right at the beginning of 1998 specifically it was opened to private enter-
prises to build, own and operate from point to point. With the open access in inter-state
transmission to any distribution company, trader, generating company, captive plant or any
permitted consumer as per November 2003 order
1
of Central Electricity Regulatory Com-
mission (CERC) certain changes are, however, taking place. Under such circumstance
changes in methodology of generation scheduling to meet demand are also inevitable to
take into account this very aspect from time to time considering role of various participants
in power market. However, at the same time aspect of system security vis-à-vis stability is
given due importance in real time grid operation, as envisaged also under Electricity Act
2003
2
.
9
Electricity Infrastructures in the Global Marketplace328
9.1.1 Development of Indian Power System
3,4
India has a federal structure with 28 States, 7 Union Territories and a Central Govt. Present
installed capacity of India is 112 GW with 25% of hydro besides nuclear, gas, wind and con-
ventional thermal plants. For the purpose of power system, the country was demarcated
into five geo-political regions in the year 1964 and gradually different states within the re-
gion got integrated and by the 1980s five mature regional grids were under operation. In
1992 Eastern and Northeastern regions were interconnected. In 2002 the Northeast, East and
West with a span of 2800 km. of synchronous grid became operational. There are four
HVDC Back–to–Back stations of 500 / 1000 MW capacity each and three Bi-pole HVDC long
lines for carrying bulk power. Indian power system also has multiple connections at differ-
ent voltage levels with neighboring countries, like, Nepal and Bhutan. Cross border power
exchanges are progressively increasing. There is wealth of experience regarding expansion
of the grids and experience of operating large grids.
Resources are unevenly spread with hydrocarbon deposits in the East and Central parts of
India and huge hydro potential in the Northeastern and Northern part of the Northern Grid.
There is a promising availability of gas on the long coastal lines. The load growth has also
been uneven with widely varying per capita income in different states. This calls for transfer
of large blocks of power over long distances.
Central Electricity Authority, a statutory organization produces the national plans. Inte-
grated resource planning approach is adopted. Transmission system expansion is coordi-
nated for achieving a most optimal plan with least investment. Perspective plan and the
long-term forecasting are also carried out by the Authority.
The Legislations on Electricity in India traversed a long distance and all the old act since1910
onwards have been merged and recast in the form of a consolidated Electricity Act 2003.
Indian Electricity Grid Code (IEGC) and the State Electricity Grid Code (SEGC) are in place
after public debate. The Regulators, Authorities and the state utilities are framing rules and
Regulations. The Central Electricity Authority is developing metering codes.
Indian Electricity Act 2003 envisages Electricity Regulators at State level (State Electricity
Regulatory Commission, SERC) to take care of intra-state affairs while the Central regulator
(Central Electricity Regulatory Commission, CERC) to take care of inter-state matters. The
tariffs, codes and directions on Open Access are now being issued by the Regulators in a fair
and transparent way and the Government is distancing itself.
Transmission has been recognized as a separate activity in 1998 by the legislation. In line
with the federal structure the Central Transmission Utility (CTU, at present Power Grid
Corporation of India) and the State Transmission Utilities (STU, at present Transmission /
Grid Company TRANCO or GRIDCO of the concerned state) have been created for coordi-
nated development of the transmission segment. Transmission being a natural monopoly is
a regulated entity and barred from trading as per the law. Transmission system in India has
developed from 132/220 kV and now well-meshed 400 kV mature grid forms the backbone
of Indian Grid. A rapid development is envisaged by the year 2012 matching with load
growth and generation addition of 100,000 MW.
By and large the GENCO (Generating Company), TRANSCO and DISCO (Distribution
Company), STU, CTU, SLDCs (State Load Dispatch Centers), RLDCs (Regional Load Dis-
patch Centers) and CERC structure has been followed while progressing with reforms and
unbundling. There are variations in the models being adopted by different states. Some of
the states have already privatized their distribution systems.
The Indian sub-continent with its vast geographical distances and diverse resources is
struggling to achieve cost reduction through ‘Economy of Scale’. The large size generators of
660 MW are being added as 500 MW sets have already stabilized and are dominating pre-
sently. For transferring large blocks of power, 765 kV transmission system has been envi-
saged overlaying 400 kV meshed network.
Private participation in generation by way of IPPs (Independent Power Producers) and
Mega Power Projects supplemented with Government investment is envisaged. So far the
transmission has been through the State / Central Government companies. Joint venture
and IPTC (Independent Power Transmission Company) route have also been launched to
attract private investment in the transmission segment. With unbundling and demarcated
distribution companies, niche market is being created for private participants to enter into
the field of Distribution. With Open Access, investment in captive power plants is likely to
get a boost, as they would have access to enter the Indian power market.
765 kV transmission systems connecting the regions and the resource-rich areas and load
centers would form a super highway for wheeling of power from source to sink. A massive
capacity addition plan of 50,000 MW of hydro and 100,000 MW of thermal power has been
launched and expected to yield result by the year 2012.
The variety of diversities between the different regions of India and its neighboring coun-
tries open a vast potential for coordinated expansion and operation to take care of time, sea-
son and resource diversity prevailing in the sub-continent. It would also enable to level the
diversity caused by various uncertainties, like, investment, load growth, etc.
9.1.2 Grid Operation
The Indian Electricity Grid Code (IEGC) lays down rules, guidelines and standards to be
followed by the various participants in the system to plan, develop, maintain and operate
the power system in the most efficient, reliable and economic manner while facilitating
healthy competition in the generation and supply of electricity. The IEGC covers roles of
different organizations and their linkages, planning codes, connection conditions, operating
codes, scheduling and dispatch codes, metering and management of the grid code.
The regional grids in India are operating as loose power pools in which the constituents
have full autonomy and have the total responsibility for scheduling and dispatching their
own resources, arranging any bilateral inter-change and regulating their drawl from the
regional grid.
The Regional Load Dispatch Centers coordinate the entire activity of day-ahead scheduling.
For the purpose of scheduling and settlement a day is divided into 96 blocks of 15 minutes
Status of Power Markets and Power Exchanges in Asia and Australia 329
9.1.1 Development of Indian Power System
3,4
India has a federal structure with 28 States, 7 Union Territories and a Central Govt. Present
installed capacity of India is 112 GW with 25% of hydro besides nuclear, gas, wind and con-
ventional thermal plants. For the purpose of power system, the country was demarcated
into five geo-political regions in the year 1964 and gradually different states within the re-
gion got integrated and by the 1980s five mature regional grids were under operation. In
1992 Eastern and Northeastern regions were interconnected. In 2002 the Northeast, East and
West with a span of 2800 km. of synchronous grid became operational. There are four
HVDC Back–to–Back stations of 500 / 1000 MW capacity each and three Bi-pole HVDC long
lines for carrying bulk power. Indian power system also has multiple connections at differ-
ent voltage levels with neighboring countries, like, Nepal and Bhutan. Cross border power
exchanges are progressively increasing. There is wealth of experience regarding expansion
of the grids and experience of operating large grids.
Resources are unevenly spread with hydrocarbon deposits in the East and Central parts of
India and huge hydro potential in the Northeastern and Northern part of the Northern Grid.
There is a promising availability of gas on the long coastal lines. The load growth has also
been uneven with widely varying per capita income in different states. This calls for transfer
of large blocks of power over long distances.
Central Electricity Authority, a statutory organization produces the national plans. Inte-
grated resource planning approach is adopted. Transmission system expansion is coordi-
nated for achieving a most optimal plan with least investment. Perspective plan and the
long-term forecasting are also carried out by the Authority.
The Legislations on Electricity in India traversed a long distance and all the old act since1910
onwards have been merged and recast in the form of a consolidated Electricity Act 2003.
Indian Electricity Grid Code (IEGC) and the State Electricity Grid Code (SEGC) are in place
after public debate. The Regulators, Authorities and the state utilities are framing rules and
Regulations. The Central Electricity Authority is developing metering codes.
Indian Electricity Act 2003 envisages Electricity Regulators at State level (State Electricity
Regulatory Commission, SERC) to take care of intra-state affairs while the Central regulator
(Central Electricity Regulatory Commission, CERC) to take care of inter-state matters. The
tariffs, codes and directions on Open Access are now being issued by the Regulators in a fair
and transparent way and the Government is distancing itself.
Transmission has been recognized as a separate activity in 1998 by the legislation. In line
with the federal structure the Central Transmission Utility (CTU, at present Power Grid
Corporation of India) and the State Transmission Utilities (STU, at present Transmission /
Grid Company TRANCO or GRIDCO of the concerned state) have been created for coordi-
nated development of the transmission segment. Transmission being a natural monopoly is
a regulated entity and barred from trading as per the law. Transmission system in India has
developed from 132/220 kV and now well-meshed 400 kV mature grid forms the backbone
of Indian Grid. A rapid development is envisaged by the year 2012 matching with load
growth and generation addition of 100,000 MW.
By and large the GENCO (Generating Company), TRANSCO and DISCO (Distribution
Company), STU, CTU, SLDCs (State Load Dispatch Centers), RLDCs (Regional Load Dis-
patch Centers) and CERC structure has been followed while progressing with reforms and
unbundling. There are variations in the models being adopted by different states. Some of
the states have already privatized their distribution systems.
The Indian sub-continent with its vast geographical distances and diverse resources is
struggling to achieve cost reduction through ‘Economy of Scale’. The large size generators of
660 MW are being added as 500 MW sets have already stabilized and are dominating pre-
sently. For transferring large blocks of power, 765 kV transmission system has been envi-
saged overlaying 400 kV meshed network.
Private participation in generation by way of IPPs (Independent Power Producers) and
Mega Power Projects supplemented with Government investment is envisaged. So far the
transmission has been through the State / Central Government companies. Joint venture
and IPTC (Independent Power Transmission Company) route have also been launched to
attract private investment in the transmission segment. With unbundling and demarcated
distribution companies, niche market is being created for private participants to enter into
the field of Distribution. With Open Access, investment in captive power plants is likely to
get a boost, as they would have access to enter the Indian power market.
765 kV transmission systems connecting the regions and the resource-rich areas and load
centers would form a super highway for wheeling of power from source to sink. A massive
capacity addition plan of 50,000 MW of hydro and 100,000 MW of thermal power has been
launched and expected to yield result by the year 2012.
The variety of diversities between the different regions of India and its neighboring coun-
tries open a vast potential for coordinated expansion and operation to take care of time, sea-
son and resource diversity prevailing in the sub-continent. It would also enable to level the
diversity caused by various uncertainties, like, investment, load growth, etc.
9.1.2 Grid Operation
The Indian Electricity Grid Code (IEGC) lays down rules, guidelines and standards to be
followed by the various participants in the system to plan, develop, maintain and operate
the power system in the most efficient, reliable and economic manner while facilitating
healthy competition in the generation and supply of electricity. The IEGC covers roles of
different organizations and their linkages, planning codes, connection conditions, operating
codes, scheduling and dispatch codes, metering and management of the grid code.
The regional grids in India are operating as loose power pools in which the constituents
have full autonomy and have the total responsibility for scheduling and dispatching their
own resources, arranging any bilateral inter-change and regulating their drawl from the
regional grid.
The Regional Load Dispatch Centers coordinate the entire activity of day-ahead scheduling.
For the purpose of scheduling and settlement a day is divided into 96 blocks of 15 minutes
Electricity Infrastructures in the Global Marketplace330
each. The shared generation resources declare their availability and RLDCs communicate
the entitlement to all the stakeholders. Based on the load-generation availability and eco-
nomics, all the constituents furnish their requisition from the shared resources that are ag-
gregated by the RLDCs and communicated to the shared generators. These are based on the
long-term contracts and allocation normally done by the Central Government in consulta-
tion with the State Governments.
On day-to-day basis the utilities enter into bilateral agreements of different kinds. The
SLDCs and RLDCs incorporate the same in the schedule provided there is no network con-
gestion. In case of congestion the same are moderated by the SLDCs / RLDCs. There is an
elaborate time line for the scheduling and dispatch procedure. Provisions also exist for re-
vising and modifying the schedules by any of the participant in case of contingency for
which at least six time blocks, i.e., one and a half hour notice is required. The scheduling is
carried out through a web-based scheduler and all the revisions are posted on the web in a
transparent way. At the end of the day the final schedule becomes the datum for calculation
of ‘Unscheduled Interchange’ as well as payment of energy charges. In other words the
schedules are Commitments / Contracts and payment of energy is decided and finalized
based on the finally implemented schedules.
At present there are few Traders licensed to operate in the Inter-state Trading. Traders are
given different categories of license depending on the volume of transactions and the Regu-
latory Commission assesses the financial capacity and other parameters of the Traders be-
fore issuance of license. Traders are to file the periodic Returns to the Regulator furnishing
the details of the transactions.
The Open Access Regulations stipulated by the Commission and the Procedures framed by
the Central Transmission Utility is followed by the Open Access customers, which are pri-
marily the Traders. The Open Access Regulations enacted in 2003 are undergoing speedy
refinements based on the experience of various stakeholders including the Operators. The
volume of trading has grown phenomenally and huge number of transactions has already
taken place.
Load Dispatch Centers have been declared as an apex body both at the State level and at
Regional level, i.e., SLDCs and RLDCs. The National Load Dispatch Center (NLDC) has also
been conceived to take care of inter-regional and cross boarder exchanges. Load Dispatch
Centers are also barred from trading activity and are ‘no profit no loss’ centers with fees and
charges being determined by the Regulators. Since both transmission and system operation
are neutral to the market and barred from trading activity, at present Indian power system
is having synergy with transmission and Grid operation. The Load Dispatch Centers both at
Regional and State levels have been upgraded with state-of-the-art technology.
Each region acts as a pool. Control areas are demarcated with each state and shared genera-
tors being separate entity and there are many participants in the pool. After much debate
and in consonance with the federal structure, India has opted for loose power pool and de-
centralized market.
The settlement system has undergone drastic evolution in recent years. A new scientific set-
tlement system popularly known as ‘Availability Based Tariff’ (ABT) has been introduced in
all the five regions in the country in a staggered fashion. The new mechanism has three
parts, viz. capacity charges linked to the availability of the generation, scheduled energy
charges based on the requisition and the schedules by the control areas.
The unique and the third component is termed as ‘Unscheduled Interchange’ (UI), which is
deviation from the schedule and its pricing is linked to frequency. The UI mechanism has a
self-healing property, brings in equilibrium and emulates all the properties of ‘Non-
Cooperation Game Theory’ automatically. The mechanism while causing economy also
complements reliability, yet maintaining the sovereignty of the utilities giving choice and
freedom.
Besides long-term (25 years) and short-term day-ahead, spot / balancing market by way of
UI mechanism where the prices are linked to the frequency has been created. The spot prices
are linked to frequency that is said to be collectively controlled and effectively stabilized. It
does not require elaborate calculations. Regulators tinker the UI vector from time to time in
order to achieve economy and reliability by creating a pseudo competitor.
Unlike other Pools the Pricing Mechanism of Unscheduled Interchange, i.e., Schedule minus
Actual is linked to frequency. The Central Regulator after public hearing and debate notifies
the UI price curve. The slope of the curve, kinks, upper and lower ceilings are arrived at by
the Regulator with a view to cause overall economy as well as quality in the grid.
The fundamental theory of equilibrium and the negative feedback has been adopted while
deciding the UI price curve. As UI price is linked to frequency and as it is known that fre-
quency deviations represent surplus and shortage situation, accordingly the UI price varies
with real-time shortage or surplus. In other words, as the surplus emerges, frequency rises
and the UI price starts coming down. Similarly, with shortage the frequency starts falling
and the UI price rises. The participants in the Pool seeing the rise and fall take corrective
action that acts as a negative feedback and dampens fluctuations and system reaches equili-
brium. The beauty of the scheme is that the Pool price needs not be calculated. It is totally
transparent. The mechanism encourages ‘Merit Order Operation’ in a distributed fashion as
virtually all the generators compete with the prevailing UI price that keeps sliding.
The marked difference in the scheme expects the frequency to fluctuate in order to give a
signal to the generators to adjust their output. A distributed optimization is effected. The
mechanism is also akin to Non Co-operative Game Theory through which the best prices are
achieved. The most interesting feature is that while economy is achieved the mechanism
also compliments reliability. In UI Mechanism utilities while economically gaining also con-
tribute to reliability. This makes the approach absolutely novel.
Trading of power has been recognized as a separate, distinct licensed activity by the legisla-
tion. There are variety of products being invented by the Traders and the prices are being
discovered however with a benchmark of prevailing UI prices fixing the virtual roof and
floor.
Status of Power Markets and Power Exchanges in Asia and Australia 331
each. The shared generation resources declare their availability and RLDCs communicate
the entitlement to all the stakeholders. Based on the load-generation availability and eco-
nomics, all the constituents furnish their requisition from the shared resources that are ag-
gregated by the RLDCs and communicated to the shared generators. These are based on the
long-term contracts and allocation normally done by the Central Government in consulta-
tion with the State Governments.
On day-to-day basis the utilities enter into bilateral agreements of different kinds. The
SLDCs and RLDCs incorporate the same in the schedule provided there is no network con-
gestion. In case of congestion the same are moderated by the SLDCs / RLDCs. There is an
elaborate time line for the scheduling and dispatch procedure. Provisions also exist for re-
vising and modifying the schedules by any of the participant in case of contingency for
which at least six time blocks, i.e., one and a half hour notice is required. The scheduling is
carried out through a web-based scheduler and all the revisions are posted on the web in a
transparent way. At the end of the day the final schedule becomes the datum for calculation
of ‘Unscheduled Interchange’ as well as payment of energy charges. In other words the
schedules are Commitments / Contracts and payment of energy is decided and finalized
based on the finally implemented schedules.
At present there are few Traders licensed to operate in the Inter-state Trading. Traders are
given different categories of license depending on the volume of transactions and the Regu-
latory Commission assesses the financial capacity and other parameters of the Traders be-
fore issuance of license. Traders are to file the periodic Returns to the Regulator furnishing
the details of the transactions.
The Open Access Regulations stipulated by the Commission and the Procedures framed by
the Central Transmission Utility is followed by the Open Access customers, which are pri-
marily the Traders. The Open Access Regulations enacted in 2003 are undergoing speedy
refinements based on the experience of various stakeholders including the Operators. The
volume of trading has grown phenomenally and huge number of transactions has already
taken place.
Load Dispatch Centers have been declared as an apex body both at the State level and at
Regional level, i.e., SLDCs and RLDCs. The National Load Dispatch Center (NLDC) has also
been conceived to take care of inter-regional and cross boarder exchanges. Load Dispatch
Centers are also barred from trading activity and are ‘no profit no loss’ centers with fees and
charges being determined by the Regulators. Since both transmission and system operation
are neutral to the market and barred from trading activity, at present Indian power system
is having synergy with transmission and Grid operation. The Load Dispatch Centers both at
Regional and State levels have been upgraded with state-of-the-art technology.
Each region acts as a pool. Control areas are demarcated with each state and shared genera-
tors being separate entity and there are many participants in the pool. After much debate
and in consonance with the federal structure, India has opted for loose power pool and de-
centralized market.
The settlement system has undergone drastic evolution in recent years. A new scientific set-
tlement system popularly known as ‘Availability Based Tariff’ (ABT) has been introduced in
all the five regions in the country in a staggered fashion. The new mechanism has three
parts, viz. capacity charges linked to the availability of the generation, scheduled energy
charges based on the requisition and the schedules by the control areas.
The unique and the third component is termed as ‘Unscheduled Interchange’ (UI), which is
deviation from the schedule and its pricing is linked to frequency. The UI mechanism has a
self-healing property, brings in equilibrium and emulates all the properties of ‘Non-
Cooperation Game Theory’ automatically. The mechanism while causing economy also
complements reliability, yet maintaining the sovereignty of the utilities giving choice and
freedom.
Besides long-term (25 years) and short-term day-ahead, spot / balancing market by way of
UI mechanism where the prices are linked to the frequency has been created. The spot prices
are linked to frequency that is said to be collectively controlled and effectively stabilized. It
does not require elaborate calculations. Regulators tinker the UI vector from time to time in
order to achieve economy and reliability by creating a pseudo competitor.
Unlike other Pools the Pricing Mechanism of Unscheduled Interchange, i.e., Schedule minus
Actual is linked to frequency. The Central Regulator after public hearing and debate notifies
the UI price curve. The slope of the curve, kinks, upper and lower ceilings are arrived at by
the Regulator with a view to cause overall economy as well as quality in the grid.
The fundamental theory of equilibrium and the negative feedback has been adopted while
deciding the UI price curve. As UI price is linked to frequency and as it is known that fre-
quency deviations represent surplus and shortage situation, accordingly the UI price varies
with real-time shortage or surplus. In other words, as the surplus emerges, frequency rises
and the UI price starts coming down. Similarly, with shortage the frequency starts falling
and the UI price rises. The participants in the Pool seeing the rise and fall take corrective
action that acts as a negative feedback and dampens fluctuations and system reaches equili-
brium. The beauty of the scheme is that the Pool price needs not be calculated. It is totally
transparent. The mechanism encourages ‘Merit Order Operation’ in a distributed fashion as
virtually all the generators compete with the prevailing UI price that keeps sliding.
The marked difference in the scheme expects the frequency to fluctuate in order to give a
signal to the generators to adjust their output. A distributed optimization is effected. The
mechanism is also akin to Non Co-operative Game Theory through which the best prices are
achieved. The most interesting feature is that while economy is achieved the mechanism
also compliments reliability. In UI Mechanism utilities while economically gaining also con-
tribute to reliability. This makes the approach absolutely novel.
Trading of power has been recognized as a separate, distinct licensed activity by the legisla-
tion. There are variety of products being invented by the Traders and the prices are being
discovered however with a benchmark of prevailing UI prices fixing the virtual roof and
floor.
Electricity Infrastructures in the Global Marketplace332
With the formulation of power pool, settlement system, trading, in 2003 Regulators intro-
duced Open Access in the inter-state transmission. The plan is to progressively introduce
Open Access for embedded and captive power plants. The Open Access has been primarily
categorized as ‘long-term’ and ‘short-term’. The detailed speaking orders with elaborate
procedure has been put in place for calculation of transmission charges, obligation of losses,
prioritization of allotment, etc.
The transmission development management is a coordinated activity and by and large there
is not much of intra-regional congestion. However with increase in inter-regional flows con-
gestion has started surfacing in the inter-regional links. Regulators have devised bidding
procedure to take care of the congestion. Augmentation of Inter-Regional links capacity to
30,000 MW is envisaged by 2012.
9.1.3 Power Exchange
At present there is no formal ’Power Exchange’ operating in India. However, the Buyers,
Sellers and the Traders meet periodically in the various coordination meetings and deals are
negotiated. Some of the constituents have also opted for tendering and bidding for power
procurement through Traders in a competitive way. With continuous oversight by the Regu-
lators the resource scheduling and turnover of power by trading is improving and causing
economy to the sector while giving much desired choice to the utilities.
Basically the concept of a Power Exchange is that of a platform that enables market partici-
pants to go about their business of bidding, pricing, scheduling and settlement of transac-
tions on a real-time basis. In the Indian context, Power Trading Corporation (PTC) of India,
formed in the year 1999 in the public sector, was initially conceived as an intermediary with
a primary focus on managing credit risk for the Mega Power Projects. However soon it rec-
ognized its larger mandate of creating a vibrant power market. The concept of an exchange
gets subsumed in this mandate, and it came up with the statement of purpose as to be a
frontrunner in developing a Power Market and striving to correct market distortions.
The frontrunner has conceived a roadmap for setting up a power exchange in the country.
While shaping the concept, the frontrunner has the onus of visualizing the phasing of vari-
ous activities and corresponding investments as also educating various market participants,
existing and prospective, about the potential benefits. All this has to be dovetailed to the
Indian context, with its own peculiarities and consequent capacity to absorb change.
With the initiative taken for the first time in 2001, few market participants took part utilizing
the concept of exchanging surplus power with entities that have complementary deficits at a
market determined rate. The structure of these transactions was simple, with seller entities
supplying power on a round-the-clock basis for periods varying from a few months to one
year to buyer entities. While seller entities benefited by the enhancement of cash flows due
to better capacity utilization, the buyers got reliable supply at an economic, market-
determined rate. At the same time, various linking entities in the supply chain like the CTU,
STUs, RLDCs and SLDCs were able to make adjustments in their processes to allow these
market determined exchange transactions to overlay existing long-term, bilateral transac-
tions. The participants experienced the benefits of exploiting complementary surplus-deficit
situations arising from an annual or seasonal time-epoch.
As market participants and the linking agencies gained confidence from the demonstration
of success in these early transactions, more participants were initiated into the market. At
the same time, the experience curve benefits started accruing to the participants and their
power planning and operational processes became geared to take on shorter response time.
At this stage, it was felt that the time was ripe to initiate services that exploited complemen-
tary demand-supply situations arising from shorter time-epochs, like even a one-day period.
Therefore in 2002, new products were introduced that allowed flow of power for limited
hours during a 24-hour period, like `Morning Peak’, `Evening Peak’, `Off-Peak’ and various
combinations like `18 Hours Supply’. As all participants benefited by utilizing these trading
opportunities for shorter durations, many participants experienced the unique position of
reversing roles from buyer to seller during the same 24-hour period. At the same time, im-
plementation of Availability Based Tariff was started with the Western Region (WR), and
PTC as Trader looked at opportunities arising from this situation. Therefore, ‘ABT’ Power
arising from the need of the utilities in WR to balance schedules and optimize their revenues
was sold to utilities in the Southern Region (SR) at a fixed rate (the regime in SR had until
then not changed to ABT). This transaction, though small in terms of the volume traded,
was a pre-cursor to `As-and-When-Available’ power, a product evolved later in 2003 when
all participants became subject to the ABT regime. During 2002, with the acquisition of long-
term contracts for trading of power from Chukha and Kurichhu projects in Bhutan it has
been possible to diversify the supply portfolio. The participants’ confidence in the evolving
market mechanism is perhaps best symbolized by the structuring of trading transactions for
the sale of power from the 86 MW Malana HEP for periods ranging from one to three years,
in effect making it the first plant in India to operate on the merchant power plant business
model.
In the quest for greater efficiencies through a market based exchange mechanism, the ‘As-
and-When-Available’ power as a product where sale and purchase is planned on a day-
ahead basis in 2003 was introduced. At the same time, the Electricity Act was instituted, and
it formalized a very important principle on which these transactions were structured, name-
ly `Open Access’ in transmission. Participants and transactions grew manifold, and about 30
participants were active in the market at any point of time during the year. Several transac-
tions that involved use of transmission systems of four, and even all five-power regions of
the country were structured successfully. Hence, new participants that came into the market
were unique in their position. Some of them did not have significant sizes, but were in a
position to relieve power system congestions, or help other participants in managing re-
sources better because of the timing of the trading opportunities offered.
The challenge in moving ahead to the long-term scenario of an exchange is to reduce the
response time from a `day-ahead’ level to a real-time environment. While, even in the
present scenario, it has been possible to effect transactions in periods as low as 6 hours from
the user’s request, a power exchange aims to reduces this window to the minimum time
required by the System Operator. This part of the journey, possibly, presents the greatest
challenge in terms of integrating the evolution process to an exchange-like platform to the
Status of Power Markets and Power Exchanges in Asia and Australia 333
With the formulation of power pool, settlement system, trading, in 2003 Regulators intro-
duced Open Access in the inter-state transmission. The plan is to progressively introduce
Open Access for embedded and captive power plants. The Open Access has been primarily
categorized as ‘long-term’ and ‘short-term’. The detailed speaking orders with elaborate
procedure has been put in place for calculation of transmission charges, obligation of losses,
prioritization of allotment, etc.
The transmission development management is a coordinated activity and by and large there
is not much of intra-regional congestion. However with increase in inter-regional flows con-
gestion has started surfacing in the inter-regional links. Regulators have devised bidding
procedure to take care of the congestion. Augmentation of Inter-Regional links capacity to
30,000 MW is envisaged by 2012.
9.1.3 Power Exchange
At present there is no formal ’Power Exchange’ operating in India. However, the Buyers,
Sellers and the Traders meet periodically in the various coordination meetings and deals are
negotiated. Some of the constituents have also opted for tendering and bidding for power
procurement through Traders in a competitive way. With continuous oversight by the Regu-
lators the resource scheduling and turnover of power by trading is improving and causing
economy to the sector while giving much desired choice to the utilities.
Basically the concept of a Power Exchange is that of a platform that enables market partici-
pants to go about their business of bidding, pricing, scheduling and settlement of transac-
tions on a real-time basis. In the Indian context, Power Trading Corporation (PTC) of India,
formed in the year 1999 in the public sector, was initially conceived as an intermediary with
a primary focus on managing credit risk for the Mega Power Projects. However soon it rec-
ognized its larger mandate of creating a vibrant power market. The concept of an exchange
gets subsumed in this mandate, and it came up with the statement of purpose as to be a
frontrunner in developing a Power Market and striving to correct market distortions.
The frontrunner has conceived a roadmap for setting up a power exchange in the country.
While shaping the concept, the frontrunner has the onus of visualizing the phasing of vari-
ous activities and corresponding investments as also educating various market participants,
existing and prospective, about the potential benefits. All this has to be dovetailed to the
Indian context, with its own peculiarities and consequent capacity to absorb change.
With the initiative taken for the first time in 2001, few market participants took part utilizing
the concept of exchanging surplus power with entities that have complementary deficits at a
market determined rate. The structure of these transactions was simple, with seller entities
supplying power on a round-the-clock basis for periods varying from a few months to one
year to buyer entities. While seller entities benefited by the enhancement of cash flows due
to better capacity utilization, the buyers got reliable supply at an economic, market-
determined rate. At the same time, various linking entities in the supply chain like the CTU,
STUs, RLDCs and SLDCs were able to make adjustments in their processes to allow these
market determined exchange transactions to overlay existing long-term, bilateral transac-
tions. The participants experienced the benefits of exploiting complementary surplus-deficit
situations arising from an annual or seasonal time-epoch.
As market participants and the linking agencies gained confidence from the demonstration
of success in these early transactions, more participants were initiated into the market. At
the same time, the experience curve benefits started accruing to the participants and their
power planning and operational processes became geared to take on shorter response time.
At this stage, it was felt that the time was ripe to initiate services that exploited complemen-
tary demand-supply situations arising from shorter time-epochs, like even a one-day period.
Therefore in 2002, new products were introduced that allowed flow of power for limited
hours during a 24-hour period, like `Morning Peak’, `Evening Peak’, `Off-Peak’ and various
combinations like `18 Hours Supply’. As all participants benefited by utilizing these trading
opportunities for shorter durations, many participants experienced the unique position of
reversing roles from buyer to seller during the same 24-hour period. At the same time, im-
plementation of Availability Based Tariff was started with the Western Region (WR), and
PTC as Trader looked at opportunities arising from this situation. Therefore, ‘ABT’ Power
arising from the need of the utilities in WR to balance schedules and optimize their revenues
was sold to utilities in the Southern Region (SR) at a fixed rate (the regime in SR had until
then not changed to ABT). This transaction, though small in terms of the volume traded,
was a pre-cursor to `As-and-When-Available’ power, a product evolved later in 2003 when
all participants became subject to the ABT regime. During 2002, with the acquisition of long-
term contracts for trading of power from Chukha and Kurichhu projects in Bhutan it has
been possible to diversify the supply portfolio. The participants’ confidence in the evolving
market mechanism is perhaps best symbolized by the structuring of trading transactions for
the sale of power from the 86 MW Malana HEP for periods ranging from one to three years,
in effect making it the first plant in India to operate on the merchant power plant business
model.
In the quest for greater efficiencies through a market based exchange mechanism, the ‘As-
and-When-Available’ power as a product where sale and purchase is planned on a day-
ahead basis in 2003 was introduced. At the same time, the Electricity Act was instituted, and
it formalized a very important principle on which these transactions were structured, name-
ly `Open Access’ in transmission. Participants and transactions grew manifold, and about 30
participants were active in the market at any point of time during the year. Several transac-
tions that involved use of transmission systems of four, and even all five-power regions of
the country were structured successfully. Hence, new participants that came into the market
were unique in their position. Some of them did not have significant sizes, but were in a
position to relieve power system congestions, or help other participants in managing re-
sources better because of the timing of the trading opportunities offered.
The challenge in moving ahead to the long-term scenario of an exchange is to reduce the
response time from a `day-ahead’ level to a real-time environment. While, even in the
present scenario, it has been possible to effect transactions in periods as low as 6 hours from
the user’s request, a power exchange aims to reduces this window to the minimum time
required by the System Operator. This part of the journey, possibly, presents the greatest
challenge in terms of integrating the evolution process to an exchange-like platform to the
Electricity Infrastructures in the Global Marketplace334
changes taking place in the industry, post Electricity Act 2003. In order to meet this chal-
lenge a number of steps are contemplated that cover various aspects of the development of
an exchange.
A successful exchange platform requires rewards for efficient operation to be accruing to
participants equitably. This in turn, depends on the number and type of participants in the
market. Efforts are being made for a further diversification of the market participants’ base.
As a result entry of prospective participants, like, Captive Generators, Co-generators, Indus-
try Associations, energy intensive process industries, is expected into the market as Open
Access customers. However, with all these there may be requirement of change in regulato-
ry structures that would promote development of a market as well as wider participation in
the market. This is a crucial component in the strategy towards implementation of an ex-
change.
The backbone of an exchange is an information repository. While all other components
would require investment of time and buy-in of participants and linking entities, this is the
key component that also requires a significant capital investment. The features of this in-
formation platform would include a single application that allows tracking of bid-to-bill
(B2B) aspects of all transactions, enables validation at transaction and business levels, sup-
ports high volumes (typical range 500 to 5000 transactions in a year). The applications also
have to be flexible in that they need to adapt to additional / specific markets. While initially
the trading platform is envisaged more in the form of bulletin boards or an effective B2B
platform, the same will evolve into a power exchange with real-time capabilities over a
longer term. This is the correct approach to setting up a power exchange, as presently all the
participants do not have online connectivity with even aggregate level scheduling and dis-
patch data available with the RLDCs.
Further to enable customers to adapt to an online environment in a phased manner, as a
next step it is also necessary to initiate a Customer Relationship Management tool that
would enable both availability of information at the market participants’ desktops as well as
allow capture of operational information. As the market matures, this would evolve into a
B2B platform, or alternatively, integrate with an existing B2B platform. In fact the B2B plat-
form would be a pre-cursor to a fully functional, real-time exchange.
Thus, with lot of changes taking place in the Indian power scenario, due to unbundling of
generation, transmission and distribution and subsequent regulation providing Open
Access of transmission, de facto Power Exchange is in place in grid operation. Scheduling of
generation with Open Access of transmission system to meet demand is done keeping in
mind trading of power involved on short-term and long-term basis. Under real time Grid
Operation, system operates with the principle of Availability Based Tariff taking care of Un-
scheduled Interchange, of course subject to the constraint of system security and stability.
9.2 The Influence of Transmission on Further Development of
Power Exchange in the Australian National Electricity Market
The national electricity market (NEM) is the market for the wholesale supply and purchase
of electricity in five Australian states and territories - the Australian Capital Territory, New
South Wales, Queensland, South Australia, and Victoria - together with a regime of open
access to the transmission and distribution networks in those states and territories
5
. Tasma-
nia intends joining the market following completion of Basslink.
The market was launched on 13 December 1998.
The objectives of the national electricity market are that:
● the market should be competitive;
● customers should be able to choose which supplier (including generators and retailers)
they will trade with;
● any person wishing to do so should be able to gain access to the interconnected trans-
mission and distribution network;
● a person wishing to enter the market should not be treated more favorably or less fa-
vorably than if that person was already participating in the market;
● a particular energy source or technology should not be treated more favorably or less
favorably than another energy source or technology; and
● the provisions regulating trading of electricity in the market should not treat intrastate
trading more favorably or less favorably than interstate trading of electricity.
9.2.1 Description
The NEM is based on a single dispatch model. Generators are dispatched every five minutes
on the basis of bid price in $/MWh. An ancillary services market also operates
simultaneously with the energy market to maintain the level of operating reserve.
The NEM spans more than 4000km. The long distance transmission between load and
generation centers can require restricting the dispatch of generators to avoid overloading
transmission. Presently, the NEM is divided into several pricing regions. The market can
thus be described as a limited nodal pricing model. The resulting dispatch rules
accommodate the effects of marginal inter-regional loss factors and inter-regional operating
limits. The control center dispatch software, based on a Linear Programming algorithm,
minimizes the cost of meeting the load subject to many variables including generator upper
and lower operating limits, inter-regional line limits, and minimum reserve levels.
The inter-regional transmission system has been augmented several times since market
inception, including connection of Queensland in 2000 through the Direct link dc link and
the QNI ac link, then in 2002 with the Murray link dc interconnector between Victoria and
South Australia. In November 2005, the Tasmanian and Victorian systems was
interconnected for the first time by a 300km undersea HVdc cable.
Figure 9.1 shows the connection arrangement including the nominal interconnector
limitations between regions.
Status of Power Markets and Power Exchanges in Asia and Australia 335
changes taking place in the industry, post Electricity Act 2003. In order to meet this chal-
lenge a number of steps are contemplated that cover various aspects of the development of
an exchange.
A successful exchange platform requires rewards for efficient operation to be accruing to
participants equitably. This in turn, depends on the number and type of participants in the
market. Efforts are being made for a further diversification of the market participants’ base.
As a result entry of prospective participants, like, Captive Generators, Co-generators, Indus-
try Associations, energy intensive process industries, is expected into the market as Open
Access customers. However, with all these there may be requirement of change in regulato-
ry structures that would promote development of a market as well as wider participation in
the market. This is a crucial component in the strategy towards implementation of an ex-
change.
The backbone of an exchange is an information repository. While all other components
would require investment of time and buy-in of participants and linking entities, this is the
key component that also requires a significant capital investment. The features of this in-
formation platform would include a single application that allows tracking of bid-to-bill
(B2B) aspects of all transactions, enables validation at transaction and business levels, sup-
ports high volumes (typical range 500 to 5000 transactions in a year). The applications also
have to be flexible in that they need to adapt to additional / specific markets. While initially
the trading platform is envisaged more in the form of bulletin boards or an effective B2B
platform, the same will evolve into a power exchange with real-time capabilities over a
longer term. This is the correct approach to setting up a power exchange, as presently all the
participants do not have online connectivity with even aggregate level scheduling and dis-
patch data available with the RLDCs.
Further to enable customers to adapt to an online environment in a phased manner, as a
next step it is also necessary to initiate a Customer Relationship Management tool that
would enable both availability of information at the market participants’ desktops as well as
allow capture of operational information. As the market matures, this would evolve into a
B2B platform, or alternatively, integrate with an existing B2B platform. In fact the B2B plat-
form would be a pre-cursor to a fully functional, real-time exchange.
Thus, with lot of changes taking place in the Indian power scenario, due to unbundling of
generation, transmission and distribution and subsequent regulation providing Open
Access of transmission, de facto Power Exchange is in place in grid operation. Scheduling of
generation with Open Access of transmission system to meet demand is done keeping in
mind trading of power involved on short-term and long-term basis. Under real time Grid
Operation, system operates with the principle of Availability Based Tariff taking care of Un-
scheduled Interchange, of course subject to the constraint of system security and stability.
9.2 The Influence of Transmission on Further Development of
Power Exchange in the Australian National Electricity Market
The national electricity market (NEM) is the market for the wholesale supply and purchase
of electricity in five Australian states and territories - the Australian Capital Territory, New
South Wales, Queensland, South Australia, and Victoria - together with a regime of open
access to the transmission and distribution networks in those states and territories
5
. Tasma-
nia intends joining the market following completion of Basslink.
The market was launched on 13 December 1998.
The objectives of the national electricity market are that:
● the market should be competitive;
● customers should be able to choose which supplier (including generators and retailers)
they will trade with;
● any person wishing to do so should be able to gain access to the interconnected trans-
mission and distribution network;
● a person wishing to enter the market should not be treated more favorably or less fa-
vorably than if that person was already participating in the market;
● a particular energy source or technology should not be treated more favorably or less
favorably than another energy source or technology; and
● the provisions regulating trading of electricity in the market should not treat intrastate
trading more favorably or less favorably than interstate trading of electricity.
9.2.1 Description
The NEM is based on a single dispatch model. Generators are dispatched every five minutes
on the basis of bid price in $/MWh. An ancillary services market also operates
simultaneously with the energy market to maintain the level of operating reserve.
The NEM spans more than 4000km. The long distance transmission between load and
generation centers can require restricting the dispatch of generators to avoid overloading
transmission. Presently, the NEM is divided into several pricing regions. The market can
thus be described as a limited nodal pricing model. The resulting dispatch rules
accommodate the effects of marginal inter-regional loss factors and inter-regional operating
limits. The control center dispatch software, based on a Linear Programming algorithm,
minimizes the cost of meeting the load subject to many variables including generator upper
and lower operating limits, inter-regional line limits, and minimum reserve levels.
The inter-regional transmission system has been augmented several times since market
inception, including connection of Queensland in 2000 through the Direct link dc link and
the QNI ac link, then in 2002 with the Murray link dc interconnector between Victoria and
South Australia. In November 2005, the Tasmanian and Victorian systems was
interconnected for the first time by a 300km undersea HVdc cable.
Figure 9.1 shows the connection arrangement including the nominal interconnector
limitations between regions.
Electricity Infrastructures in the Global Marketplace336
Figure 9.1. Generation and transfer capabilities (Summer 2004/05).
9.2.2 Issues
9.2.2.1 Generation utilization
Prior to and since market inception, the forced outage rates of generating plant have re-
duced substantially. This has allowed the margin between supply and demand to reduce
without compromising reliability. The result of these efficiency gains has been to increase
the dependence of reliable market operation on inter-regional interconnections.
The general reduction in the gap between annual installed capacity and annual half hourly
peak demand over time is shown in Figure 9.2. While net generation of nearly 4000MW has
been added since the start of the NEM due to market forces, the summer peak demand has
increased by more than 6000MW. The data is for the mainland states only, but includes a net
injection of equivalent generating capacity of 600MW from Bass link starting in 2005-06.
9.2.2.2 Resource Development
Growth, with accompanying pool price increases, is the main driver for the development of
new generation.
At the same time, environmental factors are influencing the development of the market
through restrictions on permitting plants that do not meet the highest levels of performance
available for that fuel.
Several mechanisms are in place to encourage development of renewable or low emission
generation within a market context:
- Commonwealth initiatives such as the 2% Mandatory Renewable Energy Target (MRET)
scheme for additional renewable energy
- State initiatives such as the Queensland 13% gas scheme and the NSW Greenhouse Ab-
atement Certificate (NGAC) scheme, both of which are aimed at enhancing efficiency,
and development of lower emission plant such as gas.
22,000
24,000
26,000
28,000
30,000
32,000
34,000
36,000
38,000
40,000
1
9
9
8
-9
9
1
9
99
-00
2
0
0
0
-
01
2
0
0
1
-
02
2
0
02
-0
3
2
0
03
-
04
2
0
04
-0
5
2
0
05
-06
2
0
06
-07
2
0
0
7
-
08
2
0
08
-09
NEM-Wide Installed Capacity
Extrapolated NEM-Wide Installed Capacity
Actual Peak Demand
Linear (Actual Peak Demand)
Expon. (Actual Peak Demand)
(a) Installed Capacity and Summer Peak Demand
22,000
24,000
26,000
28,000
30,000
32,000
34,000
36,000
38,000
40,000
19
9
9
2
0
0
0
20
0
1
2
0
0
2
20
0
3
2
0
04
2
0
0
5
2
0
06
2
0
0
7
2
0
08
NEM-Wide Installed Capacity
Extrapolated NEM-Wide Installed Capacity
Actual Peak Demand
Linear (Actual Peak Demand)
Expon. (Actual Peak Demand)
y
(b) Installed Capacity and Winter Peak Demand
Figure 9.2 Supply and demand
Status of Power Markets and Power Exchanges in Asia and Australia 337
Figure 9.1. Generation and transfer capabilities (Summer 2004/05).
9.2.2 Issues
9.2.2.1 Generation utilization
Prior to and since market inception, the forced outage rates of generating plant have re-
duced substantially. This has allowed the margin between supply and demand to reduce
without compromising reliability. The result of these efficiency gains has been to increase
the dependence of reliable market operation on inter-regional interconnections.
The general reduction in the gap between annual installed capacity and annual half hourly
peak demand over time is shown in Figure 9.2. While net generation of nearly 4000MW has
been added since the start of the NEM due to market forces, the summer peak demand has
increased by more than 6000MW. The data is for the mainland states only, but includes a net
injection of equivalent generating capacity of 600MW from Bass link starting in 2005-06.
9.2.2.2 Resource Development
Growth, with accompanying pool price increases, is the main driver for the development of
new generation.
At the same time, environmental factors are influencing the development of the market
through restrictions on permitting plants that do not meet the highest levels of performance
available for that fuel.
Several mechanisms are in place to encourage development of renewable or low emission
generation within a market context:
- Commonwealth initiatives such as the 2% Mandatory Renewable Energy Target (MRET)
scheme for additional renewable energy
- State initiatives such as the Queensland 13% gas scheme and the NSW Greenhouse Ab-
atement Certificate (NGAC) scheme, both of which are aimed at enhancing efficiency,
and development of lower emission plant such as gas.
22,000
24,000
26,000
28,000
30,000
32,000
34,000
36,000
38,000
40,000
1
9
9
8
-9
9
1
9
99
-00
2
0
0
0
-
01
2
0
0
1
-
02
2
0
02
-0
3
2
0
03
-
04
2
0
04
-0
5
2
0
05
-06
2
0
06
-07
2
0
0
7
-
08
2
0
08
-09
NEM-Wide Installed Capacity
Extrapolated NEM-Wide Installed Capacity
Actual Peak Demand
Linear (Actual Peak Demand)
Expon. (Actual Peak Demand)
(a) Installed Capacity and Summer Peak Demand
22,000
24,000
26,000
28,000
30,000
32,000
34,000
36,000
38,000
40,000
19
9
9
2
0
0
0
20
0
1
2
0
0
2
20
0
3
2
0
04
2
0
0
5
2
0
06
2
0
0
7
2
0
08
NEM-Wide Installed Capacity
Extrapolated NEM-Wide Installed Capacity
Actual Peak Demand
Linear (Actual Peak Demand)
Expon. (Actual Peak Demand)
y
(b) Installed Capacity and Winter Peak Demand
Figure 9.2 Supply and demand
Electricity Infrastructures in the Global Marketplace338
With the impending exhaustion of opportunities to gain further performance improvements
from existing generation, many new plans are being developed by market participants to
introduce new generation, predominantly gas, black coal, brown coal, wind and biomass.
Wind resources dominate in the southern regions, while biomass tends to dominate in the
northern regions.
Major gas pipelines are planned from Papua New Guinea and the Timor Sea, both north of
Australia. If these projects eventuate they are of the scale to introduce major changes to the
generation mix and utilization of transmission.
The Bass link project will add 2500MW of storage hydro generation to the existing mainland
hydro (predominantly the 3676MW Snowy Mountains hydro), and introduce further dy-
namics to the hydrothermal interactions.
9.2.2.3 Transmission utilization
Flows are significantly different from the pre-market situation. While pre-NEM flows were
dominated by issues within state boundaries, plus defined interchanges based on operating
agreements, the market has expanded trading across interconnectors on the basis of bids by
all generation including renewables.
This has tended to use transmission to a higher degree, resulting in increased incidence of
operation at or near transmission limits.
The increasing incidence of transmission constraints resulting in price separation between
regions with generation constrained off or down in the exporting region(s) has created the
opportunity for further augmentation. However, since transmission is a regulated service,
additional transmission augmentation has to be justified on the basis of reliability or cost
reductions. Proposals are in place, however, to relax the conditions for regulated
augmentations by accounting for other defined market benefits. This could open the way for
expanded interconnections and/or new interconnections between existing regions.
Unregulated transmission can be built by a proponent seeking to recover its investment
based on market revenues. So far, several such transmission links have been built, all based
on HVdc technology and connecting regions with potential price differentials sufficient to
justify the investments. One of these, Murray link, has since successfully applied for
conversion to regulated status.
The potential for additional transmission connections to other regions and/or countries is
reduced by the relatively small loads and long distances involved. The largest unconnected
region is the 4000MW South West Interconnected System (SWIS) in Western Australia,
which is approximately 2000km from the nearest connection point to the NEM. Since
Western Australia has an abundance of energy available from the North West Shelf gas
fields in the north of the state, and coal fields in the South West, there is no economic
justification for a NEM-SWIS link at present.
Several smaller grids are operating in Australia - in North West Western Australia (the
North West Interconnected System, of about 400MW, and several other unconnected
generators with an additional several hundred MW), in the Northern Territory
(approximately 400MW), and in North West Queensland (approximately 400MW). These
may be linked to the NEM or to each other as part of anticipated resource developments,
including gas pipelines from the Timor Sea and/or PNG.
9.2.3 Market Developments
The strict conditions associated with development of the NEM have resulted in a robust and
successful electricity market. This market has succeeded in accommodating substantial load
growth, while accommodating several thousand MW of new merchant plant of various
types and sizes. There has also been withdrawal of some generation due to market forces.
The success of the NEM can be put down to several factors, including:
A single body/organization overseeing the market
Multiple parties looking at system operation to look after commercial interests
Careful specification and description of network limitations, resulting in a general
increase in network utilization.
expanded tools to improve analysis, which are used by market operators, partici-
pants and regulatory authorities.
A uniformity of approach in the application of standards for connection and access,
which previously did not exist.
Transparency and governance strictly according to the National Electricity Code
and National Electricity Law. High levels of transparency tend to ensure good go-
vernance.
Active involvement at the political level as well as the industry level
The high quality of staff in market operation
The high level of horizontal and vertical disaggregation of the industry exposes the
risks of markets and therefore drives commerciality. This tends to drive out the
benefits in each part of the industry.
The rules and regulations support and facilitate market operation.
9.2.4 The Way Forward
Since market inception, grid development has been minimal compared with the extensive
changes to the operating regimes of existing generating plant and the new generating plant
that has been developed.
This has resulted in increasing tension between regulated grid development and generation.
Planning and implementation of changes to the grid have been underway in several critical
areas.
Grid companies will need sufficient incentives to consider augmentation to meet the
imperatives of economic resource development in an environment that is likely to include
further and stricter emissions limitations from generation sources.
Status of Power Markets and Power Exchanges in Asia and Australia 339
With the impending exhaustion of opportunities to gain further performance improvements
from existing generation, many new plans are being developed by market participants to
introduce new generation, predominantly gas, black coal, brown coal, wind and biomass.
Wind resources dominate in the southern regions, while biomass tends to dominate in the
northern regions.
Major gas pipelines are planned from Papua New Guinea and the Timor Sea, both north of
Australia. If these projects eventuate they are of the scale to introduce major changes to the
generation mix and utilization of transmission.
The Bass link project will add 2500MW of storage hydro generation to the existing mainland
hydro (predominantly the 3676MW Snowy Mountains hydro), and introduce further dy-
namics to the hydrothermal interactions.
9.2.2.3 Transmission utilization
Flows are significantly different from the pre-market situation. While pre-NEM flows were
dominated by issues within state boundaries, plus defined interchanges based on operating
agreements, the market has expanded trading across interconnectors on the basis of bids by
all generation including renewables.
This has tended to use transmission to a higher degree, resulting in increased incidence of
operation at or near transmission limits.
The increasing incidence of transmission constraints resulting in price separation between
regions with generation constrained off or down in the exporting region(s) has created the
opportunity for further augmentation. However, since transmission is a regulated service,
additional transmission augmentation has to be justified on the basis of reliability or cost
reductions. Proposals are in place, however, to relax the conditions for regulated
augmentations by accounting for other defined market benefits. This could open the way for
expanded interconnections and/or new interconnections between existing regions.
Unregulated transmission can be built by a proponent seeking to recover its investment
based on market revenues. So far, several such transmission links have been built, all based
on HVdc technology and connecting regions with potential price differentials sufficient to
justify the investments. One of these, Murray link, has since successfully applied for
conversion to regulated status.
The potential for additional transmission connections to other regions and/or countries is
reduced by the relatively small loads and long distances involved. The largest unconnected
region is the 4000MW South West Interconnected System (SWIS) in Western Australia,
which is approximately 2000km from the nearest connection point to the NEM. Since
Western Australia has an abundance of energy available from the North West Shelf gas
fields in the north of the state, and coal fields in the South West, there is no economic
justification for a NEM-SWIS link at present.
Several smaller grids are operating in Australia - in North West Western Australia (the
North West Interconnected System, of about 400MW, and several other unconnected
generators with an additional several hundred MW), in the Northern Territory
(approximately 400MW), and in North West Queensland (approximately 400MW). These
may be linked to the NEM or to each other as part of anticipated resource developments,
including gas pipelines from the Timor Sea and/or PNG.
9.2.3 Market Developments
The strict conditions associated with development of the NEM have resulted in a robust and
successful electricity market. This market has succeeded in accommodating substantial load
growth, while accommodating several thousand MW of new merchant plant of various
types and sizes. There has also been withdrawal of some generation due to market forces.
The success of the NEM can be put down to several factors, including:
A single body/organization overseeing the market
Multiple parties looking at system operation to look after commercial interests
Careful specification and description of network limitations, resulting in a general
increase in network utilization.
expanded tools to improve analysis, which are used by market operators, partici-
pants and regulatory authorities.
A uniformity of approach in the application of standards for connection and access,
which previously did not exist.
Transparency and governance strictly according to the National Electricity Code
and National Electricity Law. High levels of transparency tend to ensure good go-
vernance.
Active involvement at the political level as well as the industry level
The high quality of staff in market operation
The high level of horizontal and vertical disaggregation of the industry exposes the
risks of markets and therefore drives commerciality. This tends to drive out the
benefits in each part of the industry.
The rules and regulations support and facilitate market operation.
9.2.4 The Way Forward
Since market inception, grid development has been minimal compared with the extensive
changes to the operating regimes of existing generating plant and the new generating plant
that has been developed.
This has resulted in increasing tension between regulated grid development and generation.
Planning and implementation of changes to the grid have been underway in several critical
areas.
Grid companies will need sufficient incentives to consider augmentation to meet the
imperatives of economic resource development in an environment that is likely to include
further and stricter emissions limitations from generation sources.
Electricity Infrastructures in the Global Marketplace340
9.3 Technical and Market System Effectiveness of Intersystem
Power Exchanges in Russia
Historically the formation of large electric power systems and their interconnection into the
Unified power system (UPS) of the country was related to the objective positive factors. Crea-
tion of Russia’s UPS enhanced essentially the economic efficiency and reliability of power
supply as compared to separately operating regional power systems. The influence of the sys-
tem effect casts no doubt among energy specialists. A great number of publications have been
dedicated to the analysis of different aspects of system efficiency of electric power systems.
This section deals with the notions of the potential effect of integration of electric power
systems (EPS) and the effect realized in a market environment. The estimation technique is
presented. The effect is estimated on the example of Russia’s UPS.
9.3.1 Technical System Effect
The system effect in electric power industry is of a multi-factor character. Traditionally the
following technology-based components of the intersystem effect have been set off at inte-
gration of power systems
6, 7
.
A “capacity” effect
● A decrease in demand for installed capacity of power plants by bringing into coincidence
the load maxim, reducing the operating reserve, decreasing the reserves for routine main-
tenance;
● An increase in firm power of hydro power plants by raising the total firm power owing to
asynchronous run off in different river basins and use of long-term regulation of water
reservoirs to the benefits of neighboring power systems;
● A more complete use of commissioned capacity by decreasing the unused capacity in a
large system.
A “structural “effect:
● Rationalization of power system structure by: using cheap (but economically inefficient in
terms of transportation) energy resources at power plants with power transmission to
neighboring systems; increasing the use of peak and free power of hydro power plants;
● A better use of hydropower in the high water years;
● An opportunity to construct power plants successively with the use of temporary surplus
powers in the other power plants;
● Saving in the construction of electric networks for power supply to the areas of individual
power systems connection.
A “frequency” effect
A Frequency Effect implies a lesser impact of an individual energy unit or a consumer in a
large electric power system (EPS) on the system frequency as compared to a smaller system.
The frequency effect allows the unit capacity of energy facilities to be chosen without con-
straints on the system requirements.
An “operation” effect
An Operation Effect implies a decrease in operating costs by optimizing the operating con-
ditions of power plants in the integrated system, increasing the total density of load curves
of power systems at integration, by widely using the cheap fuels.
An “environmental” effect supposes improvement of the environmental situation due to
redistribution of power generation at power plants with its decrease in the areas with unfa-
vorable environmental conditions.
All these components have objective material (technological) nature. However currently the
assessment of these components only seems to be insufficient.
9.3.2 Market System Effect
At present the process of operation and expansion of power systems involves many subjects
of relations in electric power industry: power companies, individual power plants, Govern-
mental authorities (federal and regional), electricity consumers (production and agricultural
consumers, transport sector and population). These subjects have different interests. For
power companies as for the wholesale market subjects the main criterion is profit. The crite-
ria of the governmental authorities include profitability of the sector (incomes to the budg-
ets), impact of the electric power industry on the industrial production volumes, employ-
ment and living conditions of the population, environmental impact, energy security, etc.
The consumers are interested in the level of electricity and heat tariffs, reliability and quality
of power supply. In particular the decisions efficient from the viewpoint of a federal or “na-
tional economic” level can be unacceptable for the other subjects. Many decisions cannot be
made until the interests of all the parties concerned are coordinated and the required com-
promise is achieved.
Thus, the traditional estimation of power systems efficiency with account for only
technological factors corresponds currently only to its technically feasible limits. Let us call
them technical system effects (TSE).
The fact that many subjects have different interests and affect the decision making on
expansion and operation of power systems does not change the set of components of the
effect but leads to variations in the set for different subjects of relations and to different
estimations of the same components of the effect by different subjects of relations.
Consider the main factors that determine the system effects for different subjects of relations
in a market environment (let us call them market system effects (MSE)) as applied to
Russia’s current electric power industry structure that consists of competing generating and
selling companies, network companies as natural monopolies, electricity consumers.
The bids of generating companies for electricity supply to the wholesale markets build the
function of a supply which is then related to the function of a demand for electricity on the
part of selling companies and consumers. This relationship is used to determine the
equilibrium price of electricity at the wholesale market. Profit, being the main criterion for
the generating companies under competition will make them decrease the costs of electricity
production by loading, first of all, the most efficient generating capacities. Thus, the market
Status of Power Markets and Power Exchanges in Asia and Australia 341
9.3 Technical and Market System Effectiveness of Intersystem
Power Exchanges in Russia
Historically the formation of large electric power systems and their interconnection into the
Unified power system (UPS) of the country was related to the objective positive factors. Crea-
tion of Russia’s UPS enhanced essentially the economic efficiency and reliability of power
supply as compared to separately operating regional power systems. The influence of the sys-
tem effect casts no doubt among energy specialists. A great number of publications have been
dedicated to the analysis of different aspects of system efficiency of electric power systems.
This section deals with the notions of the potential effect of integration of electric power
systems (EPS) and the effect realized in a market environment. The estimation technique is
presented. The effect is estimated on the example of Russia’s UPS.
9.3.1 Technical System Effect
The system effect in electric power industry is of a multi-factor character. Traditionally the
following technology-based components of the intersystem effect have been set off at inte-
gration of power systems
6, 7
.
A “capacity” effect
● A decrease in demand for installed capacity of power plants by bringing into coincidence
the load maxim, reducing the operating reserve, decreasing the reserves for routine main-
tenance;
● An increase in firm power of hydro power plants by raising the total firm power owing to
asynchronous run off in different river basins and use of long-term regulation of water
reservoirs to the benefits of neighboring power systems;
● A more complete use of commissioned capacity by decreasing the unused capacity in a
large system.
A “structural “effect:
● Rationalization of power system structure by: using cheap (but economically inefficient in
terms of transportation) energy resources at power plants with power transmission to
neighboring systems; increasing the use of peak and free power of hydro power plants;
● A better use of hydropower in the high water years;
● An opportunity to construct power plants successively with the use of temporary surplus
powers in the other power plants;
● Saving in the construction of electric networks for power supply to the areas of individual
power systems connection.
A “frequency” effect
A Frequency Effect implies a lesser impact of an individual energy unit or a consumer in a
large electric power system (EPS) on the system frequency as compared to a smaller system.
The frequency effect allows the unit capacity of energy facilities to be chosen without con-
straints on the system requirements.
An “operation” effect
An Operation Effect implies a decrease in operating costs by optimizing the operating con-
ditions of power plants in the integrated system, increasing the total density of load curves
of power systems at integration, by widely using the cheap fuels.
An “environmental” effect supposes improvement of the environmental situation due to
redistribution of power generation at power plants with its decrease in the areas with unfa-
vorable environmental conditions.
All these components have objective material (technological) nature. However currently the
assessment of these components only seems to be insufficient.
9.3.2 Market System Effect
At present the process of operation and expansion of power systems involves many subjects
of relations in electric power industry: power companies, individual power plants, Govern-
mental authorities (federal and regional), electricity consumers (production and agricultural
consumers, transport sector and population). These subjects have different interests. For
power companies as for the wholesale market subjects the main criterion is profit. The crite-
ria of the governmental authorities include profitability of the sector (incomes to the budg-
ets), impact of the electric power industry on the industrial production volumes, employ-
ment and living conditions of the population, environmental impact, energy security, etc.
The consumers are interested in the level of electricity and heat tariffs, reliability and quality
of power supply. In particular the decisions efficient from the viewpoint of a federal or “na-
tional economic” level can be unacceptable for the other subjects. Many decisions cannot be
made until the interests of all the parties concerned are coordinated and the required com-
promise is achieved.
Thus, the traditional estimation of power systems efficiency with account for only
technological factors corresponds currently only to its technically feasible limits. Let us call
them technical system effects (TSE).
The fact that many subjects have different interests and affect the decision making on
expansion and operation of power systems does not change the set of components of the
effect but leads to variations in the set for different subjects of relations and to different
estimations of the same components of the effect by different subjects of relations.
Consider the main factors that determine the system effects for different subjects of relations
in a market environment (let us call them market system effects (MSE)) as applied to
Russia’s current electric power industry structure that consists of competing generating and
selling companies, network companies as natural monopolies, electricity consumers.
The bids of generating companies for electricity supply to the wholesale markets build the
function of a supply which is then related to the function of a demand for electricity on the
part of selling companies and consumers. This relationship is used to determine the
equilibrium price of electricity at the wholesale market. Profit, being the main criterion for
the generating companies under competition will make them decrease the costs of electricity
production by loading, first of all, the most efficient generating capacities. Thus, the market
Electricity Infrastructures in the Global Marketplace342
mechanisms will decrease the equilibrium electricity price at the wholesale market. This is
possible at joint operation of generating companies in a system with no network constraints.
Here the account should be taken of the constraints on participation of generating units in
covering load curves and on provision of power supply reliability and power quality.
The relationship between the MSE and the above TSE components shows that the formation
of equilibrium electricity price at the wholesale market involves realization of practically all
the TSE components. However the extent of their realization is determined by the efficiency
of the competing market mechanisms. Bearing in mind the fact that the ideal competition in
electric power industry is practically unachievable due to a limited number of market
subjects we can expect that the MSE will be smaller than the potential TSE.
Similar market mechanisms should operate at competition of selling companies at the
consumer electricity markets that will result in realization of additional MSE components at
this level.
Network companies (federal and distribution regional) play an auxiliary role in the
considered market processes. They rend the required services on power transmission from
suppliers to consumers, on provision of power supply reliability and power quality, thus
being conducive to the enhancement of MSE as a result of electricity market operation.
It is necessary to emphasize that in a short-term context the competing mechanisms at the
wholesale and consumer electricity markets may decrease the electricity prices even below
the level which is determined by the complete realization of TSE, as a result of price bids of
the generating companies below the electricity production cost with account for its
components. However, in a long-term context this situation is fraught with negative
consequences that may take the form of inadmissible reduction of reserve capacities,
decrease in funds to maintain the equipment in service state, to update and replace it. This
will result in disappearance of conditions for competition at the electricity markets. The
trend may appear toward a sharp increase in the electricity prices that will call for their
regulation.
The interests of consumers expressed through their main criteria imply the interest in
efficient operation of the electricity markets, i.e. maximum realization of MSE and, thus
decrease in the electricity prices.
The interests of the authorities are to a certain extent contradictory. For example, the electric
power industry will be highly profitable at high profits of power companies and these high
profits are possible at high electricity prices. At the same time the efficiency of the industrial
production, the living conditions of the population and other interests call for decrease in
these prices. However, on the whole the authorities are certainly interested in the efficient
operation of electricity markets, i.e. in maximum MSE realization.
It should be noted that for the subjects of relations the real effect from the measures on
intensification of power systems integration depends on the system of economic
management in the country. The system of management to a considerable extent affects the
redistribution of the real effect among the subjects of relations and can both foster and
hinder the TSE realization.
9.3.3 Principles of Estimating the System Efficiency
When estimating the potential TSE we consider UPS of Russia as a technically and
technologically single object disregarding the forms of property. In this context this
estimation is objective and single-valued. Comparatively simply we determine the base for
such estimation, i.e. the conditions the effect is estimated for. Here we should use the
approaches and recommendations that were developed for the centrally managed electric
power industry. In a certain sense the model of the centrally managed electric power
industry facilitates the full realization of the potential TSE.
The TSE components for UPS as a whole were estimated, depending on the aspect of
consideration, based either on the conditions that do not suppose realization of the effect
(for example isolated operation of regional power systems) or on the existing level of the
UPS integration.
The approaches to the estimation of MSE are less obvious. When analyzing UPS expansion
for a long-term future they apparently should be maximum independent from the
conditions and principles of legal-normative framework. We should orient to the situation
when the legal-normative framework fosters the full realization of TSE. When considering
short-term prospects it is necessary to take into account the active legal-normative
framework.
For a qualitative estimation of the system effect it is necessary to use existing and develop
new mathematical models for: estimation of individual TSE components; integral estimation
of an effect (such models are necessary as the net present value is not a simple sum of
individual components); estimation of effects for federal and regional authorities and energy
consumers that include the assessment of budget efficiency, levels of electricity tariffs, level
of employment, level of living conditions, etc.
A complex integral estimation of the TSE involves the optimization model of electric power
system expansion “SOYUZ”
8-10
.
9.3.4 Case Study
Below presented are the results of estimating the system efficiency of Russia’s UPS
expansion for the time horizon 2010-2030.
It is very complicated to fully estimate all the TSE components, therefore only the main ones
were estimated: the “capacity” effect, excluding the effects of equipment maintenance
optimization and use of asynchronous run off in the rivers of different water reservoirs; the
“structural” effect disregarding the environmental components, the effect of successive
construction and construction of transmission lines at the point of connection of adjacent
power systems; the “operation” and “frequency” effects. The model “SOYUZ” was applied
for the estimation.
Status of Power Markets and Power Exchanges in Asia and Australia 343
mechanisms will decrease the equilibrium electricity price at the wholesale market. This is
possible at joint operation of generating companies in a system with no network constraints.
Here the account should be taken of the constraints on participation of generating units in
covering load curves and on provision of power supply reliability and power quality.
The relationship between the MSE and the above TSE components shows that the formation
of equilibrium electricity price at the wholesale market involves realization of practically all
the TSE components. However the extent of their realization is determined by the efficiency
of the competing market mechanisms. Bearing in mind the fact that the ideal competition in
electric power industry is practically unachievable due to a limited number of market
subjects we can expect that the MSE will be smaller than the potential TSE.
Similar market mechanisms should operate at competition of selling companies at the
consumer electricity markets that will result in realization of additional MSE components at
this level.
Network companies (federal and distribution regional) play an auxiliary role in the
considered market processes. They rend the required services on power transmission from
suppliers to consumers, on provision of power supply reliability and power quality, thus
being conducive to the enhancement of MSE as a result of electricity market operation.
It is necessary to emphasize that in a short-term context the competing mechanisms at the
wholesale and consumer electricity markets may decrease the electricity prices even below
the level which is determined by the complete realization of TSE, as a result of price bids of
the generating companies below the electricity production cost with account for its
components. However, in a long-term context this situation is fraught with negative
consequences that may take the form of inadmissible reduction of reserve capacities,
decrease in funds to maintain the equipment in service state, to update and replace it. This
will result in disappearance of conditions for competition at the electricity markets. The
trend may appear toward a sharp increase in the electricity prices that will call for their
regulation.
The interests of consumers expressed through their main criteria imply the interest in
efficient operation of the electricity markets, i.e. maximum realization of MSE and, thus
decrease in the electricity prices.
The interests of the authorities are to a certain extent contradictory. For example, the electric
power industry will be highly profitable at high profits of power companies and these high
profits are possible at high electricity prices. At the same time the efficiency of the industrial
production, the living conditions of the population and other interests call for decrease in
these prices. However, on the whole the authorities are certainly interested in the efficient
operation of electricity markets, i.e. in maximum MSE realization.
It should be noted that for the subjects of relations the real effect from the measures on
intensification of power systems integration depends on the system of economic
management in the country. The system of management to a considerable extent affects the
redistribution of the real effect among the subjects of relations and can both foster and
hinder the TSE realization.
9.3.3 Principles of Estimating the System Efficiency
When estimating the potential TSE we consider UPS of Russia as a technically and
technologically single object disregarding the forms of property. In this context this
estimation is objective and single-valued. Comparatively simply we determine the base for
such estimation, i.e. the conditions the effect is estimated for. Here we should use the
approaches and recommendations that were developed for the centrally managed electric
power industry. In a certain sense the model of the centrally managed electric power
industry facilitates the full realization of the potential TSE.
The TSE components for UPS as a whole were estimated, depending on the aspect of
consideration, based either on the conditions that do not suppose realization of the effect
(for example isolated operation of regional power systems) or on the existing level of the
UPS integration.
The approaches to the estimation of MSE are less obvious. When analyzing UPS expansion
for a long-term future they apparently should be maximum independent from the
conditions and principles of legal-normative framework. We should orient to the situation
when the legal-normative framework fosters the full realization of TSE. When considering
short-term prospects it is necessary to take into account the active legal-normative
framework.
For a qualitative estimation of the system effect it is necessary to use existing and develop
new mathematical models for: estimation of individual TSE components; integral estimation
of an effect (such models are necessary as the net present value is not a simple sum of
individual components); estimation of effects for federal and regional authorities and energy
consumers that include the assessment of budget efficiency, levels of electricity tariffs, level
of employment, level of living conditions, etc.
A complex integral estimation of the TSE involves the optimization model of electric power
system expansion “SOYUZ”
8-10
.
9.3.4 Case Study
Below presented are the results of estimating the system efficiency of Russia’s UPS
expansion for the time horizon 2010-2030.
It is very complicated to fully estimate all the TSE components, therefore only the main ones
were estimated: the “capacity” effect, excluding the effects of equipment maintenance
optimization and use of asynchronous run off in the rivers of different water reservoirs; the
“structural” effect disregarding the environmental components, the effect of successive
construction and construction of transmission lines at the point of connection of adjacent
power systems; the “operation” and “frequency” effects. The model “SOYUZ” was applied
for the estimation.