Electricity Infrastructures in the Global Marketplace Part 9 doc
Bạn đang xem bản rút gọn của tài liệu. Xem và tải ngay bản đầy đủ của tài liệu tại đây (3.07 MB, 50 trang )
Status of Power Markets and Power Exchanges in Asia and Australia 369
Figure 9.13 Total trading amounts from 2001 to 2003.
During the generation competition, the power plants under construction were built as
planned to keep the capacity reserve margin above 15% by 2005. At the same time, the De-
mand Side Management (DSM) will be strongly implemented to reduce the peak load as
illustrated in Figure 9.14. To secure the investment resources needed for activating the DSM
program as previously planned, the collection of "Electricity Supply Industry Foundation
Funds" for DSM program is legitimized pursuant to article 49 of the Electricity Business Act.
Figure 9.14 Positive effect of demand side management program
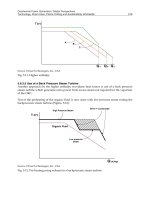
In Korea, the seasonal load-demand pattern can be characterized as follows (See Figure 9.15):
Summer: annual peak load (12:00 ~ 13:00) due to cooling load
Winter: peak load (23:00) due to heating load
Spring: the lowest load of a year without consuming neither cooling nor heating loads Besides,
Figure 9.16 and Figure 9.17 represent the summer peak load (47,385 MW on August 22, 2003)
and the winter peak load (46,387 MW on February 5, 2004), respectively.
Figure 9.15 Seasonal load-demand pattern
Figure 9.16 Hourly load curve for summer peak load on August 22, 2003.
Electricity Infrastructures in the Global Marketplace370
Table 9.7 summarizes the transmission and distribution facilities in Korea
35
. The transmis-
sion lines including both overhead and underground have a length of 28,260 (km) and the
installed transformers totaled 1,672 in 2003. In addition, the distribution lines run radially
for a length of 376,454 (km).
Classification 2000 2001 2002 2003
Transmission
line
(c-km)
Transformer
capacity
(MVA)
Distribution
Facilities
(km,
1.000Set, EA)
765 kV
345 kV
154 kV
664kV below
DC180kV
Total
765 kV
345 KV
154 KV
66 KV below
Total
Route
Length
Supporter
Transformer
595
7.281
16.747
1.727
232
25.582
-
53.115
70,886
1,699
125.700
351.264
6.439
1308.947
662
7.345
17.576
1.540
232
27.355
1.110
63.577
78.119
1.473
144.279
358.328
6.695
1428,510
662
7.497
18.144
1.402
232
27.937
7.110
69.078
83.364
1.286
160.838
366.938
6.875
1546.088
662
7.740
18.595
1,031
232
28.260
7.110
75,660
89.228
1.068
173.066
376.454
7.171
1618.889
Table 9.7 Facilities of transmission and distribution in KOREA
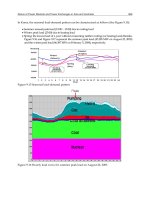
9.6.3 Measures in Power System Operations
Figure 9.18 is a schematic showing six routes connecting metropolitan regions and others as well as a
large amount of real power flows through the designated “flowgates”
36
. More than 40% of system
load is in the metropolitan region, while the majority of generation is in the non-metropolitan re-
gions. Further, most generating units with low generation costs are scattered all over the non-
metropolitan regions.
For the purpose of economic benefits, therefore, real power generation in non-metropolitan
regions increases in parallel with the consumption level, resulting in the power transfer
from the south and central parts of the Korean electric power system to the northwestern
part through one of the most critical corridors of the grid.
Even more striking is the concept of transfer capability that would be eventually bounded
by applicable line ratings, reactive support, and dynamic limitations because greater volume
of power flows into a region in normal states can give rise to cascading failures in the N-1
steady-state security criteria
37, 38
. After privatization of generators, power system engineers
in Korea emphasize that the trend of heavier real power flows into the metropolitan region
will continue or become profound, and that the constraint of the interface flows will be vital
to our national-interest transmission bottlenecks, leading to congestion that significantly
decreases reliability, restricts competition, enhances opportunities for suppliers to exploit
market power, increases prices to customers, and increases infrastructure vulnerabilities.
Figure 9.17 Hourly load curve for winter peak load on February 5, 2004.
Figure 9.18 Total transfer capability in tie lines between metropolitan region and adjacent
regions.
Typically the transmission network planning approach includes a set of fundamentals, some
realistic events, under which the system must be able to operate and specified consequences
that are accepted under the operation
39
. As the electricity sector is getting more and more
liberalized, a number of questions have been raised regarding the grid planning, e.g., does
the market opening require network reinforcement and can the market requirements be an
argument for that reinforcement? The network planning approach now involves a set of
additional parameters like market prices, transmission pricing, and investment policies.
Status of Power Markets and Power Exchanges in Asia and Australia 371
Table 9.7 summarizes the transmission and distribution facilities in Korea
35
. The transmis-
sion lines including both overhead and underground have a length of 28,260 (km) and the
installed transformers totaled 1,672 in 2003. In addition, the distribution lines run radially
for a length of 376,454 (km).
Classification 2000 2001 2002 2003
Transmission
line
(c-km)
Transformer
capacity
(MVA)
Distribution
Facilities
(km,
1.000Set, EA)
765 kV
345 kV
154 kV
664kV below
DC180kV
Total
765 kV
345 KV
154 KV
66 KV below
Total
Route
Length
Supporter
Transformer
595
7.281
16.747
1.727
232
25.582
-
53.115
70,886
1,699
125.700
351.264
6.439
1308.947
662
7.345
17.576
1.540
232
27.355
1.110
63.577
78.119
1.473
144.279
358.328
6.695
1428,510
662
7.497
18.144
1.402
232
27.937
7.110
69.078
83.364
1.286
160.838
366.938
6.875
1546.088
662
7.740
18.595
1,031
232
28.260
7.110
75,660
89.228
1.068
173.066
376.454
7.171
1618.889
Table 9.7 Facilities of transmission and distribution in KOREA
9.6.3 Measures in Power System Operations
Figure 9.18 is a schematic showing six routes connecting metropolitan regions and others as well as a
large amount of real power flows through the designated “flowgates”
36
. More than 40% of system
load is in the metropolitan region, while the majority of generation is in the non-metropolitan re-
gions. Further, most generating units with low generation costs are scattered all over the non-
metropolitan regions.
For the purpose of economic benefits, therefore, real power generation in non-metropolitan
regions increases in parallel with the consumption level, resulting in the power transfer
from the south and central parts of the Korean electric power system to the northwestern
part through one of the most critical corridors of the grid.
Even more striking is the concept of transfer capability that would be eventually bounded
by applicable line ratings, reactive support, and dynamic limitations because greater volume
of power flows into a region in normal states can give rise to cascading failures in the N-1
steady-state security criteria
37, 38
. After privatization of generators, power system engineers
in Korea emphasize that the trend of heavier real power flows into the metropolitan region
will continue or become profound, and that the constraint of the interface flows will be vital
to our national-interest transmission bottlenecks, leading to congestion that significantly
decreases reliability, restricts competition, enhances opportunities for suppliers to exploit
market power, increases prices to customers, and increases infrastructure vulnerabilities.
Figure 9.17 Hourly load curve for winter peak load on February 5, 2004.
Figure 9.18 Total transfer capability in tie lines between metropolitan region and adjacent
regions.
Typically the transmission network planning approach includes a set of fundamentals, some
realistic events, under which the system must be able to operate and specified consequences
that are accepted under the operation
39
. As the electricity sector is getting more and more
liberalized, a number of questions have been raised regarding the grid planning, e.g., does
the market opening require network reinforcement and can the market requirements be an
argument for that reinforcement? The network planning approach now involves a set of
additional parameters like market prices, transmission pricing, and investment policies.
Electricity Infrastructures in the Global Marketplace372
Thus the transition from monopoly to an open electricity market is a global process, which
has been going on for several years. In an overall perspective the open electricity market
means liberalizing the sector to create competition in power generation and supply. The
introduction of the competitive electricity market has resulted in new frameworks and con-
siderations in power system planning and operations.
9.7 Outlook for Power Exchange between Russia, DPRK and ROK
Since the 1990s, many papers have been published dealing with power system interconnec-
tion between Northeast Asian countries. Electricity trading through NEAREST offers mu-
tual benefits, and can be a good countermeasure to solve the environmental and technical
problems caused by the independent system operations of each country. Power exchange
between countries contributes the infrastructure to open trading markets, while intercon-
nected systems between NEA countries will have more technical and economic advantages
when compared with independent system operation conditions. However, this power sys-
tem interconnection could not become a reality until now due to social, economic and politi-
cal regime differences. Basically, the ROK, the DPRK and Russia have the most powerful
potential in NEAREST, when their status and future prospects are considered. These three
countries have different situations and backgrounds on power system interconnection from
technical, economic and political viewpoints. The ROK power system is an island, having
been isolated from the DPRK network in 1945. Also, the ROK is very poor in natural re-
sources and must import 97.4% of the total primary energy consumed domestically. Also,
the ROK has difficulties relating to generation sites. Since the 1980s, the DPRK has suffered
from a deficiency of electricity supply and wants to be supported by the ROK. After the
summit between the DPRK and the ROK in 2000, the DPRK has requested electricity sup-
port with a short-term capacity of 500MW, and a long-term capacity of 2,000MW from the
ROK government. Conversely, East Russia, FER (Far East Russia) and ES (East Siberia), have
plenty of coal, gas and hydro resources. Also, Russia has surplus power plants and genera-
tion potential due to the economic decline since 1990. Russia has plenty of power export
potential. Therefore, this section evaluates the prospect of power exchange considering fu-
ture demand/surplus supply plans and exchangeable power in technical and economic as-
pects.
9.7.1 Power interconnection scenarios for “RFE – DPRK - ROK”
Many scenarios on NEAREST have been published by institutes working on power interconnection
topics, including as ESI, KERI, and others
40-42
. Most of these scenario analyses, however, have simply
estimated the rough parameters of interconnection scenarios, including voltage level, capacity, and
line length of inter-ties. The basic contents and concepts covered by these scenario analyses have been
largely similar to each other. The main scenarios either under discussion, or currently being studied,
are as follows.
9.7.1.1 Potential local interconnections under discussion
Russia has a plan to interconnect its power grid with that of the DPRK. This interconnection might
ultimately be extended to the ROK. A number of problems, however, including obtaining financing,
pose significant barriers to this project. Table 9.8 describes the general ratings of this interconnection
plan. This project will include a 380km, 500 kV DC line between VLADIVOSTOK and CHEONG-
JIN. This interconnected line will be operated at 220 kV AC during the first stage of the project, and
will be changed to 500 kV AC operation after the 500 kV line between “CHUGUEVKA-NAHODKA-
VLADIVOSTOK” is put into operation. In its final stage, the line would be modified as a 500 kV
HVDC line in the future.
Power volume to be transmitted (mln. kWh) 1500 - 2500
Load to be transmitted (MW) 300 - 500
Frequency (Hz) 50
Voltage (kV) 220/500
Length of line in Russian territory (km) 250
Length of line in DPRK territory (km) 130
Cost of construction (mln. USD) 160 - 180
Period of construction (years) 3 - 4
Period of investment repayment (years) 8 - 10
Table 9.8 Overview of interconnected system between FER-DPRK
Also, the ROK and the DPRK are seeking to develop an industrial complex at GAESUNG,
near the shared border of the two countries (but inside the DPRK). The required electricity
for the GAESUNG industrial complex might be supplied by the ROK. This project is utterly
dependent on the political situation between the two parties. At the first stage, the ROK and
the DPRK agreed to construct two distribution circuits rated 210MW, which are now under
construction. Finally, the basic rating of transmission line supplying electricity for the GAE-
SUNG industrial complex is 154Kv, 200 MW with a length of 40km.
9.7.1.2 New scenarios including KEDO N/P
Basically, KERI investigated new six interconnection scenarios for the “RFE-DPRK-ROK” intercon-
nection
40
. "Russia-DPRK-ROK" interconnection can present various scenarios according to the fol-
lowing factors and hypotheses.
i. Whether KEDO nuclear power plant is included in NEAREST or not.
ii. Accomplishment of "VLADIVOSTOK-CHEONGJIN” local interconnected system under dis-
connection to the DPRK system, and the future possibility of re-connection to the DPRK sys-
tem of CHEONGJIN load.
iii. Power supply plan to GAESUNG industrial complex under disconnection to the DPRK sys-
tem and future possibility on re-connection to the DPRK system.
iv. Capacity and voltage of the interconnected system.
For example, in order to include the KEDO N/P in a power interconnection network, we
can consider the interconnection route “VLADIVOSTOK-SINPO” as a tentative hypothesis.
This scenario is somewhat different from the existing scenario for a “VLADIVOSTOK-
CHEONGJIN” interconnection that is under discussion between Russia and the DPRK. The
“VLADIVOSTOK-SINPO” scenario could be one of the alternatives for the effective utiliza-
tion of the KEDO N/P. If this scenario is implemented, after the commissioning of KEDO
N/P, by means of the interconnection the DPRK can earn revenues by trading seasonal sur-
plus electricity, or can be supported with electricity imports at times of seasonal shortages of
Status of Power Markets and Power Exchanges in Asia and Australia 373
Thus the transition from monopoly to an open electricity market is a global process, which
has been going on for several years. In an overall perspective the open electricity market
means liberalizing the sector to create competition in power generation and supply. The
introduction of the competitive electricity market has resulted in new frameworks and con-
siderations in power system planning and operations.
9.7 Outlook for Power Exchange between Russia, DPRK and ROK
Since the 1990s, many papers have been published dealing with power system interconnec-
tion between Northeast Asian countries. Electricity trading through NEAREST offers mu-
tual benefits, and can be a good countermeasure to solve the environmental and technical
problems caused by the independent system operations of each country. Power exchange
between countries contributes the infrastructure to open trading markets, while intercon-
nected systems between NEA countries will have more technical and economic advantages
when compared with independent system operation conditions. However, this power sys-
tem interconnection could not become a reality until now due to social, economic and politi-
cal regime differences. Basically, the ROK, the DPRK and Russia have the most powerful
potential in NEAREST, when their status and future prospects are considered. These three
countries have different situations and backgrounds on power system interconnection from
technical, economic and political viewpoints. The ROK power system is an island, having
been isolated from the DPRK network in 1945. Also, the ROK is very poor in natural re-
sources and must import 97.4% of the total primary energy consumed domestically. Also,
the ROK has difficulties relating to generation sites. Since the 1980s, the DPRK has suffered
from a deficiency of electricity supply and wants to be supported by the ROK. After the
summit between the DPRK and the ROK in 2000, the DPRK has requested electricity sup-
port with a short-term capacity of 500MW, and a long-term capacity of 2,000MW from the
ROK government. Conversely, East Russia, FER (Far East Russia) and ES (East Siberia), have
plenty of coal, gas and hydro resources. Also, Russia has surplus power plants and genera-
tion potential due to the economic decline since 1990. Russia has plenty of power export
potential. Therefore, this section evaluates the prospect of power exchange considering fu-
ture demand/surplus supply plans and exchangeable power in technical and economic as-
pects.
9.7.1 Power interconnection scenarios for “RFE – DPRK - ROK”
Many scenarios on NEAREST have been published by institutes working on power interconnection
topics, including as ESI, KERI, and others
40-42
. Most of these scenario analyses, however, have simply
estimated the rough parameters of interconnection scenarios, including voltage level, capacity, and
line length of inter-ties. The basic contents and concepts covered by these scenario analyses have been
largely similar to each other. The main scenarios either under discussion, or currently being studied,
are as follows.
9.7.1.1 Potential local interconnections under discussion
Russia has a plan to interconnect its power grid with that of the DPRK. This interconnection might
ultimately be extended to the ROK. A number of problems, however, including obtaining financing,
pose significant barriers to this project. Table 9.8 describes the general ratings of this interconnection
plan. This project will include a 380km, 500 kV DC line between VLADIVOSTOK and CHEONG-
JIN. This interconnected line will be operated at 220 kV AC during the first stage of the project, and
will be changed to 500 kV AC operation after the 500 kV line between “CHUGUEVKA-NAHODKA-
VLADIVOSTOK” is put into operation. In its final stage, the line would be modified as a 500 kV
HVDC line in the future.
Power volume to be transmitted (mln. kWh) 1500 - 2500
Load to be transmitted (MW) 300 - 500
Frequency (Hz) 50
Voltage (kV) 220/500
Length of line in Russian territory (km) 250
Length of line in DPRK territory (km) 130
Cost of construction (mln. USD) 160 - 180
Period of construction (years) 3 - 4
Period of investment repayment (years) 8 - 10
Table 9.8 Overview of interconnected system between FER-DPRK
Also, the ROK and the DPRK are seeking to develop an industrial complex at GAESUNG,
near the shared border of the two countries (but inside the DPRK). The required electricity
for the GAESUNG industrial complex might be supplied by the ROK. This project is utterly
dependent on the political situation between the two parties. At the first stage, the ROK and
the DPRK agreed to construct two distribution circuits rated 210MW, which are now under
construction. Finally, the basic rating of transmission line supplying electricity for the GAE-
SUNG industrial complex is 154Kv, 200 MW with a length of 40km.
9.7.1.2 New scenarios including KEDO N/P
Basically, KERI investigated new six interconnection scenarios for the “RFE-DPRK-ROK” intercon-
nection
40
. "Russia-DPRK-ROK" interconnection can present various scenarios according to the fol-
lowing factors and hypotheses.
i. Whether KEDO nuclear power plant is included in NEAREST or not.
ii. Accomplishment of "VLADIVOSTOK-CHEONGJIN” local interconnected system under dis-
connection to the DPRK system, and the future possibility of re-connection to the DPRK sys-
tem of CHEONGJIN load.
iii. Power supply plan to GAESUNG industrial complex under disconnection to the DPRK sys-
tem and future possibility on re-connection to the DPRK system.
iv. Capacity and voltage of the interconnected system.
For example, in order to include the KEDO N/P in a power interconnection network, we
can consider the interconnection route “VLADIVOSTOK-SINPO” as a tentative hypothesis.
This scenario is somewhat different from the existing scenario for a “VLADIVOSTOK-
CHEONGJIN” interconnection that is under discussion between Russia and the DPRK. The
“VLADIVOSTOK-SINPO” scenario could be one of the alternatives for the effective utiliza-
tion of the KEDO N/P. If this scenario is implemented, after the commissioning of KEDO
N/P, by means of the interconnection the DPRK can earn revenues by trading seasonal sur-
plus electricity, or can be supported with electricity imports at times of seasonal shortages of
Electricity Infrastructures in the Global Marketplace374
electricity. This implies that all of the interconnected countries in this scenario can reap ben-
efits by trading seasonal surplus electricity.
9.7.2 Estimated prospective export/import potential
9.7.2.1 Power industry of the ROK
Table 9.9 describes the present status and future projections for installed generating capacity
in the ROK according to the 1
st
power supply/demand plan after restructuring. The in-
stalled capacity is expected to rise to 77,024MW by 2015. In terms of the plant mix, the share
of oil and coal plants are projected to decrease over the next 12 years, while the share of nuc-
lear capacity is projected to increase.
Table 9.10 describes the present and future total electricity production in the ROK. As
shown in this table, the expectation is that the total generation portion provided by nuclear
power plants will rise slightly in the future. In contrast, the fraction of generation provided
by thermal plants such as coal- and oil-fired units will decrease.
Year Nuclear Coal Gas Oil Hydro SUM
2002
15716
(29.2%)
15931
(29.6%)
13618
(25.3%)
4660
(8.7%)
3876
(7.2%)
53801
2005
17716
(28.6%)
18165
(29.4%)
16814
(27.2%)
4667
(7.5%)
4485
(7.3%)
61847
2010
23116
(29.3%)
24265
(30.7%)
20437
(25.9%)
4817
(6.1%)
6385
(8.1%)
72635
2015
26637
(34.6%)
22240
(28.9%)
19550
(25.4%)
2212
(2.9%)
6385
(8.3%)
77024
Table 9.9 Present and future projected generating capacity in the ROK (MW)
Year Nuclear Coal Gas Oil Hydro Etc. SUM
2002
122.8
(43.2%)
117.9
(41.5%)
29.7
(10.4%)
26.7
(2.8%)
6.0
(2.1%)
-
(0.0%)
344.8
2005
134.1
(40.6%)
132.7
(40.2%)
45.6
(13.8%)
24.8
(2.9%)
6.7
(2.0%)
1.4
(0.4%)
399.0
2010
166.7
(42.1%)
175.2
(44.3%)
26.5
(6.7%)
17.9
(4.5%)
8.5
(2.2%)
1.0
(0.3%)
435.0
2015
210.3
(47.2%)
165.4
(37.1%)
49.0
(11.0%)
12.0
(2.7%)
9.3
(2.1%) -(0.0%)
445.9
Table 9.10 Present and future projected electricity production in the ROK (TWh)
Although the projections shown in Table 9.9 indicate that nuclear power’s share of future
ROK installed capacity and electricity production are expected to be higher than they are at
present, it should be noted that these projections should be considered just as long-term
targets. Factors such as the shortage of land in the ROK suitable for nuclear plant construc-
tion, and public resistance to building power plants, especially nuclear plants (the "NIMBY",
or "not in my back yard" movement) will likely make these targets difficult to achieve. As a
result of the "NIMBY" movement in the ROK, and the public fear of atomic energy, construction of
new nuclear power plants faces difficulties. Furthermore, building thermal power plants fueled with
coal, oil and gas is problematic because of the constraints on GHG emissions specified under the
Kyoto protocol. Therefore, as a matter of government policy, it is necessary to establish a future gen-
eral plan and countermeasures that will help to assure that future electricity demand is met, while
still reducing GHG emissions.
9.7.2.2 Power industry of DPRK
Even though we have some DPRK power industry and power system data, most of the DPRK data
is quite uncertain
43
. The DPRK had been suffering from electricity deficiency since the 1980s and
most of its hydro/thermal plants are out of date. Because of this, the DPRK had not published formal
statistics since the late 1990s, so we could not use existing outdated formal statistics when evaluating
the prospect of the DPRK power balance. We could only estimate and treat the DPRK system as a
black box.
9.7.2.3 RFE power balance and export potential
A study of the power export potential of East Russia (ER), including East Siberia (ES) and
Russian Far East (RFE), up to 2020 was done in
44
. In Tables 9.11-9.13, min/max value is
based on the future minimum/maximum domestic demand. Three categories of power ex-
port potential are identified. The first one is power that can be additionally generated by
existing power plants up to 2005. The second category of power export includes power from
power plants that can be additionally generated during the summer season. The third cate-
gory of power export potential includes power generation from power plants that should be
additionally constructed in ER for export purposes.
Tables 9.11, 9.12 indicate power balances for the RFE interconnected power system compiled
using data prepared by ESI for NEAREST DB. Hydropower capacity is supposed to be sig-
nificantly developed in the RFE, according to power balances in Tables 9.11, 9.12.
Bureyskaya HPP, with total capacity of 2000 MW (6333 MW) and average yearly genera-
tion of 7.1 TWh, is constructed, with a third unit phased in by the end of 2004. Three more
units were planned by 2009. Nizhne-Bureyskaya HPP, with total capacity of 428 MW (4107
MW) and average yearly generation of 1.6 TWh, is the second stage of the Bureysk cascade
of HPPs. It is supposed to be completed by 2010. Cascade of Nizhnezeysk HPPs, of an in-
stalled capacity and average power generation of 349 MW and 2,12 TWh/year respectively,
will be completed in the period 2010-2012. Additionally Urgalsk HPP-1, with a power gen-
eration of 600 MW and 1.8 TWh/year, and Dalnerechensk hydropower complex, with a
generation capacity of 595 MW and 1.4 TWh/year, are supposed to be introduced by 2015-
2020, depending on scenarios of rates of electricity consumption growth in the RFE. Steam
TPPs are not supposed to be developed in the RFE. In fact, they are planned to retire, and new steam
TPP capacity is not to be commissioned. Development of co-generation TPPs is mainly determined
by the demand of heat consumers.
Status of Power Markets and Power Exchanges in Asia and Australia 375
electricity. This implies that all of the interconnected countries in this scenario can reap ben-
efits by trading seasonal surplus electricity.
9.7.2 Estimated prospective export/import potential
9.7.2.1 Power industry of the ROK
Table 9.9 describes the present status and future projections for installed generating capacity
in the ROK according to the 1
st
power supply/demand plan after restructuring. The in-
stalled capacity is expected to rise to 77,024MW by 2015. In terms of the plant mix, the share
of oil and coal plants are projected to decrease over the next 12 years, while the share of nuc-
lear capacity is projected to increase.
Table 9.10 describes the present and future total electricity production in the ROK. As
shown in this table, the expectation is that the total generation portion provided by nuclear
power plants will rise slightly in the future. In contrast, the fraction of generation provided
by thermal plants such as coal- and oil-fired units will decrease.
Year Nuclear
Coal Gas Oil Hydro SUM
2002
15716
(29.2%)
15931
(29.6%)
13618
(25.3%)
4660
(8.7%)
3876
(7.2%)
53801
2005
17716
(28.6%)
18165
(29.4%)
16814
(27.2%)
4667
(7.5%)
4485
(7.3%)
61847
2010
23116
(29.3%)
24265
(30.7%)
20437
(25.9%)
4817
(6.1%)
6385
(8.1%)
72635
2015
26637
(34.6%)
22240
(28.9%)
19550
(25.4%)
2212
(2.9%)
6385
(8.3%)
77024
Table 9.9 Present and future projected generating capacity in the ROK (MW)
Year Nuclear Coal Gas Oil Hydro Etc. SUM
2002
122.8
(43.2%)
117.9
(41.5%)
29.7
(10.4%)
26.7
(2.8%)
6.0
(2.1%)
-
(0.0%)
344.8
2005
134.1
(40.6%)
132.7
(40.2%)
45.6
(13.8%)
24.8
(2.9%)
6.7
(2.0%)
1.4
(0.4%)
399.0
2010
166.7
(42.1%)
175.2
(44.3%)
26.5
(6.7%)
17.9
(4.5%)
8.5
(2.2%)
1.0
(0.3%)
435.0
2015
210.3
(47.2%)
165.4
(37.1%)
49.0
(11.0%)
12.0
(2.7%)
9.3
(2.1%) -(0.0%)
445.9
Table 9.10 Present and future projected electricity production in the ROK (TWh)
Although the projections shown in Table 9.9 indicate that nuclear power’s share of future
ROK installed capacity and electricity production are expected to be higher than they are at
present, it should be noted that these projections should be considered just as long-term
targets. Factors such as the shortage of land in the ROK suitable for nuclear plant construc-
tion, and public resistance to building power plants, especially nuclear plants (the "NIMBY",
or "not in my back yard" movement) will likely make these targets difficult to achieve. As a
result of the "NIMBY" movement in the ROK, and the public fear of atomic energy, construction of
new nuclear power plants faces difficulties. Furthermore, building thermal power plants fueled with
coal, oil and gas is problematic because of the constraints on GHG emissions specified under the
Kyoto protocol. Therefore, as a matter of government policy, it is necessary to establish a future gen-
eral plan and countermeasures that will help to assure that future electricity demand is met, while
still reducing GHG emissions.
9.7.2.2 Power industry of DPRK
Even though we have some DPRK power industry and power system data, most of the DPRK data
is quite uncertain
43
. The DPRK had been suffering from electricity deficiency since the 1980s and
most of its hydro/thermal plants are out of date. Because of this, the DPRK had not published formal
statistics since the late 1990s, so we could not use existing outdated formal statistics when evaluating
the prospect of the DPRK power balance. We could only estimate and treat the DPRK system as a
black box.
9.7.2.3 RFE power balance and export potential
A study of the power export potential of East Russia (ER), including East Siberia (ES) and
Russian Far East (RFE), up to 2020 was done in
44
. In Tables 9.11-9.13, min/max value is
based on the future minimum/maximum domestic demand. Three categories of power ex-
port potential are identified. The first one is power that can be additionally generated by
existing power plants up to 2005. The second category of power export includes power from
power plants that can be additionally generated during the summer season. The third cate-
gory of power export potential includes power generation from power plants that should be
additionally constructed in ER for export purposes.
Tables 9.11, 9.12 indicate power balances for the RFE interconnected power system compiled
using data prepared by ESI for NEAREST DB. Hydropower capacity is supposed to be sig-
nificantly developed in the RFE, according to power balances in Tables 9.11, 9.12.
Bureyskaya HPP, with total capacity of 2000 MW (6333 MW) and average yearly genera-
tion of 7.1 TWh, is constructed, with a third unit phased in by the end of 2004. Three more
units were planned by 2009. Nizhne-Bureyskaya HPP, with total capacity of 428 MW (4107
MW) and average yearly generation of 1.6 TWh, is the second stage of the Bureysk cascade
of HPPs. It is supposed to be completed by 2010. Cascade of Nizhnezeysk HPPs, of an in-
stalled capacity and average power generation of 349 MW and 2,12 TWh/year respectively,
will be completed in the period 2010-2012. Additionally Urgalsk HPP-1, with a power gen-
eration of 600 MW and 1.8 TWh/year, and Dalnerechensk hydropower complex, with a
generation capacity of 595 MW and 1.4 TWh/year, are supposed to be introduced by 2015-
2020, depending on scenarios of rates of electricity consumption growth in the RFE. Steam
TPPs are not supposed to be developed in the RFE. In fact, they are planned to retire, and new steam
TPP capacity is not to be commissioned. Development of co-generation TPPs is mainly determined
by the demand of heat consumers.
Electricity Infrastructures in the Global Marketplace376
Capacit
y
, peak
load and trans-
fe
r
2001
2005
201
0
2015
202
0
Min Max Min
M
a
x
Min Max Min Max
Hydro 1.33 2.2 2.2 4.0 4.0 4.7 5.3 4.7 5.3
Steam turbine 2.61 2.5 2.5 2.4 2.4 2.5 2.5 1.6 1.6
Co
-
g
eneratio
n
3.17
3.
5
3.
5
3.
6
3.
8
3.
8
4.3
5.4
5.4
Nuclea
r
-
-
-
-
-
0.
6
0.
6
1.3
1.3
Total ca
pa
i
t
y
7.11
8.
2
8.
2
10.
0
10.
2
11.
6
12.7
13.
0
13.
6
Peak load 4.74 5.33 5.77 5.80 6.74 6.33 7.96 6.93 8.85
Power tr
a
n
fer to
ad
j
a
cent re
g
ions
0.04 0.32 0.35 0.85 0.85 0.85 0.85 0.85 0.85
Peak load and
p
ower transfe
r
4.78 5.65 6.12 6.65 7.59 7.18 8.81 7.78 9.7
Capacit
y
r
e
-
serve rate, %
48.7 45.1 34.0 50.4 34.4 61.6 44.2 67.1 40.2
Table 9.11 Capacity balance for RFE IPS, GW
Power
g
e
n
eration,
electricity con-
sumption and
tra
n
sfe
r
2001
2005 2010 2015 2020
Min Max Min Max Min Max Min Max
H
y
dro
4.85 8.9 8.9 13.7 13.7 16.3 16.3 17.0 19.0
Steam tu
r
bine
6.05 6.8 6.8 5.2 6.6 4.9 7.7 1.2 3.0
Co
-
g
eneratio
n
14.6 14.5 16.6 17.1 19.9 17.7 22.8 18.9 21.6
Nuclea
r
-
-
-
-
-
-
-
3.
8
7.
8
Total
g
ene
r
tio
n
25.
5
30.
2
32.3
36.
0
40.
2
38.9
46.
8
40.9 51.4
Electricit
y
con
-
sum
p
tio
n
25.2 28.5 30.6 31.5 35.7 34.4 42.3 37.4 46.9
Electricit
y
transfer
to adjacent re-
g
ions
0.29 1.7 1.7 4.5 4.5 4.5 4.5 4.5 4.5
Electricit
y
con
-
sumption and
tra
n
sfer
25.5 30.2 32.3 36.0 40.2 38.9 46.8 41.9 51.4
Table 9.12 Electricity balance for RFE IPS, TWh/year
As can be seen from Table 9.13, power export potential, which does not require additional
capacity commissioning (apart from that required for meeting domestic power loads), and,
therefore, additional investment, can be quite sufficient, exceeding 4 GW of capacity in
summer, and 2 GW in winter, and 16-18 TWh/year of power generation in the beginning of
the period under consideration. At the end of the considered period, export potential de-
clines to about 2.5-3.0 GW of capacity in summer only (because of exhausting existing exces-
sive capacity), and 5-6 TWh/year of power generation.
Potential 2005
2010 2015 2020
Min Max Min Max Min Max
Capacity,
GW
Winter 2.4 1.2 0.4 0.7 0.0 0.0 0.0
Summer 4.3 3.3 2.8 3.0 2.9 2.5 3.2
Power generation, TWh 18.1 11.5 7.4 8.6 5.8 5.0 6.4
Table 9.13 Total RFE Power Export Potential of Existing Plants
Power plants
Installed
capacity, GW
Annual average
generation, TWh
Years of commissioning
Hydro
Bureysk (together with
Nizhne-reysk)
2.428
8.7
By 2010
Cascade of
Nizhnezeysk
0.349 2.12 By 2015
Dalnerechensk 0.595 1.4 By 2015
Urgalsk-1 0.6 1.8 By 2015
Subtotal 3.972 14.02 -
Nuclea
r
Primorye
1.3
9.75
By 2020
-
Total 5.27 23.77 -
Table 9.14 Power plant capacities to be commissioned in RFE by 2020
Power plants Installed capacity, GW Average yearly generation, TWh
Hydro
Urgalsk-1 0-0.6 0-1.8
Gilyuisk 0.38 1.15
South Yakutian hydropow-
er complex, including:
5.0 23.45
Cascade of Sredne-Uchursk
and Uchursk HPPs
3.7 17.2
Cascade of Idjeksk and
Timtonsk HPPs
1.3 6.25
Khingansk 1.2 5.8
Subtotal 6.58-7.18 30.4-32.2
Thermal
Sakhalin (Gas) 4.0 26.0
Sakhalin (Coal) 2.0 13.0
Urgalsk (Coal) 1.2 7.5
Subtotal
7.2 46.5
Nuclea
r
Far East 2.5 18
Total 16.28-16.88 94.9-96.7
Table 9.15 Power Plant Capacities to be commissioned in RFE after 2020
Status of Power Markets and Power Exchanges in Asia and Australia 377
Capacit
y
, peak
load and trans-
fe
r
2001
2005
201
0
2015
202
0
Min Max Min
M
a
x
Min Max Min Max
Hydro 1.33 2.2 2.2 4.0 4.0 4.7 5.3 4.7 5.3
Steam turbine 2.61 2.5 2.5 2.4 2.4 2.5 2.5 1.6 1.6
Co
-
g
eneratio
n
3.17
3.
5
3.
5
3.
6
3.
8
3.
8
4.3
5.4
5.4
Nuclea
r
-
-
-
-
-
0.
6
0.
6
1.3
1.3
Total ca
pa
i
t
y
7.11
8.
2
8.
2
10.
0
10.
2
11.
6
12.7
13.
0
13.
6
Peak load 4.74 5.33 5.77 5.80 6.74 6.33 7.96 6.93 8.85
Power tr
a
n
fer to
ad
j
a
cent re
g
ions
0.04 0.32 0.35 0.85 0.85 0.85 0.85 0.85 0.85
Peak load and
p
ower transfe
r
4.78 5.65 6.12 6.65 7.59 7.18 8.81 7.78 9.7
Capacit
y
r
e
-
serve rate, %
48.7 45.1 34.0 50.4 34.4 61.6 44.2 67.1 40.2
Table 9.11 Capacity balance for RFE IPS, GW
Power
g
e
n
eration,
electricity con-
sumption and
tra
n
sfe
r
2001
2005 2010 2015 2020
Min Max Min Max Min Max Min Max
H
y
dro
4.85 8.9 8.9 13.7 13.7 16.3 16.3 17.0 19.0
Steam tu
r
bine
6.05 6.8 6.8 5.2 6.6 4.9 7.7 1.2 3.0
Co
-
g
eneratio
n
14.6 14.5 16.6 17.1 19.9 17.7 22.8 18.9 21.6
Nuclea
r
-
-
-
-
-
-
-
3.
8
7.
8
Total
g
ene
r
tio
n
25.
5
30.
2
32.3
36.
0
40.
2
38.9
46.
8
40.9 51.4
Electricit
y
con
-
sum
p
tio
n
25.2 28.5 30.6 31.5 35.7 34.4 42.3 37.4 46.9
Electricit
y
transfer
to adjacent re-
g
ions
0.29 1.7 1.7 4.5 4.5 4.5 4.5 4.5 4.5
Electricit
y
con
-
sumption and
tra
n
sfer
25.5 30.2 32.3 36.0 40.2 38.9 46.8 41.9 51.4
Table 9.12 Electricity balance for RFE IPS, TWh/year
As can be seen from Table 9.13, power export potential, which does not require additional
capacity commissioning (apart from that required for meeting domestic power loads), and,
therefore, additional investment, can be quite sufficient, exceeding 4 GW of capacity in
summer, and 2 GW in winter, and 16-18 TWh/year of power generation in the beginning of
the period under consideration. At the end of the considered period, export potential de-
clines to about 2.5-3.0 GW of capacity in summer only (because of exhausting existing exces-
sive capacity), and 5-6 TWh/year of power generation.
Potential 2005
2010 2015 2020
Min Max Min Max Min Max
Capacity,
GW
Winter 2.4 1.2 0.4 0.7 0.0 0.0 0.0
Summer 4.3 3.3 2.8 3.0 2.9 2.5 3.2
Power generation, TWh 18.1 11.5 7.4 8.6 5.8 5.0 6.4
Table 9.13 Total RFE Power Export Potential of Existing Plants
Power plants
Installed
capacity, GW
Annual average
generation, TWh
Years of commissioning
Hydro
Bureysk (together with
Nizhne-reysk)
2.428
8.7
By 2010
Cascade of
Nizhnezeysk
0.349 2.12 By 2015
Dalnerechensk 0.595 1.4 By 2015
Urgalsk-1 0.6 1.8 By 2015
Subtotal 3.972 14.02 -
Nuclear
Primorye
1.3
9.75
By 2020
-
Total 5.27 23.77 -
Table 9.14 Power plant capacities to be commissioned in RFE by 2020
Power plants Installed capacity, GW Average yearly generation, TWh
Hydro
Urgalsk-1 0-0.6 0-1.8
Gilyuisk 0.38 1.15
South Yakutian hydropow-
er complex, including:
5.0 23.45
Cascade of Sredne-Uchursk
and Uchursk HPPs
3.7 17.2
Cascade of Idjeksk and
Timtonsk HPPs
1.3 6.25
Khingansk 1.2 5.8
Subtotal 6.58-7.18 30.4-32.2
Thermal
Sakhalin (Gas) 4.0 26.0
Sakhalin (Coal) 2.0 13.0
Urgalsk (Coal) 1.2 7.5
Subtotal
7.2 46.5
Nuclear
Far East 2.5 18
Total 16.28-16.88 94.9-96.7
Table 9.15 Power Plant Capacities to be commissioned in RFE after 2020
Electricity Infrastructures in the Global Marketplace378
Table 9.14 and Table 9.15 shows prospective power plants, which can be constructed within
(or close to) the area of the RFE IPS in and beyond 2020. As can be seen from Table 9.15, the
total power potential of the third category can exceed 16 GW and 95 TWh/year. In addition
to this potential, construction of the Tugursk tidal power plant, with a capacity of nearly 7
GW and a yearly power generation of 17 TWh, can be possible beyond 2025-2030.
9.7.3 Admissible Interconnected Capacity in Technical Viewpoints
9.7.3.1 Evaluation of maximum exchangeable power
An evaluation of maximum exchangeable power was performed by KERI
45, 46
. It can be evaluated by
taking into account the following technical aspects, such as ROW (Right of Way) and system con-
straints. ROW constraint means the geographical constraints that the interconnected line should pass
through. Also, system constraints include technical problems, such as load flow and stability analy-
sis. The study results of technical aspects are as follows.
ROW constraint: Considering the geographical situation between Russia and the Korean
peninsula, a two-bipole system having a capacity of 7 GW can be built.
Load flow analysis: There is no violation of overload and voltage in a steady state up to
7 GW of inflow power. However, in N-1 contingency, some violations happen as the inflow
power exceeds 4 GW. Therefore, 4 GW seems to be the maximum exchangeable power.
Dynamic analysis: The power system frequency of the ROK can keep the standard when
losing 2 GW of power. However, loss of more than 3 GW of power makes frequency violate
the standard. Considering a one-bipole trip, 4 GW is the maximum exchangeable power.
Finally, we can say that 4 GW of power exchange is the maximum exchangeable power from
a technical viewpoint between Russia and the ROK at present status, and this result could
satisfy the security points.
9.7.3.2 Evaluation of minimum exchangeable power
Minimum exchangeable power is evaluated through a comparison of total costs and benefits
of the interconnected line during its life cycle span of 30 years. The total cost of intercon-
nected lines, life cycle costs, consist of initial investment and operating costs. Initial costs
include the construction cost of transmission lines and converter stations, operating costs
means the maintenance costs of transmission lines and converter stations. The benefit of
interconnection comes from the electricity tariff difference between the ROK and Russia.
The electricity tariff difference in 2000 was $0.0383/kWh, but this difference has been get-
ting decreased because the annual rate of increase for electricity tariffs in Russia will be
higher than that of the ROK. Table 9.16 shows the total cost and benefits of interconnected
lines. If 1 GW or 2 GW of power is exchanged between the ROK and Russia, the total cost is
much more than the accrued benefits, a situation that cannot assure an economic advantage.
However, more than 3 GW of exchange power can guarantee the interconnection project
will be in the black. Therefore, we can propose that minimum exchangeable power, from an
economic viewpoint, will be 3 GW.
Exchange
power
Cost (billion $) Benefit (billion $)
1GW 4.13 3.16
2GW 6.60 6.33
3GW 7.82 9.49
4GW 10.56 12.65
Table 9.16 Total cost and benefits
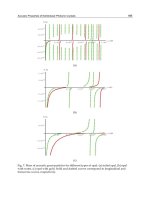
Benefits are affected by a decrease in the rate of electricity tariff differences between the
ROK and Russia. The lower the decreasing rate is, the more we can expect benefits. Figure
9.19 shows the sensitivity of benefits with variations of the decrease rate. In this figure, the
horizontal axis is the decrease rate and vertical axis shows benefits. In the case of 1GW of
exchange power, the benefit is $5.24billion, with a 1% decreasing rate, but the benefit is re-
duced to $2.11billion with a 9% decreasing rate. With a 5% decreasing rate, more than 3GW
of exchange power is needed to assure economic feasibility. More than 1GW of exchange
power, with a 1% decreasing rate makes the interconnection project beneficial, but if de-
creasing rate increases over 7%, the cost is larger than the benefit with 1 GW to 4 GW of ex-
change power. Figure 9.20 shows the Benefit/Cost ratio with a 5% decreasing rate. In this
figure, the horizontal axis means exchange power and vertical axis means B/C ratio. As ex-
change power grows, B/C ratio also increases up to 3 GW. However, B/C ratio decreases
from more than 4 GW, as shown in Figure 9.20. So, we can say that ranging from 3 GW to
4 GW is a more reasonable exchange power in economic terms.
As a result, the minimum exchangeable power is about 3GW, and optimal exchangeable
power range, considering technical and economic viewpoints, is expected to 3~4 GW.
Figure 9.19 Sensitivity of benefit to variations in decreasing rate.
Billion
,
$
Status of Power Markets and Power Exchanges in Asia and Australia 379
Table 9.14 and Table 9.15 shows prospective power plants, which can be constructed within
(or close to) the area of the RFE IPS in and beyond 2020. As can be seen from Table 9.15, the
total power potential of the third category can exceed 16 GW and 95 TWh/year. In addition
to this potential, construction of the Tugursk tidal power plant, with a capacity of nearly 7
GW and a yearly power generation of 17 TWh, can be possible beyond 2025-2030.
9.7.3 Admissible Interconnected Capacity in Technical Viewpoints
9.7.3.1 Evaluation of maximum exchangeable power
An evaluation of maximum exchangeable power was performed by KERI
45, 46
. It can be evaluated by
taking into account the following technical aspects, such as ROW (Right of Way) and system con-
straints. ROW constraint means the geographical constraints that the interconnected line should pass
through. Also, system constraints include technical problems, such as load flow and stability analy-
sis. The study results of technical aspects are as follows.
ROW constraint: Considering the geographical situation between Russia and the Korean
peninsula, a two-bipole system having a capacity of 7 GW can be built.
Load flow analysis: There is no violation of overload and voltage in a steady state up to
7 GW of inflow power. However, in N-1 contingency, some violations happen as the inflow
power exceeds 4 GW. Therefore, 4 GW seems to be the maximum exchangeable power.
Dynamic analysis: The power system frequency of the ROK can keep the standard when
losing 2 GW of power. However, loss of more than 3 GW of power makes frequency violate
the standard. Considering a one-bipole trip, 4 GW is the maximum exchangeable power.
Finally, we can say that 4 GW of power exchange is the maximum exchangeable power from
a technical viewpoint between Russia and the ROK at present status, and this result could
satisfy the security points.
9.7.3.2 Evaluation of minimum exchangeable power
Minimum exchangeable power is evaluated through a comparison of total costs and benefits
of the interconnected line during its life cycle span of 30 years. The total cost of intercon-
nected lines, life cycle costs, consist of initial investment and operating costs. Initial costs
include the construction cost of transmission lines and converter stations, operating costs
means the maintenance costs of transmission lines and converter stations. The benefit of
interconnection comes from the electricity tariff difference between the ROK and Russia.
The electricity tariff difference in 2000 was $0.0383/kWh, but this difference has been get-
ting decreased because the annual rate of increase for electricity tariffs in Russia will be
higher than that of the ROK. Table 9.16 shows the total cost and benefits of interconnected
lines. If 1 GW or 2 GW of power is exchanged between the ROK and Russia, the total cost is
much more than the accrued benefits, a situation that cannot assure an economic advantage.
However, more than 3 GW of exchange power can guarantee the interconnection project
will be in the black. Therefore, we can propose that minimum exchangeable power, from an
economic viewpoint, will be 3 GW.
Exchange
power
Cost (billion $) Benefit (billion $)
1GW 4.13 3.16
2GW 6.60 6.33
3GW 7.82 9.49
4GW 10.56 12.65
Table 9.16 Total cost and benefits
Benefits are affected by a decrease in the rate of electricity tariff differences between the
ROK and Russia. The lower the decreasing rate is, the more we can expect benefits. Figure
9.19 shows the sensitivity of benefits with variations of the decrease rate. In this figure, the
horizontal axis is the decrease rate and vertical axis shows benefits. In the case of 1GW of
exchange power, the benefit is $5.24billion, with a 1% decreasing rate, but the benefit is re-
duced to $2.11billion with a 9% decreasing rate. With a 5% decreasing rate, more than 3GW
of exchange power is needed to assure economic feasibility. More than 1GW of exchange
power, with a 1% decreasing rate makes the interconnection project beneficial, but if de-
creasing rate increases over 7%, the cost is larger than the benefit with 1 GW to 4 GW of ex-
change power. Figure 9.20 shows the Benefit/Cost ratio with a 5% decreasing rate. In this
figure, the horizontal axis means exchange power and vertical axis means B/C ratio. As ex-
change power grows, B/C ratio also increases up to 3 GW. However, B/C ratio decreases
from more than 4 GW, as shown in Figure 9.20. So, we can say that ranging from 3 GW to
4 GW is a more reasonable exchange power in economic terms.
As a result, the minimum exchangeable power is about 3GW, and optimal exchangeable
power range, considering technical and economic viewpoints, is expected to 3~4 GW.
Figure 9.19 Sensitivity of benefit to variations in decreasing rate.
Billion
,
$
Electricity Infrastructures in the Global Marketplace380
Figure 9.20 B/C Ratio with a 5% decreasing rate.
Thus, above study examines the future outlook of exchange power between the ROK, the
DPRK and RFE from technical and economic viewpoints. The main results of this study on
power system interconnection are as follows.
1. Excessive capacity and power generation for the RFE system was estimated in the paper.
Power export potential, which does not require additional capacity commissioning and,
therefore, additional investment, can be quite sufficient exceeding 4 GW of capacity in
summer, 2 GW of capacity in winter, and 16-18 TWh/year of power generation at the be-
ginning of the considered period. At the end of the considered period, the export potential
declines to about 2.5-3.0 GW of capacity only in summer (because of exhausting existing
excessive capacity) and 5-6 TWh/year of power generation. The total power exports poten-
tial, including new commissioning plants can exceed 16 GW and 95 TWh/year. In addition to this
potential, construction of the Tugursk tidal power plant, with a capacity of nearly 7 GW and yearly
power generation of 17 TWh, can be possible beyond 2025-2030.
2. The maximum acceptable exchange power between Russia and the ROK at present status,
from a technical viewpoint, is 4 GW and this result could satisfy security points. In addition
to maximum exchangeable power, the minimum exchangeable power, by comparing total
costs and benefits of interconnected lines, is evaluated at 3GW. At this time, we can say that
the range of 3 GW to 4 GW seems to be a reasonable power exchange level between the ROK
and RFE systems.
3. This study is based on a hypothesis, and research concepts, not on practical engineering
projects. Therefore, more detailed engineering work from the technical and economic view-
points are required for the realization of NEAREST. Above all, we could not estimate the
prospect for the DPRK system because we have no accurate DPRK power industry data and,
consequently, the exact details are uncertain.
9.8 Northeast Asia Interconnection, and Power Flow
Considering Seasonal Load Patterns
Economical and technical considerations are usually the underlying factors for interconnecting elec-
tric power systems. Among some of the benefits that may be realized are plant capacity savings, in-
B
/
C Ratio
terchange due to diversity, emergency power interchange, spinning reserve savings. Development of
such ties in the future can result in more effective utilization of power stations installed capacities,
fuel economy, to improvement of ecological situation in a region.
However, the planning of interconnection is a demanding task and needs to meet a wide
range of technical aspects. The interconnection of the power systems among North-East
Asian countries (Russia, China, Mongolia, Japan, and Korea) has been proposed on numer-
ous occasions, but little progress has been made due to the complicated political issues and
economical problems involved. Interstate electrical ties of power systems of the Northeast
Asia countries now practically are not developed. Now, the necessity for this power system
interconnection is increasingly being felt due to the benefit of each country. Because of these
reasons, Korea peninsula takes the role connect a bridge between different areas of North-
east Asia, such as Russia, Mongolia, China, and Japan
47-51
. The problem of utilizing
2,000MW power output after the successful construction for the Sinpo nuclear power plant
in future has been studied, and a 765 kV HVAC interconnection between South Korea and
North Korea has been discussed with several papers
52-58
.
In South Korea, the potential increase in power demand is higher than that of any other
country. The metropolitan area situated in the central parts consumed nearly 43% of the
total electricity generated, and the southeast area consumed about 33%.
However, most of the large-scale power plants have been constructed in the southern part of
South Korea. Consequently, the existing power grid includes multiple routes designed to
supply the metropolitan area so that, by and large, the direction of power flow is toward the
north. The future substitutes are to relieving the problems of power imbalance and the
shortage of power in the Seoul metropolitan areas in South Korea and the Pyongyang met-
ropolitan areas in North Korea.
In this Section, we present various scenarios and the accompanying power flow analyses
considering on seasonal load patterns, in order to provide the interconnection of the electric
power grids. A distribution map of the projected power flow will be drawn by the results of
simulations performed using the PSS/E tool.
9.8.1 Power System Status and Seasonal Load Patterns in Northeast Asia
In this Subsection, we will explain the general characteristics and the seasonal load patterns of the
existing power systems used in South Korea, North Korea, Russia, China, and Japan
59-66
.
9.8.1.1 Power system and seasonal load patterns in South Korea
The South Korean electricity generation system can be divided into 7 geographical areas that
take geographical boundaries into account. The transmission voltages used are 345kV for
the major networks, and 154kV or 66kV for the local systems. Most 66kV lines are now ei-
ther being removed or replaced by higher voltage lines. Power system on Jeju Island is now
connected to the mainland via a 100km-long submarine transmission system, comprised of
HVDC (High Voltage Direct Current) cables. Because the power demand is increasing ra-
pidly in the metropolitan area, 765kV facilities are in the process of being constructed and
now come into operation in order to provide a stable large-scale power transmission be-
Status of Power Markets and Power Exchanges in Asia and Australia 381
Figure 9.20 B/C Ratio with a 5% decreasing rate.
Thus, above study examines the future outlook of exchange power between the ROK, the
DPRK and RFE from technical and economic viewpoints. The main results of this study on
power system interconnection are as follows.
1. Excessive capacity and power generation for the RFE system was estimated in the paper.
Power export potential, which does not require additional capacity commissioning and,
therefore, additional investment, can be quite sufficient exceeding 4 GW of capacity in
summer, 2 GW of capacity in winter, and 16-18 TWh/year of power generation at the be-
ginning of the considered period. At the end of the considered period, the export potential
declines to about 2.5-3.0 GW of capacity only in summer (because of exhausting existing
excessive capacity) and 5-6 TWh/year of power generation. The total power exports poten-
tial, including new commissioning plants can exceed 16 GW and 95 TWh/year. In addition to this
potential, construction of the Tugursk tidal power plant, with a capacity of nearly 7 GW and yearly
power generation of 17 TWh, can be possible beyond 2025-2030.
2. The maximum acceptable exchange power between Russia and the ROK at present status,
from a technical viewpoint, is 4 GW and this result could satisfy security points. In addition
to maximum exchangeable power, the minimum exchangeable power, by comparing total
costs and benefits of interconnected lines, is evaluated at 3GW. At this time, we can say that
the range of 3 GW to 4 GW seems to be a reasonable power exchange level between the ROK
and RFE systems.
3. This study is based on a hypothesis, and research concepts, not on practical engineering
projects. Therefore, more detailed engineering work from the technical and economic view-
points are required for the realization of NEAREST. Above all, we could not estimate the
prospect for the DPRK system because we have no accurate DPRK power industry data and,
consequently, the exact details are uncertain.
9.8 Northeast Asia Interconnection, and Power Flow
Considering Seasonal Load Patterns
Economical and technical considerations are usually the underlying factors for interconnecting elec-
tric power systems. Among some of the benefits that may be realized are plant capacity savings, in-
B
/
C Ratio
terchange due to diversity, emergency power interchange, spinning reserve savings. Development of
such ties in the future can result in more effective utilization of power stations installed capacities,
fuel economy, to improvement of ecological situation in a region.
However, the planning of interconnection is a demanding task and needs to meet a wide
range of technical aspects. The interconnection of the power systems among North-East
Asian countries (Russia, China, Mongolia, Japan, and Korea) has been proposed on numer-
ous occasions, but little progress has been made due to the complicated political issues and
economical problems involved. Interstate electrical ties of power systems of the Northeast
Asia countries now practically are not developed. Now, the necessity for this power system
interconnection is increasingly being felt due to the benefit of each country. Because of these
reasons, Korea peninsula takes the role connect a bridge between different areas of North-
east Asia, such as Russia, Mongolia, China, and Japan
47-51
. The problem of utilizing
2,000MW power output after the successful construction for the Sinpo nuclear power plant
in future has been studied, and a 765 kV HVAC interconnection between South Korea and
North Korea has been discussed with several papers
52-58
.
In South Korea, the potential increase in power demand is higher than that of any other
country. The metropolitan area situated in the central parts consumed nearly 43% of the
total electricity generated, and the southeast area consumed about 33%.
However, most of the large-scale power plants have been constructed in the southern part of
South Korea. Consequently, the existing power grid includes multiple routes designed to
supply the metropolitan area so that, by and large, the direction of power flow is toward the
north. The future substitutes are to relieving the problems of power imbalance and the
shortage of power in the Seoul metropolitan areas in South Korea and the Pyongyang met-
ropolitan areas in North Korea.
In this Section, we present various scenarios and the accompanying power flow analyses
considering on seasonal load patterns, in order to provide the interconnection of the electric
power grids. A distribution map of the projected power flow will be drawn by the results of
simulations performed using the PSS/E tool.
9.8.1 Power System Status and Seasonal Load Patterns in Northeast Asia
In this Subsection, we will explain the general characteristics and the seasonal load patterns of the
existing power systems used in South Korea, North Korea, Russia, China, and Japan
59-66
.
9.8.1.1 Power system and seasonal load patterns in South Korea
The South Korean electricity generation system can be divided into 7 geographical areas that
take geographical boundaries into account. The transmission voltages used are 345kV for
the major networks, and 154kV or 66kV for the local systems. Most 66kV lines are now ei-
ther being removed or replaced by higher voltage lines. Power system on Jeju Island is now
connected to the mainland via a 100km-long submarine transmission system, comprised of
HVDC (High Voltage Direct Current) cables. Because the power demand is increasing ra-
pidly in the metropolitan area, 765kV facilities are in the process of being constructed and
now come into operation in order to provide a stable large-scale power transmission be-
Electricity Infrastructures in the Global Marketplace382
tween the large power generation plants and the areas where the consumers are located.
Figure 9.21 represent the load curve for day and the load curve for month in South Korea.
Table 9.17 shows the current status of KEPCO’s transmission grid facilities at the end of
2001. Table 9.18 represents a mid-to-long term forecast in demand and supply. Table 9.19
shows a power capacity of 6 generating companies in South Korea, 2002. (The bellow data
had obtained from KEPCO in Korea) Figure 9.22 represents a load demand and a generating
facility capacity for districts.
9.8.1.2 Power system and seasonal load patterns in North Korea
Figure 9.23 represents the load curve for day and the load curve for month with the assumed materi-
al in North Korea. As shown in bellow Figure, the pattern of a curve has a flat and small variation.
(a) Daily load curve
(b) Monthly load curve
Figure 9.21 South Korea load curves for day and for month.
0:00
2:00
4:00
6:00
8:00
10:00
12:00
14:00
16:00
18:00
20:00
22:00
24:00:00
45.000
40.000
35.000
30.000
25.000
20.000
15.000
10.000
5.000
0
45.000
40.000
35.000
30.000
25.000
20.000
15.000
10.000
5.000
1 2 3 4 5 6 7 8 9 10 11 12
(At the end of 2001)
Transmission Facilities Substation Facilities
Circuit length (C-km)
Support
(ea)
Number of
substation
(ea)
Transformer
capacity
(MVA)
Ovehead
Underground
Total
765 kV 662 - 662 666 1 1,110
345 kV 7,234 111 7,345 9,914 65 63,577
180 kV(HVDC) 30 202 232 553 - -
154 kV 16,111 1,465 17,576 24,581 449 78,119
66 kV 1,531 9 1,540 7,112 25 1,225
22 kV - - - - 9 248
Total 24,037 1,778 25,815 42,826 540 144,279
Table 9.17 Current status of KEPCO’s transmission grid facilities
Year
Peak Demand
[MW]
Installed Capacity [MW, as of year end] (%)
Capacity
Margin [%]
Nuclear Coal LNG Oil Hydro Total
2001
(Record)
43,130
13,720
(27.0)
15,530
(30.5)
12,870
(25.3)
4,870
(9.6)
3,880
(7.6)
50,860
(100)
15.1
2005 51,860
17,720
(28.6)
18,170
(29.3)
16,810
(27.2)
4,670
(7.6)
4,490
(7.3)
61,850
(100)
16.8
2010 60,620
23,120
(29.2)
24,270
(30.7)
20,440
(25.9)
4,820
(6.1)
6,390
(8.1)
79,020
(100)
25.1
Table 9.18 Mid-to-long term forecast in demand and supply
Company
Base
(MW)
Middle
(MW)
Peak
(MW)
Total
(MW)
KOSEPCO 3,565 500 1,500 5,565
KOMIPO 3,400 0 3,337 6,737
KOWEPO 3,066 1,400 2,880 7,346
KOSPO 3,000 400 2,200 5,600
KEWESPO 2,900 1,800 2,800 7,500
KHNP 15,715 0 528 16,243
OTHERS 0 58 4,186 4,244
TOTAL 31,646 4,158 17,431 53,235
% 59.5 7.8 32.7 100
Table 9.19 Power capacity for generation companies in South Korea, 2002
Status of Power Markets and Power Exchanges in Asia and Australia 383
tween the large power generation plants and the areas where the consumers are located.
Figure 9.21 represent the load curve for day and the load curve for month in South Korea.
Table 9.17 shows the current status of KEPCO’s transmission grid facilities at the end of
2001. Table 9.18 represents a mid-to-long term forecast in demand and supply. Table 9.19
shows a power capacity of 6 generating companies in South Korea, 2002. (The bellow data
had obtained from KEPCO in Korea) Figure 9.22 represents a load demand and a generating
facility capacity for districts.
9.8.1.2 Power system and seasonal load patterns in North Korea
Figure 9.23 represents the load curve for day and the load curve for month with the assumed materi-
al in North Korea. As shown in bellow Figure, the pattern of a curve has a flat and small variation.
(a) Daily load curve
(b) Monthly load curve
Figure 9.21 South Korea load curves for day and for month.
0:00
2:00
4:00
6:00
8:00
10:00
12:00
14:00
16:00
18:00
20:00
22:00
24:00:00
45.000
40.000
35.000
30.000
25.000
20.000
15.000
10.000
5.000
0
45.000
40.000
35.000
30.000
25.000
20.000
15.000
10.000
5.000
1 2 3 4 5 6 7 8 9 10 11 12
(At the end of 2001)
Transmission Facilities Substation Facilities
Circuit length (C-km)
Support
(ea)
Number of
substation
(ea)
Transformer
capacity
(MVA)
Ovehead Underground Total
765 kV 662 - 662 666 1 1,110
345 kV 7,234 111 7,345 9,914 65 63,577
180 kV(HVDC) 30 202 232 553 - -
154 kV 16,111 1,465 17,576 24,581 449 78,119
66 kV 1,531 9 1,540 7,112 25 1,225
22 kV - - - - 9 248
Total 24,037 1,778 25,815 42,826 540 144,279
Table 9.17 Current status of KEPCO’s transmission grid facilities
Year
Peak Demand
[MW]
Installed Capacity [MW, as of year end] (%)
Capacity
Margin [%]
Nuclear Coal LNG Oil Hydro Total
2001
(Record)
43,130
13,720
(27.0)
15,530
(30.5)
12,870
(25.3)
4,870
(9.6)
3,880
(7.6)
50,860
(100)
15.1
2005 51,860
17,720
(28.6)
18,170
(29.3)
16,810
(27.2)
4,670
(7.6)
4,490
(7.3)
61,850
(100)
16.8
2010 60,620
23,120
(29.2)
24,270
(30.7)
20,440
(25.9)
4,820
(6.1)
6,390
(8.1)
79,020
(100)
25.1
Table 9.18 Mid-to-long term forecast in demand and supply
Company
Base
(MW)
Middle
(MW)
Peak
(MW)
Total
(MW)
KOSEPCO 3,565 500 1,500 5,565
KOMIPO 3,400 0 3,337 6,737
KOWEPO 3,066 1,400 2,880 7,346
KOSPO 3,000 400 2,200 5,600
KEWESPO 2,900 1,800 2,800 7,500
KHNP 15,715 0 528 16,243
OTHERS 0 58 4,186 4,244
TOTAL 31,646 4,158 17,431 53,235
% 59.5 7.8 32.7 100
Table 9.19 Power capacity for generation companies in South Korea, 2002
Electricity Infrastructures in the Global Marketplace384
Figure 9.22 Demand and facility capacity by regions
At present, the data about transmission system of North Korea are insufficient and are not
arranged well. There are only a little data from Russia, UN, CIA, the Korean Board of Unifi-
cation, etc. Accordingly, the previous researches of interconnection in the Korean Peninsula
have just focused on the analyses of the present data and scenarios. This study assumes that
the power system in North Korea is divided into 5 areas. The power system in North Korea
is smaller than that in South Korea. Most of the hydroelectric power plants are located in the
hilly region of the northern areas in North Korea and most of the thermoelectric power
plants are located in the metropolitan area. Moreover, power capacity in North Korea has
been estimated to be approximately 7,000MW. Currently, it is known that transmission line voltage is
composed of 110kV and 220kV.
* The information in this Figure was obtained from KEPCO.
(a) Daily load curve
(b) Monthly load curve
Figure 9.23 North Korea load curves for day and month (Assumed Material)
9.8.1.3 Power system and seasonal load patterns in Far East Russia
The above data had been obtained from SEI in Russia. Table 9.20 represents a present seasonal data
of power in Russia (2001). Table 9.21 is a present seasonal data of power in East Siberia (2001). Table
9.22 shows a present seasonal data of power in Russian Far East (2001).
0:00
2:00
4:00
6:00
8:00
10:00
12:00
14:00
16:00
18:00
20:00
22:00
12000
10000
8000
6000
4000
2000
1 2 3 4 5 6 7 8 9 10 11 12
12000
10000
8000
6000
4000
2000
Status of Power Markets and Power Exchanges in Asia and Australia 385
Figure 9.22 Demand and facility capacity by regions
At present, the data about transmission system of North Korea are insufficient and are not
arranged well. There are only a little data from Russia, UN, CIA, the Korean Board of Unifi-
cation, etc. Accordingly, the previous researches of interconnection in the Korean Peninsula
have just focused on the analyses of the present data and scenarios. This study assumes that
the power system in North Korea is divided into 5 areas. The power system in North Korea
is smaller than that in South Korea. Most of the hydroelectric power plants are located in the
hilly region of the northern areas in North Korea and most of the thermoelectric power
plants are located in the metropolitan area. Moreover, power capacity in North Korea has
been estimated to be approximately 7,000MW. Currently, it is known that transmission line voltage is
composed of 110kV and 220kV.
* The information in this Figure was obtained from KEPCO.
(a) Daily load curve
(b) Monthly load curve
Figure 9.23 North Korea load curves for day and month (Assumed Material)
9.8.1.3 Power system and seasonal load patterns in Far East Russia
The above data had been obtained from SEI in Russia. Table 9.20 represents a present seasonal data
of power in Russia (2001). Table 9.21 is a present seasonal data of power in East Siberia (2001). Table
9.22 shows a present seasonal data of power in Russian Far East (2001).
0:00
2:00
4:00
6:00
8:00
10:00
12:00
14:00
16:00
18:00
20:00
22:00
12000
10000
8000
6000
4000
2000
1 2 3 4 5 6 7 8 9 10 11 12
12000
10000
8000
6000
4000
2000
Electricity Infrastructures in the Global Marketplace386
Type
Present seasonal data
Year
Spring
Summer
Autumn
Winter
Hydro
Hydro
45.3 48.0 41.7 40.9 175.9
Pumped-storage power
Nuclear 33.3 27.7 36.8 39.1 136.9
Thermal 140.9 105.2 146.5 185.9
578.5
Including
Conventional steam
turbine
56.9 46.2 64.4 80.7 248.3
Co-generation
83.4 58.6 81.6 104.5
328.0
Renewable energy - - - - -
Total 219.5 180.9 225.0 265.9
891.3
Table 9.20 Present seasonal data of power in Russia (2001, TWh)
Type
Present seasonal Data
Year
Spring Summer Autumn
Winter
Hydro
Hydro
22.0 26.4 24.2 22.3 94.9
Pumped-storage power
Nuclear - - - - -
Thermal 9.9 3.9 8.7 14.3 36.8
Including Conventional steam turbine
5.1 1.0 4.1 8.4 18.6
Co-generation
4.8 2.9 4.6 5.9 18.2
Renewable energy - - - - -
Total 31.9 30.3 32.9 36.6 131.7
Table 9.21 Present seasonal data of power in East Siberia (2001, TWh)
Unified Power System (UPS) of Russian East provides with the electric power the most in-
habited and industrially developed regions of the Russian Far East. UPS of Russian East
consist of seven large regional electric power systems: Amur, Far East, Kamchatka, Maga-
dan, Sakhalin, Khabarovsk and Yakutsk. Now the Amur, Khabarovsk and Far East electric
power systems are united on parallel operation, in parallel with them the southern part of
the Yakut electric power system is working also. The maximum of electric loading in UPS
falls at winter and makes about 5.8 GW (based on the data for 2001). The minimum of elec-
tric loadings makes approximately half from a maximum and falls at the summer period.
The maximum of in UPS was in 1990 and made approximately 30 billion kWh. In 2000 value
of electrical energy consumption has made approximately 24 billion kWh, in 2001 this value
has made 25.5 billion kWh. It was planned, that by 2005 consumption will make about 28.7
billion kWh by 2010 - 32 billion kWh, and by 2025 will make about 50 billion kWh.
Type
Present seasonal Data
Year
Spring Summer
Autumn
Winter
Hydro
Hydro
1.13 0.98 0.97 1.77 4.85
Pumped-storage power
Nuclear - - - - -
Thermal 5.29 3.57 5.04 6.75 20.65
Including Conventional steam turbine 1.54 1.27 1.52 1.72 6.05
Co-generation 3.75 2.30 3.52 5.03 14.60
Renewable energy - - - - -
Total 6.42 4.55 6.01 8.52 25.50
Table 9.22 Present seasonal data of power in Russian Far East (2001, TWh)
The current consumption is distributed non-uniformly. More than 40 % of the electric power is
consumed in the Far East electric power system. The rest of 60% are distributed between the
Khabarovsk, Amur and Yakut electric power systems. Backbone electrical network of the UPS
consist of 220 and 500 kV transmission lines. General extent of 500 kV lines makes about 2000 km
The total installed capacity of power stations (nuclear, thermal and hydro) make about 11 GW
59
.
Figure 9.24 represents the HVDC interconnection lines in Siberia and Far East Russia
50
.
9.8.1.4 Power system status in North East China
Figure 9.25 represents the seven regions and power consumption map in China. This Figure was
obtained from EPRI in China.
Figure 9.24 HVDC Interconnection Lines in Siberia and Far East Russia
This map shows an overview of the different regional grid systems within China, showing
year 2002 generating capacities and outputs in each region, as well as indicating intercon-
nections between regional grids. In China, Liaoning’s power network covering the 147,500
square kilometers of land is a modern power network with long history and full of vigor.
S
iberia
7 GW 7 G
W
2 GW
Bratsk
7 G
W
Uchur
2 GW
5 GW
9 GW
8 GW
11 GW
3 GW
11 GW
Russian Far
East
Khabarovsk
3 GW
To China,
South Korea
and Japan
5 GW
Tu
g
ur
8 GW
To
Korea
Status of Power Markets and Power Exchanges in Asia and Australia 387
Type
Present seasonal data
Year
Spring
Summer
Autumn
Winter
Hydro
Hydro
45.3 48.0 41.7 40.9 175.9
Pumped-storage power
Nuclear 33.3 27.7 36.8 39.1 136.9
Thermal 140.9 105.2 146.5 185.9
578.5
Including
Conventional steam
turbine
56.9 46.2 64.4 80.7 248.3
Co-generation
83.4 58.6 81.6 104.5
328.0
Renewable energy - - - - -
Total 219.5 180.9 225.0 265.9
891.3
Table 9.20 Present seasonal data of power in Russia (2001, TWh)
Type
Present seasonal Data
Year
Spring Summer Autumn
Winter
Hydro
Hydro
22.0 26.4 24.2 22.3 94.9
Pumped-storage power
Nuclear - - - - -
Thermal 9.9 3.9 8.7 14.3 36.8
Including Conventional steam turbine
5.1 1.0 4.1 8.4 18.6
Co-generation
4.8 2.9 4.6 5.9 18.2
Renewable energy - - - - -
Total 31.9 30.3 32.9 36.6 131.7
Table 9.21 Present seasonal data of power in East Siberia (2001, TWh)
Unified Power System (UPS) of Russian East provides with the electric power the most in-
habited and industrially developed regions of the Russian Far East. UPS of Russian East
consist of seven large regional electric power systems: Amur, Far East, Kamchatka, Maga-
dan, Sakhalin, Khabarovsk and Yakutsk. Now the Amur, Khabarovsk and Far East electric
power systems are united on parallel operation, in parallel with them the southern part of
the Yakut electric power system is working also. The maximum of electric loading in UPS
falls at winter and makes about 5.8 GW (based on the data for 2001). The minimum of elec-
tric loadings makes approximately half from a maximum and falls at the summer period.
The maximum of in UPS was in 1990 and made approximately 30 billion kWh. In 2000 value
of electrical energy consumption has made approximately 24 billion kWh, in 2001 this value
has made 25.5 billion kWh. It was planned, that by 2005 consumption will make about 28.7
billion kWh by 2010 - 32 billion kWh, and by 2025 will make about 50 billion kWh.
Type
Present seasonal Data
Year
Spring Summer
Autumn
Winter
Hydro
Hydro
1.13 0.98 0.97 1.77 4.85
Pumped-storage power
Nuclear - - - - -
Thermal 5.29 3.57 5.04 6.75 20.65
Including Conventional steam turbine 1.54 1.27 1.52 1.72 6.05
Co-generation 3.75 2.30 3.52 5.03 14.60
Renewable energy - - - - -
Total 6.42 4.55 6.01 8.52 25.50
Table 9.22 Present seasonal data of power in Russian Far East (2001, TWh)
The current consumption is distributed non-uniformly. More than 40 % of the electric power is
consumed in the Far East electric power system. The rest of 60% are distributed between the
Khabarovsk, Amur and Yakut electric power systems. Backbone electrical network of the UPS
consist of 220 and 500 kV transmission lines. General extent of 500 kV lines makes about 2000 km
The total installed capacity of power stations (nuclear, thermal and hydro) make about 11 GW
59
.
Figure 9.24 represents the HVDC interconnection lines in Siberia and Far East Russia
50
.
9.8.1.4 Power system status in North East China
Figure 9.25 represents the seven regions and power consumption map in China. This Figure was
obtained from EPRI in China.
Figure 9.24 HVDC Interconnection Lines in Siberia and Far East Russia
This map shows an overview of the different regional grid systems within China, showing
year 2002 generating capacities and outputs in each region, as well as indicating intercon-
nections between regional grids. In China, Liaoning’s power network covering the 147,500
square kilometers of land is a modern power network with long history and full of vigor.
S
iberia
7 GW 7 G
W
2 GW
Bratsk
7 G
W
Uchur
2 GW
5 GW
9 GW
8 GW
11 GW
3 GW
11 GW
Russian Far
East
Khabarovsk
3 GW
To China,
South Korea
and Japan
5 GW
Tu
g
ur
8 GW
To
Korea
Electricity Infrastructures in the Global Marketplace388
Liaoning province is the power load center in Northeast China. It has one 500kV line and six
220kV lines to connect with the power network in Jilin province. It also has two 500kV lines
and one 220kV line to connect with eastern part of an Inner Mongolia. By the end of 2000,
the total installed capacity in Liaoning province was 15,185MW (hydro power: 1,156MW;
thermal power: 12,559MW). The total installed capacity of the wholly-owned and holding
power generation plants of Liaoning Electric Power Co., Ltd. is 2,854MW (hydro power:
456MW; thermal power: 2,398MW) and takes up 18.8% of the total installed capacity of the
whole province. The independent power generation company has a total installed capacity
of 10,861MW (hydro power: 488MW; thermal power: 10,373MW) and takes up 71.5%. The
local self-supply power plants have a total installed capacity of 3,006MW, taking up 19.8%.
The installed capacity of the plant at Sino-Korean boundary river is 545MW, taking up 3.6%.
Figure 9.25 Regional power consumption map in China
9.8.1.5 Power System Status and Seasonal Load Patterns of Kyushu in Japan
Japan’s power system is divided into 9 regional companies serving the areas of Hokkaido,
Tohoku, Tokyo, Chubu, Hokuriku, Kansai, Shikoku, Chugoku, and Kyushu, and transmis-
sion consists of 500kV, 220kV, 110kV, and DC 250kV lines. Figure 9.26 shows a cascade
power flow map in Japan. The information in this Figure was obtained from
65
.
Figure 9.26 Cascade power flow map in Japan
The frequency used is 60Hz in the western part and 50Hz in the eastern part of the country.
According to statistics published in 2001, the total generating capacity of the nine power
companies is 33,765MW due to hydropower, 118,112MW due to thermal power, and
42,300MW due to nuclear power. The total capacity is therefore 194,177MW.
Kyushu’s infrastructure is composed of nuclear, thermal, hydro, and geothermal power ge-
nerating plants. In Kyushu region of Japan, 2001, summer peak has 16,743[MW], and winter
peak has 12,961[MW]. The nuclear power plants are located both in the southwest coastal
region and at the furthermost tip of Kyushu’s northwest coast. The thermal power plants are
located mainly on Kyushu’s northeast and the northwest coasts. The hydro power plants are
randomly distributed within the north and south central regions. The geothermal power
plants are located in the north and south central regions. Among these regions, Kyushu has
a total land area of 42,163 km
2
and is located in the southernmost part of Japan. The generat-
ing capacity of Kyushu’s Electric Power Company is approximately 30,200MW. The back-
bone of its transmission system consists of 500kV, 220kV, and some 110kV lines.
9.8.2 Assumed Possible Interconnection Scenarios in North East Asia
Several cases of maps are drawn according to the assumed scenario in Figure 9.27, which
has possible scenarios among Russia, China, North Korea, South Korea and Japan.
Status of Power Markets and Power Exchanges in Asia and Australia 389
Liaoning province is the power load center in Northeast China. It has one 500kV line and six
220kV lines to connect with the power network in Jilin province. It also has two 500kV lines
and one 220kV line to connect with eastern part of an Inner Mongolia. By the end of 2000,
the total installed capacity in Liaoning province was 15,185MW (hydro power: 1,156MW;
thermal power: 12,559MW). The total installed capacity of the wholly-owned and holding
power generation plants of Liaoning Electric Power Co., Ltd. is 2,854MW (hydro power:
456MW; thermal power: 2,398MW) and takes up 18.8% of the total installed capacity of the
whole province. The independent power generation company has a total installed capacity
of 10,861MW (hydro power: 488MW; thermal power: 10,373MW) and takes up 71.5%. The
local self-supply power plants have a total installed capacity of 3,006MW, taking up 19.8%.
The installed capacity of the plant at Sino-Korean boundary river is 545MW, taking up 3.6%.
Figure 9.25 Regional power consumption map in China
9.8.1.5 Power System Status and Seasonal Load Patterns of Kyushu in Japan
Japan’s power system is divided into 9 regional companies serving the areas of Hokkaido,
Tohoku, Tokyo, Chubu, Hokuriku, Kansai, Shikoku, Chugoku, and Kyushu, and transmis-
sion consists of 500kV, 220kV, 110kV, and DC 250kV lines. Figure 9.26 shows a cascade
power flow map in Japan. The information in this Figure was obtained from
65
.
Figure 9.26 Cascade power flow map in Japan
The frequency used is 60Hz in the western part and 50Hz in the eastern part of the country.
According to statistics published in 2001, the total generating capacity of the nine power
companies is 33,765MW due to hydropower, 118,112MW due to thermal power, and
42,300MW due to nuclear power. The total capacity is therefore 194,177MW.
Kyushu’s infrastructure is composed of nuclear, thermal, hydro, and geothermal power ge-
nerating plants. In Kyushu region of Japan, 2001, summer peak has 16,743[MW], and winter
peak has 12,961[MW]. The nuclear power plants are located both in the southwest coastal
region and at the furthermost tip of Kyushu’s northwest coast. The thermal power plants are
located mainly on Kyushu’s northeast and the northwest coasts. The hydro power plants are
randomly distributed within the north and south central regions. The geothermal power
plants are located in the north and south central regions. Among these regions, Kyushu has
a total land area of 42,163 km
2
and is located in the southernmost part of Japan. The generat-
ing capacity of Kyushu’s Electric Power Company is approximately 30,200MW. The back-
bone of its transmission system consists of 500kV, 220kV, and some 110kV lines.
9.8.2 Assumed Possible Interconnection Scenarios in North East Asia
Several cases of maps are drawn according to the assumed scenario in Figure 9.27, which
has possible scenarios among Russia, China, North Korea, South Korea and Japan.
Electricity Infrastructures in the Global Marketplace390
(a) Separation for North Korea and South. (b) North Korea-South Korea
(c) North Korea-South Korea-Japan. (d) Russia-North Korea-South Korea-Japan
(e) Russia-Mongo-China-South Korea-Japan. (f) China-North Korea-South Korea-Japan
(g) Russia-Mongo-China-South Korea-Japan. (h) Russia-Mongo-China-South Korea-Japan
Figure 9.27 Possible scenarios among Russia, China, North Korea, South Korea and Japan
9.8.3 Assumed Seasonal Power exchange Quantity for Power Flow Calculation
Table 9.23 represents the assumed peak load data for summer and winter in South Korea,
2005. To simulation the PSS/E package, the load was decreased with 2,000MW in summer
season and decreased with 1,000MW in winter season. Table 9.24 has the assumed peak data
for summer and winter in North Korea, 2005. All the load and supply patterns were as-
sumed with constant quantity. Table 9.25 is the assumed peak data for summer and winter
at Kyushu in Japan, 2001. Table 9.26 has the assumed export power for summer and winter
in Far East Russia. Table 9.27 represents the assumed export power for summer and winter
in North East China.
Thus, the purpose of this Section was to execute a power flow analysis considering seasonal
load patterns for the increase or for the decrease of a reserve power for the future power
shortages faced by the metropolitan areas or by the southeastern area of the South Korea in
North-East Asia. Several cases were considered as follows:
● Securing South Korea’s power reserve by a power interchange considering seasonal effects
in North East Asia countries.
● Drawing possible scenarios and power flow maps for relieving the power shortages faced
by the metropolitan areas and southeastern area in Korean Peninsula.
● Considering seasonal load patterns and studying power flow for the interconnection with
2,000MW in Far-East Russia or in Northeast China, and 1,000MW in Japan to utilizing re-
mote power sources.
The preliminary considerations above consist only of a scenario-based power flow analysis
included with seasonal load patterns; however, the results of this research may be referred
to the government for use in the establishment of a future construction plan for the power
system in South Korea. Moreover, these may be expecting to improve political and economi-
cal relationships in North East Asia countries.
Seasons Generation [MW] Load [MW] Receive Power [MW]
Summer peak 51857.8 51,090.4 2,000+1,000
Winter peak 41,857.8 41,090.4 1,000+500
Table 9.23 Assumed peak data for summer and winter in South Korea, 2005
Seasons Generation [MW] Load [MW] Transmission P [MW]
Summer peak 9,000 9,000 -
Winter peak 9,000 9,000 -
Table 9.24 Assumed peak data for summer and winter in North Korea, 2005
Seasons
Generation
[MW]
Load
[MW]
Transmission Power
(Japan → Korea)
Summer peak 17,743 16,743 1,000
Winter peak 13,461 12,961 500
Table 9.25 Assumed peak data for summer and winter at Kyushu in Japan, 2001
Status of Power Markets and Power Exchanges in Asia and Australia 391
(a) Separation for North Korea and South. (b) North Korea-South Korea
(c) North Korea-South Korea-Japan. (d) Russia-North Korea-South Korea-Japan
(e) Russia-Mongo-China-South Korea-Japan. (f) China-North Korea-South Korea-Japan
(g) Russia-Mongo-China-South Korea-Japan. (h) Russia-Mongo-China-South Korea-Japan
Figure 9.27 Possible scenarios among Russia, China, North Korea, South Korea and Japan
9.8.3 Assumed Seasonal Power exchange Quantity for Power Flow Calculation
Table 9.23 represents the assumed peak load data for summer and winter in South Korea,
2005. To simulation the PSS/E package, the load was decreased with 2,000MW in summer
season and decreased with 1,000MW in winter season. Table 9.24 has the assumed peak data
for summer and winter in North Korea, 2005. All the load and supply patterns were as-
sumed with constant quantity. Table 9.25 is the assumed peak data for summer and winter
at Kyushu in Japan, 2001. Table 9.26 has the assumed export power for summer and winter
in Far East Russia. Table 9.27 represents the assumed export power for summer and winter
in North East China.
Thus, the purpose of this Section was to execute a power flow analysis considering seasonal
load patterns for the increase or for the decrease of a reserve power for the future power
shortages faced by the metropolitan areas or by the southeastern area of the South Korea in
North-East Asia. Several cases were considered as follows:
● Securing South Korea’s power reserve by a power interchange considering seasonal effects
in North East Asia countries.
● Drawing possible scenarios and power flow maps for relieving the power shortages faced
by the metropolitan areas and southeastern area in Korean Peninsula.
● Considering seasonal load patterns and studying power flow for the interconnection with
2,000MW in Far-East Russia or in Northeast China, and 1,000MW in Japan to utilizing re-
mote power sources.
The preliminary considerations above consist only of a scenario-based power flow analysis
included with seasonal load patterns; however, the results of this research may be referred
to the government for use in the establishment of a future construction plan for the power
system in South Korea. Moreover, these may be expecting to improve political and economi-
cal relationships in North East Asia countries.
Seasons Generation [MW] Load [MW] Receive Power [MW]
Summer peak 51857.8 51,090.4 2,000+1,000
Winter peak 41,857.8 41,090.4 1,000+500
Table 9.23 Assumed peak data for summer and winter in South Korea, 2005
Seasons Generation [MW] Load [MW] Transmission P [MW]
Summer peak 9,000 9,000 -
Winter peak 9,000 9,000 -
Table 9.24 Assumed peak data for summer and winter in North Korea, 2005
Seasons
Generation
[MW]
Load
[MW]
Transmission Power
(Japan → Korea)
Summer peak 17,743 16,743 1,000
Winter peak 13,461 12,961 500
Table 9.25 Assumed peak data for summer and winter at Kyushu in Japan, 2001
Electricity Infrastructures in the Global Marketplace392
Seasons
Generation
[MW]
Load
[MW]
Transmission Power
(Russia → Korea)
Summer peak 2,000 0 2,000
Winter peak 1,000 0 1,000
Table 9.26 Assumed export power for summer and winter in Far East Russia
Seasons
Generation
[MW]
Load
[MW]
Transmission Power
(China → Korea)
Summer peak 2,000 0 2,000
Winter peak 1,000 0 1,000
Table 9.27 Assumed export power for summer and winter in North east China
9.9 Acknowledgements
This Chapter has been prepared by Nikolai I. Voropai, Professor, Corresponding Member of
RAS, Director of Energy Systems Institute, Irkutsk, Russia. Contributors include colleagues
at the Institute and Members of the IEEE PES W.G. on Asian and Australian Electricity
Infrastructure.
9.10 References
[1]. Open Access in Inter-State Transmission, Central Electricity Regulatory Commission, New
Delhi, India, Nov. 2003.
[2]. Electricity Act 2003, Ministry of Power, Government of India, New Delhi, India, June
2003.
[3]. Mukhopadhyay, S., “Interconnection of Power Grids in South Asia”, Proc. 2003 IEEE PES
General Meeting, Toronto, Ontario, Canada.
[4]. Mukhopadhyay, S., “Power Generation and Transmission Planning in India – Metho-
dology, Problems and Investments”, Proc. 2004 IEEE PES General Meeting, Denver,
Colorado, USA.
[5]. National Electricity Code Administrator website. www.neca.com.au
[6]. Ershevich, V.V., Antimenko, Yu.A., “Efficiency of the Unified Electric Power System
Operation on the Territory of the Former USSR”, Izv. RAN. Energetika, 1993, No. 1
(in Russian).
[7]. Voropai, N.I., Ershevich, V.V., Rudenko, Yu.N., Development of the International Intercon-
nections – the Way to Creation of the Global Power System, Irkutsk: SEI SB RAS, 1995,
Vol. 10 (in Russian).
[8]. Belyev, L.S., Voizekhovskaya, G.V., Saveliev, V.A., A System Approach to Power System
Development Management, Novosibirsk: Nauka, 1980 (in Russian).
[9]. Belyaev, L.S., Kononov, Yu.D., Makarov, A.A., “Methods and Models for Optimization
of Energy Systems Development”, Soviet Experience Review of Energy Models., Lax-
enburg: IIASA, 1976, No. 3.
[10]. Voropai, N.I., Trufanov, V.V., Selifanov, V.V., Sheveleva, G.I., “Modeling of Power
Systems Expansion and Estimation of System Efficiency of Their Integration in the
Liberalized Environment”, Proc. CIGRE 2004 Session, Rep. C1-103.
[11].
[12].
[13].
[14].
[15].
[16].
[17].
[18]. Schweppe, F. C., et al, Spot Pricing of Electricity, Kluwer Academic Publisher, 1988.
[19]. Chao, H. P., Huntington, H. G., Designing Competitive Electricity Markets, Kluwer Aca-
demic Publisher, 1998.
[20]. Ilic, M., Galiana, F., Fink, L., Power Systems Restructuring, Engineering and Economics,
Kluwer Academic Publisher, 1998.
[21]. Cameron, L., “Transmission Investment: Obstacles to a Market Approach”, The Electric-
ity Journal, 2001, Vol. 14, No. 2.
[22]. Kahn, E. P., “Numerical Techniques for Analyzing Market Power in Electricity”,The
Electricity Journal, 1998,Vol. 11, No. 6.
[23]. Oren, S.S., Ross, A.M., “Economic Congestion Relief Across Multiple Regions Requires
Tradable Physical Flow-Gate Rights”, IEEE Trans. on PWRS, 2002, Vol. 17, No. 1.
[24]. Wu, F. F., Ni, Y., Wei, P., “Power Transfer Allocation for Open Access Using Graph
Theory: Fundamentals and Applications in Systems without Loopflow”, IEEE
Trans. on PWRS, 2000,Vol. 15, No. 3.
[25]. State Power Information Network, http:// www.sp.com.cn
[26]. Electric Power Info Net of China,
[27]. Association of the Chinese Electric Power Enterprises, . org.cn
[28]. Electric Power News Net of China,
[29]. East China Power Market Steering Committee Office, “East China Power Market Pilot
Work Documents”, No. 18-19, 2004.
[30]. Gan, D., Bourcier, D. V., "Locational Market Power Screen and Congestion Manage-
ment: Experience and Suggestions", IEEE Transactions on Power Systems, 2002, Vol.
17, No. 1.
[31]. Mas-Colell, A., Whinston, M. D., Green, J. R., Microeconomic Theory, Oxford University
Press, Oxford, UK, 1995.
[32]. Federal Energy Regulation Council (FERC), “Working Paper on Standardized Trans-
mission Service and Wholesale Electricity Market Design”, March 16, 2002. http://
www.ferc.fed.gov
[33]. LECG, LLC, Kema Consulting, Inc, “Feasibility Study for a Combined Day-Ahead
Electricity Market in the Northeast”, 2nd Draft Report, Albany, April 26, 2001.
[34]. Hunt, S. , Shuttleworth, G., Competition and Choice in Electricity, New York, Wiley, 1997.
[35].
[36]. Hur, D., "Determination of Transmission Transfer Capability Using Distributed Con-
tingency-Constrained Optimal Power Flow and P-V Analysis," Ph.D. dissertation,
School of Elect. Eng., Seoul Nat. Univ., Korea, 2004.
[37]. Hur, D., Park, J. K, Kim, B. H., "Application of Distributed Optimal Power Flow to
Power System Security Assessment," Electr. Power Components Syst., 2003, Vol. 31,
No.1.
Status of Power Markets and Power Exchanges in Asia and Australia 393
Seasons
Generation
[MW]
Load
[MW]
Transmission Power
(Russia → Korea)
Summer peak 2,000 0 2,000
Winter peak 1,000 0 1,000
Table 9.26 Assumed export power for summer and winter in Far East Russia
Seasons
Generation
[MW]
Load
[MW]
Transmission Power
(China → Korea)
Summer peak 2,000 0 2,000
Winter peak 1,000 0 1,000
Table 9.27 Assumed export power for summer and winter in North east China
9.9 Acknowledgements
This Chapter has been prepared by Nikolai I. Voropai, Professor, Corresponding Member of
RAS, Director of Energy Systems Institute, Irkutsk, Russia. Contributors include colleagues
at the Institute and Members of the IEEE PES W.G. on Asian and Australian Electricity
Infrastructure.
9.10 References
[1]. Open Access in Inter-State Transmission, Central Electricity Regulatory Commission, New
Delhi, India, Nov. 2003.
[2]. Electricity Act 2003, Ministry of Power, Government of India, New Delhi, India, June
2003.
[3]. Mukhopadhyay, S., “Interconnection of Power Grids in South Asia”, Proc. 2003 IEEE PES
General Meeting, Toronto, Ontario, Canada.
[4]. Mukhopadhyay, S., “Power Generation and Transmission Planning in India – Metho-
dology, Problems and Investments”, Proc. 2004 IEEE PES General Meeting, Denver,
Colorado, USA.
[5]. National Electricity Code Administrator website. www.neca.com.au
[6]. Ershevich, V.V., Antimenko, Yu.A., “Efficiency of the Unified Electric Power System
Operation on the Territory of the Former USSR”, Izv. RAN. Energetika, 1993, No. 1
(in Russian).
[7]. Voropai, N.I., Ershevich, V.V., Rudenko, Yu.N., Development of the International Intercon-
nections – the Way to Creation of the Global Power System, Irkutsk: SEI SB RAS, 1995,
Vol. 10 (in Russian).
[8]. Belyev, L.S., Voizekhovskaya, G.V., Saveliev, V.A., A System Approach to Power System
Development Management, Novosibirsk: Nauka, 1980 (in Russian).
[9]. Belyaev, L.S., Kononov, Yu.D., Makarov, A.A., “Methods and Models for Optimization
of Energy Systems Development”, Soviet Experience Review of Energy Models., Lax-
enburg: IIASA, 1976, No. 3.
[10]. Voropai, N.I., Trufanov, V.V., Selifanov, V.V., Sheveleva, G.I., “Modeling of Power
Systems Expansion and Estimation of System Efficiency of Their Integration in the
Liberalized Environment”, Proc. CIGRE 2004 Session, Rep. C1-103.
[11].
[12].
[13].
[14].
[15].
[16].
[17].
[18]. Schweppe, F. C., et al, Spot Pricing of Electricity, Kluwer Academic Publisher, 1988.
[19]. Chao, H. P., Huntington, H. G., Designing Competitive Electricity Markets, Kluwer Aca-
demic Publisher, 1998.
[20]. Ilic, M., Galiana, F., Fink, L., Power Systems Restructuring, Engineering and Economics,
Kluwer Academic Publisher, 1998.
[21]. Cameron, L., “Transmission Investment: Obstacles to a Market Approach”, The Electric-
ity Journal, 2001, Vol. 14, No. 2.
[22]. Kahn, E. P., “Numerical Techniques for Analyzing Market Power in Electricity”,The
Electricity Journal, 1998,Vol. 11, No. 6.
[23]. Oren, S.S., Ross, A.M., “Economic Congestion Relief Across Multiple Regions Requires
Tradable Physical Flow-Gate Rights”, IEEE Trans. on PWRS, 2002, Vol. 17, No. 1.
[24]. Wu, F. F., Ni, Y., Wei, P., “Power Transfer Allocation for Open Access Using Graph
Theory: Fundamentals and Applications in Systems without Loopflow”, IEEE
Trans. on PWRS, 2000,Vol. 15, No. 3.
[25]. State Power Information Network, http:// www.sp.com.cn
[26]. Electric Power Info Net of China,
[27]. Association of the Chinese Electric Power Enterprises, . org.cn
[28]. Electric Power News Net of China,
[29]. East China Power Market Steering Committee Office, “East China Power Market Pilot
Work Documents”, No. 18-19, 2004.
[30]. Gan, D., Bourcier, D. V., "Locational Market Power Screen and Congestion Manage-
ment: Experience and Suggestions", IEEE Transactions on Power Systems, 2002, Vol.
17, No. 1.
[31]. Mas-Colell, A., Whinston, M. D., Green, J. R., Microeconomic Theory, Oxford University
Press, Oxford, UK, 1995.
[32]. Federal Energy Regulation Council (FERC), “Working Paper on Standardized Trans-
mission Service and Wholesale Electricity Market Design”, March 16, 2002. http://
www.ferc.fed.gov
[33]. LECG, LLC, Kema Consulting, Inc, “Feasibility Study for a Combined Day-Ahead
Electricity Market in the Northeast”, 2nd Draft Report, Albany, April 26, 2001.
[34]. Hunt, S. , Shuttleworth, G., Competition and Choice in Electricity, New York, Wiley, 1997.
[35].
[36]. Hur, D., "Determination of Transmission Transfer Capability Using Distributed Con-
tingency-Constrained Optimal Power Flow and P-V Analysis," Ph.D. dissertation,
School of Elect. Eng., Seoul Nat. Univ., Korea, 2004.
[37]. Hur, D., Park, J. K, Kim, B. H., "Application of Distributed Optimal Power Flow to
Power System Security Assessment," Electr. Power Components Syst., 2003, Vol. 31,
No.1.