Waves in fluids and solids Part 9 doc
Bạn đang xem bản rút gọn của tài liệu. Xem và tải ngay bản đầy đủ của tài liệu tại đây (3.14 MB, 25 trang )
Acoustic Properties of theGlobular Photonic Crystals
189
(a)
(b)
(c)
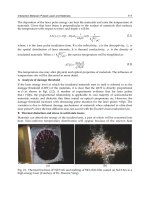
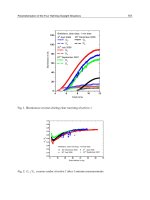
Fig. 7. Mass of acoustic quasi-particles for different types of opal: (a) initial opal, (b) opal
with water, (c) opal with gold. Solid and dashed curves correspond to longitudinal and
transverse waves, respectively.
Waves in Fluids and Solids
190
According to the general definition of the effective mass of a quasi-particle [6, 7], the
effective mass of acoustic phonons can be calculated by the formula
()
()
() ()
1
2
2
.
/
gr gr
dk
m
dk
VdV d
ω
ω
ωωω
−
==
(36)
This effective mass is related to slow acoustic waves and is many orders of magnitude
smaller than the mass of photons in PNC, and can be estimated from the relation
0
2
(0)
,m
S
ω
=
where S is corresponding sonic velocity. In particular, the effective mass of the
transverse acoustic phonons related to the second dispersion branch of PNC containing the
atmospheric air (see Fig. 6) is equal to m
0
= -24⋅10
-30
kg; for PNC containing water we have
m
0
= -3,64⋅10
-30
kg; and for PNC containing gold we obtain m
0
= -6,94⋅10
-30
kg. Accordingly
for the third dispersion branch the effective mass appears to be positive and slightly exceeds
(by the absolute value) the indicated above values of the effective rest mass of phonons.
Summarizing, in PNC the acoustic phonons possess by the rest mass; the phonon rest mass
by its absolute value is 5 – 6 orders of magnitude less than the effective rest mass of photons
in PTC, and can be both positive and negative.
1.3 Structure and the techniques of preparation of the globular photonic crystals
The important example of the three-dimensional PTC (PNC) is the so-called globular
photonic crystal composed of densely packed balls (globules) as the face-centered cubic
crystal lattice. The diameter of the globules is slightly changed within the whole structure of
a crystal. Depending on the technological process this diameter can vary within the range of
200 - 1000 nm. To the present time the globular photonic crystals composed of the balls of
synthetic opal (SiO
2
), titanium oxide (TiO
2
), and Polystyrene are known. There exist the
voids (pores) between the globules of a photonic crystal, which can be filled with some
foreign additives. For example, it is possible to implant into the pores of a globular
phoptonic crystal some liquids, which moisturize the globule interface, and solid dielectrics,
including piezoelectrics and ferroelectrics. Besides, it is possible to implant magnetic
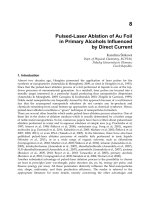
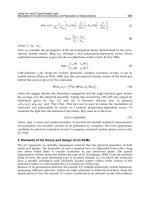
Fig. 8. Samples of 3D-PTC, obtained from the synthetic opals under different technological
conditions.
Acoustic Properties of theGlobular Photonic Crystals
191
materials, semiconductors, metals and superconductors. Thus, we have a wide opportunity
to create new materials of a hybrid-like type: dielectric-ferroelectric, dielectric-magnetic,
dielectric-metal etc. We also can control the dielectric, acoustic and galvanic properties of
such hybrid materials by changing the diameter of globules.
Some samples of three-dimensional PTCs under study are illustrated in the photo, see Fig. 8.
The white large sample (at the foot of the photo) was annealed in the atmospheric air at the
temperature of 600 C. Color (green and blue) samples were annealed in the atmosphere of
argon. During the process of growth and annealing these samples were saturated by carbon
as the result of destruction of organic molecules, which were initially (in the trace amounts)
located in the samples.
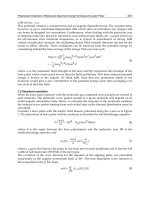
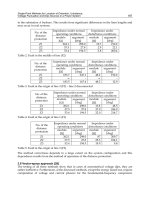
(a)
(b)
Fig. 9. PTC, transparent in the visible spectral range; (a) – PTC, containing the quantum
dots. This sample was filled by ZrO
2
nanoparticles and then was subjected to annealing at
high temperature (up to 1200 C); as the result, the sample became transparent as the size of
implanted inclusions of ZrO
2
nanoparticles was essentially less than the photonic crystal
lattice constant and a wavelength in the visible range. (b) – PTC, filled with glycerol-water
mixture.
Waves in Fluids and Solids
192
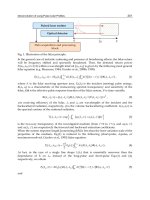
(a)
(b)
Fig. 10. The images of (111) surfaces for two ((a) and (b)) investigated synthetic opals,
obtained with the help of electronic microscope.
Electronic images of the globular PTC surface (111) for two investigated samples are shown
in Fig. 10 (a) and (b). We can see that the nanostructure of sample in Fig.10 (a) is close to the
ideal one. In the case of the second sample (Fig. 10 (b)) there exist numerous defects arisen
due to certain disordering processes. Initial synthetic opals have been filled with some
organic (Stilbene, glycerol, acetone, nitrobenzene) or inorganic (sodium nitrite, sulfur, ZrO
2
)
chemicals. At the certain concentration of glycerol-water mixture its refractive index
appeared to be very close to that for a quarts globule. In this way almost transparent 3D-
PTC have been obtained (see Fig. 9 (b)).
The processes of the opal sample processing are shown in Fig. 11 (a, b). We have implanted
nanoparticles of some metals (Au, Ag, Ga) into the photonic crystal pores localized between
the globules. The sample was filled with ZrO
2
nanoparticles and then was subjected to
annealing at high temperature (up to 1200 C); as the result, the sample became transparent
as the size of implanted inclusions of ZrO
2
nanoparticles was essentially less than the
photonic crystal lattice constant and the visible range wavelength. Accordingly, such spatial
arrangement of inclusions can be described as the array of spatially ordered quantum dots
Acoustic Properties of theGlobular Photonic Crystals
193
in the transparent crystal of quartz. The schematic nanostructure of such quantum dots in
PTC is illustrated in Fig. 11 c.
Fig. 11. Structures of 3D-PTC filled by dielectrics or metals; (a) - initial synthetic opal,
(b) - opal, filled with some substance, (c) – result of the high temperature annealing of the
sample, containing the particles of ZrO
2
, whose melting temperature is higher than that for
quartz.
1.4 Optical properties of the globular PTC
In what follows we will analyze the optical and acoustic properties of globular PTC; it is
clear that we can describe the both properties in the framework of the same approach. This
is why the following considerations basically repeat the models applied above, but now we
should bear in mind that we deal with the three-dimensional periodic medium. Assuming
that the light wave is directed along the (111) vector in a crystal, it is still possible to use the
approximation of effective one-dimensional model of the layered PTC [6, 7]. In this case the
dispersion law of the globular PTC on the basis of the synthetic opal, whose pores are filled
with atmospheric air, is given by the following formula, which is quite similar to Eqn. (34)
for the dispersion law of acoustic waves in the layered PTC:
12
11 22 11 22
12
1
cos cos sin sin cos .
2
ka ka ka ka ka
εε
εε
+
⋅− ⋅=
⋅
(37)
The parameters here are the following:
ε
1
is the dielectric permittivity of quartz (naturally
for the oprtical range of frequencies);
ε
2
is the dielectric permittivity of air,
1
(1 )aa
η
=− ,
2
,aa
η
= where
η
is the effective sample porosity,
2
3
aD=
is the period of the structure of
the sample, D is the effective diameter of quartz globule,
ω
i
is the cyclic frequency of the
electromagnetic wave,
()
0
ii
k
c
ω
ωε
= is the wave vector in SiO
2
(i = 1) and in the air (i = 2).
In Fig. 12 the dispersion dependence
ω
(k) for the incident (along the direction (111))
electromagnetic wave in the globular PTC, whose pores filled with atmospheric air, and the
effective globule diameter is D = 225 nm. The Fig. 13 illustrates the two-branch dependence
ω(k) for the globular PTC filled with the liquid having the refractive index close to that for
SiO
2
. As is seen from the graphs, in that case the band-gap width approaches zero.
Figs. 14 and 15 illustrate the dispersion law
ω
(k) of electromagnetic waves for the globular
PTC, filled with the dielectric or metal accordingly. Figs. 16 and 17 show the character of
changing the dispersion law owing to the occurrence of the low and high frequency
Waves in Fluids and Solids
194
Fig. 12. The dispersion curves ω(k) for the first two branches of the globular PTC filled with
air. The straight line obeys the dispersion law in vacuum.
Fig. 13. The dispersion curves
ω
(k) for the first two branches of the globular PTC, filled with
water. The upper curve corresponds to the initial (free of water) crystal, the lower curve
corresponds to the crystal, whose pores contain a liquid with the refractive index close to
that for quartz.
Fig. 14. The dispersion curves
ω
(k) for the first two branches of the globular PTC, filled with
the dielectric.
Acoustic Properties of theGlobular Photonic Crystals
195
Fig. 15. The dispersion curves
ω
(k) for the first two branches of the globular PTC, filled with
the metal.
Fig. 16. The dispersion curves
ω
(k) for the first two branches of the globular PTC for the
case, where the low-frequency resonance exists.
Fig. 17. The dispersion curves
ω
(k) for the first two branches of the globular PTC for the
case, where the high-frequency resonance exists.
resonances accordingly; the resonances arise due to adding the certain substance in the
pores. As is seen from Figs. 13 – 15, the implantation of dielectrics, whose refractive index
exceeds that of quartz, into the pores of the globular PTC results in changing the width of
the band-gap and its shifting to lower frequencies. At the same time, at implanting metal
into these pores the band-gap shifts to higher frequencies, see Fig. 15. If one implants the
Waves in Fluids and Solids
196
substance, characterizing by the presence of resonances close to the band-gap spectrum, the
dispersion curves
ω
(k) drastically change; it becomes possible that new band-gaps are being
formed, and this process is essentially dependent on the resonant frequencies of the
implanted substance, see Figs. 16, 17.
The implantation of various chemicals into the globular PTC was carried out by various
techniques: among these was impregnation by a liquid wetting quartz, saturation of the
crystal matrix by solutions of various salts with subsequent annealing, and also some laser
methods including ablation. To analyze the spectra of reflectance of incident broadband
electromagnetic radiation from the globular PTC interface, whose pores contain various
substances, the experimental setup (see Fig. 18) was designed; its characteristics are
described in Ref. [9]. In this setup the radiation of halogen or deuterium lamp (14) was
directed with the help of an optical fiber probe perpendicular to the crystal interface (3). The
optical fiber diameter was 100 μm, and the spatial resolution of the setup was on the level of
0.2 mm. With the help of another optical wave-guide the oppositely reflected radiation was
Fig. 18. The schematic of the experimental setup for analyzing the spectra of radiation
reflected from the PTC interface; (1) - screws; (2) - the top Teflon cover-sheet; (3) – the PTC;
(4) – the cell; (5) – the liquid sample; (6) - the bottom Teflon cover-sheet; (7) – the optical
fiber probe; (8) – the wave-guide; (9) – the mini-spectromemer; (10) – the computer; (11) –
the YAG:Nd
3+
- laser; (12) - the power supply unit for the wave-guides; (13) – the wave-
guide; (14) – the halogen lamp; (15) - the power supply unit for the lamp; (16) – the optical
fiber probe for investigating the transmission spectra; (17) – the wave-guide.
Acoustic Properties of theGlobular Photonic Crystals
197
input to a mini-spectrometer FSD-8, where the reflectance spectra in the range of 200 – 1000
nm were processed in the real time. The spectral resolution of the reflectance spectra was ≤ 1
nm. Using the laser radiation (pulse repeating YAG:Nd
3+
laser with the possibility of doubling
or quadrupling the frequency of the radiation) allowed us to carry out additional implantation
of dielectrics or metals into the pores of the crystal with the simultaneous controlling the
spectrum of the band-gap (this spectrum depends on the type and amount of the implanted
substance). Using the additional optical fiber probe (16) allowed us to analyze the transmission
spectrum with the help of second mini-spectrometer (9). The experimental data were input to
the analog-to-digital converter of the computer (10) for the final processing.
In Fig. 19 the reflectance spectra of the globular PTC with various globule diameter and
containing the atmospheric air (curve 1 in Fig. 19 (a) – (c)), and water (curve 2 in Fig. 8 (a) –
(c)) are given. It is seen that at increase of the globule diameter, and at implantation of water
into the pores the reflectance peak corresponding to the band-gap is shifted to higher
frequencies. This experimental result is in agreement with formulas (38) and (39), which are
relevant for the PTC model in question:
22
max
2
2sin,
3
eff
Dn
λθ
=− (38)
22
12
(1 ).
eff
nnn
ββ
=+− (39)
400 500 600 700 800
0,0
0,2
0,4
0,6
0,8
1,0
I, arb. un
λ, nm
448,1
483,1
12
a
400 500 600 700 800
0,0
0,2
0,4
0,6
0,8
1,0
532,4
563,9
I, arb. un
λ, nm
12
b
400 500 600 700 800
0,0
0,2
0,4
0,6
0,8
1,0
634,0
676,5
λ, nm
I, arb. un
644,1
c
Fig. 19. The spectra of radiation reflected from (111) interface of the globular PTC with
various globule diameters: D = 200 (а), 240 (b) and 290 nm (с).
Waves in Fluids and Solids
198
Here
θ
is the angle of the radiation incidence onto the interface (111) of the PTC, D is the
globule diameter, and n
1
, n
2
are the refractive indices of SiO
2
and an implanted substance
respectively.
As is seen in Fig. 19, the impregnation of the crystal matrix by water results in narrowing
the band-gap. This is in conformity with the optical contrast decrease at approaching the
refractive indices n
2
and n
1
to one another, see Eqn. (40) for the band-gap width.
21
max
21
|
4
.
()
nn
nn
λλ
π
−
Δ=
+
(40)
Fig. 20 illustrates the reflectance spectrum for the first and the second band-gap. According to
Eqn. (38) the frequency of the reflectance spectral maximum should belong to the visible range,
and for the second band-gap that frequency should be duplicated. As is seen in this Figure, the
additional reflectance peak is indeed observed in the near ultra-violet range. The curve (1) in
this Figure characterizes the parameters of the second band-gap. It is noteworthy that spectral
boundaries of this band-gap are shifted towards larger wavelengths. This result is due to the
growth of refractive index of SiO
2
in the ultra-violet spectral range.
200 300 400 500 600 700
0,0
0,2
0,4
0,6
0,8
1,0
λ,nm
280 503 534
1
2
3
Fig. 20. The reflectance spectra of the globular PTC, filled with air (curve (2)) and water
(curves (1) and (3)). The curves (2) and (3) are related to using the halogen lamp with a
broad bandwidth in the visible range. The curve (1) is related to using the deuterium lamp
with a broad bandwidth in the ultra-violet range.
200 300 400 500 600 700 800
0,0
0,2
0,4
0,6
0,8
1,0
λ, n
m
487
534
1
2
Fig. 21. The reflectance spectrum for the initial PTC (the curve 2), and the PTC doped with
the nanoparticles of gold (the curve 1).
Acoustic Properties of theGlobular Photonic Crystals
199
Fig. 21 shows the reflectance spectra for the same geometry of an incident light (the
radiation is reflected from (111) surface of the crystal), but now the golden particles are
implanted into the crystal pores by the technique of laser ablation. As is seen in this Figure,
the implantation of metal into the pores results in shifting the band-gap to higher
frequencies, which is due to the fact that the real part of the metal dielectric permittivity in
the range of optical frequencies is negative.
1.5 Acoustic properties of globular PNC
Basing on the classical Lamb model, in Refs. [6, 7] the theory of natural oscillations (modes)
of isolated isotropic spherical globules was developed. In this theory the existence of two
kinds of globular oscillations (modes), characterized by the subscripts l and n, was
predicted. For describing these modes the following dimensionless values were introduced:
,.
nl nl
nl nl
LT
DD
VV
πν πν
ξη
= = (41)
Here V
L
and V
T
are the velocities of longitudinal and transverse acoustic waves accordingly,
D is the diameter of globules,
ν
nl
are the corresponding frequencies in Hz. The equation for
the eigenvalues
nl
ξ
and
nl
η
related to the oscillating modes, which are induced in a sphere,
has the form:
()()
()
()
()
()
()
()( ) ()()
()
()
11
2 4
1
22
1
212 1
2
12 1 2 1 2 0
ll
ll
l
l
jj
ll l
jj
j
ll lll
j
ηη ξξ
ηη
ηξ
ηη
ηη
η
++
+
+− + −+ − +
+− + + − − + =
(42)
where
η
and
ξ
are the corresponding eigenvalues, and j
l
(
η
) is spherical first order Bessel
function. The solution to this equation gives the following relationship between the
frequencies:
0
(,)
,
nl
nl
D
=
v
v
(43)
where
ν
0
(n, l) is some function, dependent upon the numbers n and l.
The modes characterized by even numbers n and l are the Raman-active ones, and thus can
contribute to the spectra of two-photon light scattering (by contrast to the libration modes,
which cannot be displayed in the two-photon processes due the rules of selection). The
equation (43) was analyzed in Refs. [6, 7] for the spherical globules made of quartz; the
velocities V
L
= 5279 m/s and V
T
=3344 m/s for the longitudinal and transverse sound
velocities in the amorphous quartz were substituted in the corresponding equations. The
calculated values of the frequencies in the GHz frequency range for some globular modes
are the following:
ν
10
= 2.617/D = 0.44 cm
-1
,
ν
20
= 4.017/D = 0.68 cm
-1
, (44)
where D = 200 nm, which is in a good conformity with the experimental data, see below.
Thus, in the case of the opal matrixes the nano-sized spherical globules play a role of
Waves in Fluids and Solids
200
vibrating molecules. The standing waves are induced in each globule of the crystal. The
pulsating modes arising in the PNC globules are related to the movements, resulting in the
change of the globule material density. This is why the vibrating excitation of one particular
globule can transfer to another globule; accordingly the excitation wave of the globules can
travel along the crystal. As is known, it is possible to observe various kinds of non-elastic
scattering in medium, e.g., the Raman scattering, the Brillouin scattering, the Bragg scattering
etc. In the case of Raman scattering the oscillatory quanta corresponding to the molecular
vibrations are excited (or damped). Thus if we deal with PNC, the globules with the size of
several hundred of nanometers play a role of vibrating molecules. Accordingly, the non-elastic
scattering of light caused by the excitations of radial vibrations of the globules was termed as
Globular Scattering (GS) of light. At low intensities of incident radiation this scattering is of
spontaneous character. In Ref. [10] the spectra of spontaneous GS in the synthetic opals were
for the first time observed at irradiation of a CW Ar
++
- laser with the wavelength of 514.5 nm
in the back-scattering geometry. For such measurements the synthetic opals having the
effective sphere diameter D = 204, 237, 284 and 340 nm were used.
The GS spectrum investigated in this work consisted of six well-pronounced Stokes and anti-
Stokes spectral peaks, whose frequencies could be associated with the resonant globular
modes belonging to the range of 7 - 27 GHz. The presence of the anti-Stokes satellites is
explained by a high “population density” of low vibration states at room temperature. As was
found out, the frequencies and relative intensities of the satellites do not depend on the
polarization and the angle of incidence of the radiation. Besides, these parameters did not
change at rotating the sample around the normal axis in the point of incidence of laser
radiation. In Ref. [10] the dependence of frequency of various acoustic modes upon the sphere
diameter was studied. As against to the spontaneous Brillouin scattering, GS can be observed
both in the “forward” and “backward” geometry. The frequency shift for GS appears to be
essentially smaller than that for Raman scattering caused by the molecular vibrations.
1 2 4 5 6 7
3
Fig. 22. The schematic of experimental setup for observing the Stimulated Globular
Scattering (SGS) in the “forward” geometry; 1 – Ruby laser, 2 – half-transparent mirror, 3 –
power meter, 4 - focusing system, 5 – the sample under study, 6 - the Fabri-Perot
interferometer, 7 – mini-spectrometer
The experiments to observe the Stimulated Globular Scattering (SGS) in the PTC were first
described in [6]. The schematic of experimental setup for observing this scattering in the
“forward” and “backward” geometry is illustrated in Figs. 22 and 23 accordingly. Here the
pulsed Ruby laser with the wavelength of 694.3 nm, the bandwidth 0.015 cm
-1
, the
pulsewidth of 20 ns, and the pulse energy of 0.4 J was used. The laser radiation was directed
with the help of focusing lens system 4 (Fig. 22) or 6 (Fig. 23) onto the PTC sample mounted
on a copper cooler and placed into a basin made of a foam plastic. We used the lenses of
Acoustic Properties of theGlobular Photonic Crystals
201
8
4
3
1 2 5 6 7
11 10 9
12
Fig. 23. The schematic of experimental setup for observing the Stimulated Globular
Scattering (SGS) in the “backward” geometry; 1 – Ruby laser, 2, 5, 7 – half-transparent
mirrors, 3, 8, 11 – power meters, 4 - the mirror, which can be removed (optional), 6 -
focusing system, 9 – the sample under study, 10 - the Fabri-Perot interferometer, 12 – mini-
spectrometer.
(a)
(b)
Fig. 24. The interferograms, obtained with the help of the Fabri-Perot interferometer,
relating to the incident radiation spectrum of the Ruby laser (λ = 694.3 nm), case (а), and to
the spectrum of SGS in the “backward” geometry, case (b). In the second photo (case (b)) the
system of double rings corresponds to the incident wave (the rings of smaller radius; the
same rings can be found in the first photo, case (a)), and its scattering Stokes satellite (the
rings of greater radius). In this particular case the free spectral range of the interferometer
was equal to 0.833 cm
-1
.
Waves in Fluids and Solids
202
different focal lengths: 50, 90 and 150 mm. Thus it was possible to perform the
measurements for various intensities of the radiation as well as for various electromagnetic
field distributions inside the sample. The PTC samples under study were manufactured of
thin (their thickness was of 2 – 4 mm) synthetic opal plates with the interface corresponding
to the (111) crystal plane. The laser radiation was focused normally to the crystal interface.
The scattered radiation in the “forward” geometry (Fig. 22) was analyzed in the incident
wave direction with the help of the Fabri-Perot interferometer and a mini-spectrometer 7. In
case of the “backward” geometry (Fig. 23) the scattered radiation was analyzed in the
opposite (with respect to the incident wave) direction with the help of the Fabri-Perot
interferometer 10 and a mini-spectrometer 12. The mirror 4 (Fig. 23) was used for comparing
the spectra of incident Ruby laser radiation and the scattered radiation.
-1,0 -0,5 0,0 0,5 1,0
0,0
0,2
0,4
0,6
0,8
1,0
I a.u.
r, a.u.
Fig. 25. The Stimulated Globular Scattering (SGS) spectrum in the PTC, obtained in the
“backward” geometry. The free spectral range of the Fabri-Perot interferometer was of 0.833
см
-1
. The broad lines are related to the incident laser radiation, while the narrow ones – to
the Stokes satellites of the SGS.
The taking of the scattered radiation spectra was carried out at the room temperature, and
also at cooling the samples up to the temperature of nitrogen boiling (78 К). In the latter case
copper cooler with samples was placed into a foam plastic basin filled with the liquid
nitrogen, while the crystal interface (111) was always above the level of the boiling nitrogen.
For researching the spectra the Fabri-Perot interferometers with various (from 0.42 to 1.67
cm
-1
) free spectral ranges were used. The detectors 3 (Fig. 22), and 3, 8, 11 (Fig. 23) for
measuring the energy of laser radiation and the signal of the SGS in the “forward” and
“backward” geometry accordingly were applied.
In Fig. 24 (a) and (b) the interferograms related to the setup illustrated in Fig. 23 are given.
Fig. 24 (а) shows the spectrum of incident Ruby laser radiation obtained at blocking the
scattering signal by turning the half-transparent mirror 5 to the corresponding angle. In this
case the spectral pattern had the form of the pattern of single interference rings, whose
bandwidth was controlled by incident radiation bandwidth, which was on the level of 0.015
cm
-1
. Figs. 24 (b) and 25 are related to the experiment, where the scattered radiation was
studied in the “backward” geometry. The patterns of double interference rings related to the
incident radiation (the rings of smaller radius), and the Stokes satellites related to the SGS
(the rings of greater radius) are clearly seen. The frequency shift in this case was about 0.44
Acoustic Properties of theGlobular Photonic Crystals
203
cm
-1
. The Stokes signal intensity appeared to be comparable with the incident radiation
intensity. In the case of missing the mirror 4 (see Fig. 23), the spectrum would contain only
the pattern of single rings caused by the SGS only, as in this case the incident radiation
strongly diverges after its reflecting from the sample interface, and this signal does not input
to the detector 12. We plotted the dependence of the frequency shift f for the first Stokes
component of the SGS as the function of the inverse diameter (1/D) of the globules. It
occurred that such dependence is close to the linear one.
Fig. 26. Dependence of the frequency shift of frequency for the first Stokes component of the
SGS versus the inverse diameter of the globules.
The explorations of spectra of the SGS were also performed for the opal matrices filled with
liquids of various refractive index n: water (n = 1.333), acetone (n = 1.359), ethanol (n =
1.362), glycerol (n = 1.470), toluene (n = 1.497), benzene (n = 1.501) and nitrobenzene (n =
1.553). Thus, the phase contrast (the value of h = n/nSiO2, i.e. the ratio of refractive index of
the liquid to that for quartz) changed in the range from 0.91 to 1.06. For example,
impregnation of the opal matrix by acetone sharply decreases the phase contrast, and the
sample becomes almost transparent. It provides an opportunity to observe the SGS in the
scheme of the “forward” geometry of scattering. Similar to the case of the “backward”
geometry, at the “forward” geometry of scattering the pattern of double rings related to the
incident radiation (the rings of smaller diameter) and the Stokes component of the SGS (the
rings of greater diameter) were seen as well. Due to the transparency of the sample treated
by acetone it was possible to observe sufficiently intense Stokes signal of the scattering in
the incident wave direction (the “forward” geometry). The Stokes shift in this case was on
the level of 0.4 cm-1. Note that the SGS was observed with the liquids pointed above both
for the “forward” and “backward” geometry. In the case of “backward” geometry the
frequency shift of about 0.4 cm-1 was observed for the incident wave intensity at the level of
0.12 GW/cm2 for the opal matrices, filled with ethanol and acetone. The increase in the
incident wave intensity up to 0.21 GW/cm2 resulted in occurrence of the second Stokes
components having the frequency shift of about 0.65 cm-1 for acetone, and 0.63 cm-1 for
ethanol. At the same time, for the “forward” geometry (and at the room temperature) only
one Stokes component with the frequency shift of 0.4 cm-1 was observed both for acetone,
and for ethanol.
Waves in Fluids and Solids
204
Fig. 27. Dependence of the energy (E
sc
) of the Stimulated Globular Scattering versus the
energy of the incident wave E
l
for the synthetic opals with the globule diameter of 245 nm.
The geometry of
experiment
The
frequency
shift, cm
-1
The number of
the Stokes
components
The “forward”
geometry, the opal
matrix is not
saturated by any
liquid
0.44 1
The “backward”
geometry, the opal
matrix is saturated by
acetone
0.40
0.65
2
The “forward”
geometry, the opal
matrix is saturated by
acetone
0.40 1
The “backward”
geometry, the opal
matrix is saturated by
ethanol
0.39
0.63
2
The “forward”
geometry, the opal
matrix is saturated by
ethanol
0.37 1
Table 2. The values of the frequency shifts and the number of the Stokes components for
various geometries of experiment.
Acoustic Properties of theGlobular Photonic Crystals
205
At the decrease of temperature up to 78 K the threshold for the SGS was three times
reduced, and the number of observable Stokes components was increased. In the Table 2 the
characteristic parameters of the Stokes components, including the frequency shift and the
number of the Stokes component observed in the particular geometry of experiment are
summarized.
As follows from this table, the values of the frequency shifts for the SGS appear close to
those for the Stimulated Brillouin Scattering, observed earlier in the same liquid samples.
The threshold for occurrence of SGS and the number of the Stokes components depend on
the globule size, the substance in the crystal pores, the energy of incident laser radiation,
and the temperature. In Fig. 27 the dependence of energy of the SGS versus the incident
light energy is plotted for the liquid nitrogen temperature and for the globule diameter
equal to 245 nm in case of the “backward” geometry. As is seen from the graph, at
increasing the incident wave energy the SGS signal approaches the saturation level; note
that the similar effect has been observed earlier for the Stimulated Raman Scattering. It is
thus possible to explain the observed effect by increasing the efficiency of competing
nonlinear processes at the growth of intensity of the incident radiation. The highest
transformation factor of the incident radiation energy to the SGS energy obtained in our
experiments was on the level of 60 %. As the quantum energy of the incident radiation is by
four orders of magnitude higher than the energy of the corresponding radial vibrations of
the globules, the intensity of acoustic phonons, generated by the globular vibrations should
be approximately equal to 10
3
W/cm
2
. The lowest threshold for the SGS was realized for the
so-called pulsating globular modes, the excitation of which should be accompanied by the
oscillations of material density of the globules; this process is expected to have a high Q-
factor. The corresponding acoustic waves have a scalar nature, since they are induced by
radial vibrations of globules, and their propagation is not associated with any specific
direction. In other words, these acoustic waves essentially differ from the acoustic waves of
the vector type, i.e. from the transverse or longitudinal phonons. The wave equation for
such scalar acoustic waves is analogous to the Klein – Gordon equation, describing the
behavior of particles with the non-zero rest mass in the field theory:
() ()
22
0
22 2
1
,,,ut ut
St S
ω
∂
Δ− =
∂
rr
(45)
where S has the sense of a group velocity of the wave at high values of the wave vector k,
00
2~1/cD
ωπν
= ,
0
ν
is the corresponding magnitude of frequency of the pulsating mode,
()
0
(,) exput u i t
ω
=−rkr is the scalar wave function describing the propagation of a
pulsating perturbation in space. According to (45), the dispersion law
()
k
ω
for the scalar
acoustic wave has the form:
2222
0
.Sk
ωω
=+ (46)
As was revealed in the experiments (see Fig. 26), the frequency shift of the first Stokes
component of the SGS is inversely proportional to the globule diameter D, which is in
conformity with Eqn. (46). For the “forward” geometry of experiment the wave vector of the
scalar acoustic wave is equal to
Waves in Fluids and Solids
206
0
',kk k=− (47)
where k
0
and k’ are wave vectors of the incident radiation and the SGS wave. If we deal with
the “backward” geometry, we arrive at
0
'.kk k=+ (48)
Thus, analyzing the spectra of the scattered radiation stimulated by the Ruby laser pulses in
the PTC, we established that the spectral pattern is the set of double interference rings.
These rings are related to the incident laser radiation and the Stokes components of the SGS.
The intensity of the Stokes components is of the same order of magnitude as the incident
wave intensity. This is an additional argument in favor of our statement, that the observed
phenomenon is associated with the stimulated (not spontaneous) scattering.
2. The conclusion
Summarizing, we shown that implantation of various dielectrics, whose refractive index
exceeds that for quartz, into the pores of synthetic opals results in shifting the band-gap of
the PTC to lower frequencies. At the same time, at implantation of metals into these pores
the band-gap is shifted to higher frequencies. Finally, implantation of various substances
having the additional resonant absorption lines belonging to the band-gap of the crystal
results in occurrence of additional sharp peaks of reflectance either in the long-wave or
the short-wave areas of spectrum. The studies of characteristics of the PTC by the
technique of reflectance spectroscopy of the band-gaps have revealed the areas of
abnormal increase of density the photon states in the globular crystal; these areas are
localized close to the band-gap boundaries. The analysis of such areas can allow us to
obtain the lasing in the synthetic opals filled with active media. Besides, we expect that in
the framework of this approach it will be possible to realize various nonlinear processes,
including the Stimulated Raman Scattering of light, [9], Stimulated Globular Scattering of
light [6, 9], generation of optical harmonics, parametrical generation [7] and the afterglow
phenomena [11, 12].
On the basis of the results reported here we can make the following conclusions about the
dynamics of acoustic phonons in the PTC.
1.
The spectrum of acoustic phonons in the PTC contains the allowed and forbidden zones
in the GHz frequency range, similar to the allowed and forbidden zones for the
photons.
2.
The group velocities of the acoustic phonons close to the forbidden zones (band-gaps)
boundaries sharply decrease.
3.
The effective mass of acoustic phonons close to the band-gap boundaries has an
abnormally low magnitude, comparable to the mass of electron.
Let us also note that in the globular PTC a new type of standing acoustic elementary waves
is possible [6, 7]. These standing acoustic waves are induced in the globules and can be
considered as the coupled states of pairs of the acoustic phonons – the so-termed bi-
phonons. As was obtained in the experiments [6, 7], such bi-phonons can be induced by the
incident optical radiation, and the interaction between the optical wave and the bi-phonons
leads to a new type of the stimulated light scattering – the SGS.
Acoustic Properties of theGlobular Photonic Crystals
207
Thus, the globular photonic crystal, being irradiated by powerful enough laser light can be
generator of monochromatic acoustic waves in the GHz spectral range; the frequency of
such waves should depend on the globule parameters and the type of a substance implanted
into the crystal pores.
3. Acknowledgement
The given work was supported by the Russian Foundation for Basic Researches, Grants Nos.
08-02-00114, 10-02-00293, 10-02-90042-Bel, 10-02-90404-Ukr, and by the Presidium of Russian
Academy of Sciences, Program for Basic Researches No. 21.
4. References
[1] Yablonovich, E. (1987). Inhibited Spontaneous Emission in Solid-State Physics and
Electronics, Physical Review Letters, Vol. 58, No. 20, pp. 2059 – 2062.
[2]
John, S. (1987). Strong Localization of Photons in Certain Disordered Dielectric
Superlattices, Physical Review Letters, Vol. 58, No. 23, pp. 2486-2489.
[3]
Gorelik, V.S., Zlobina, L.I., Troitskii, O.A., et al. (2008). LED-excited emission of
opal loaded with silver nanoparticles, Inorganic Materials, Vol. 44, No. 1, pp. 58 –
61.
[4]
Goncharov, A.P., Gorelik, V.S. (2007). Emission of opal photonic crystals under pulsed
laser excitation, Inorganic Materials, Vol. 43, No. 4, pp. 386 – 391.
[5]
Bunkin, N.F., Gorelik, V.S., Filatov, V.V. (2010). Acoustic properties of globular photonic
crystals based on synthetic opals, Physics of Wave Phenomena, Vol. 18, No. 2, pp. 90 –
95.
[6]
Gorelik, V.S. (2007). Optics of globular photonic crystals, Quantum Electronics, Vol. 37,
No. 5, pp. 409-432.
[7]
Gorelik, V.S. (2008). Optics of globular photonic crystals, Laser Physics, Vol. 18, No. 12,
pp. 1479-1500.
[8]
Voshchinskii, Yu.A., Gorelik, V.S. (2011). Dispersion law in photonic crystals in
sinusoidal and quasi-relativistic approximation, Inorganic Materials, Vol. 47, No. 2,
pp. 148 – 151.
[9]
Gorelik, V.S. (2010). Linear and nonlinear optical phenomena in nanostructured
photonic crystals, filled by dielectrics or metals, European Journal – Applied Physics,
Vol. 49, No. 3, 3307.
[10]
Kuok, M.H., Lim, H.S., Ng, S.C., Liu, N.N., Wang, Z.K. (2003). Brillouin study of the
quantization of acoustic modes in nanospheres, Physical Review Letters, Vol. 90, No.
25, 255502.
[11]
Gorelik, V.S., Kudryavtseva, A.D., Tareeva, M.V., et al. (2006). Spectral characteristics
of the radiation of artificial opal crystals in the presence of the photonic flame
effect, JETP Letters, Vol. 84, No. 9, pp. 485-488.
[12]
Gorelik, V.S., Esakov, A.A., Zasavitskii, I.I., (2010), Low-temperature persistent
afterglow in opal photonic crystals under pulsed UV excitation, Inorganic Materials,
Vol. 46, No. 6, pp. 639-643.
Waves in Fluids and Solids
208
[13] Gorelik, V.S., Yurasov, N.I., Gryaznov, V.V., et al., (2009), Optical properties of three-
dimensional magnetic opal photonic crystals, Inorganic Materials, Vol. 45, No. 9, pp.
1013-1017.
Part 2
Acoustic Waves in Fluids
8
A Fourth-Order Runge-Kutta Method
with Low Numerical Dispersion for
Simulating 3D Wave Propagation
Dinghui Yang, Xiao Ma, Shan Chen and Meixia Wang
Department of Mathematical Sciences, Tsinghua University, Beijing,
China
1. Introduction
The numerical solutions of the acoustic-wave equation via finite-differences, finite-elements,
and other related numerical techniques are valuable tools for the simulation of wave
propagation. Many numerical methods of modeling waves propagating in various different
media have been proposed in past three decades (Kosloff & Baysal, 1982; Booth & Crampin,
1983; Virieux, 1986; Dablain, 1986; Chen, 1993; Carcione, 1996; Blanch & Robertsson, 1997;
Komatitsch & Vilotte, 1998; Carcione & Helle, 1999; Carcione et al., 1999; Moczo et al., 2000,
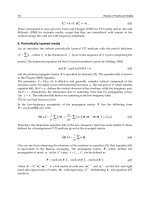
Yang et al., 2002, 2006, 2007; many others). These modeling techniques for the 1D and 2D
cases are typically used as support for a sound interpretation when dealing with complex
geology, or as a benchmark for testing processing algorithms, or used in more or less
automatic inversion procedure by perturbation of the parameters characterizing the elastic
medium until the synthetic records fit the observed real data. In these methods, the finite-
difference (FD) methods were leader and popularly used in Acoustics, Geophysics, and so
on due to their simplicity for computer codes.
However, it is well-known that the conventional finite-difference (FD) methods for solving
the acoustic wave equation often suffer from serious numerical dispersion when too few
grid points per wavelength are used or when the models have large velocity contrasts, or
artefacts caused by the source at grid points (Fei & Larner 1995, Yang et al., 2002). Roughly
speaking, numerical dispersion is an unphysical phenomenon caused by discretizing the
wave equation (Sei & Symes, 1995; Yang et al., 2002). Such a phenomenon makes the wave’s
velocity frequency dependent. More high-order or accurate FD operators have been
developed to minimize the dispersion errors, and those modified FD schemes greatly
improved the computational accuracy compared to the conventional operators. For example,
the staggered-grid FD method with local operators (Virieux, 1986; Fornberg, 1990; Igel et al.,
1995) is an efficient and convenient scheme which improves the local accuracy and has
better stability without increasing computation cost and memory usage compared to the
conventional second-order FD method. However, the staggered-grid (SG) method still
suffers from the numerical dispersion when too few sampling points per minimum
wavelength are used and may result in the numerical anisotropy and induce additional
numerical errors (Virieux, 1986; Igel et al., 1995). Dablain (1986) developed a series of high-
Waves in Fluids and Solids
212
order FD schemes for solving the acoustic wave equation, which greatly improved the
computational accuracy. But these high-order schemes also can not cure the numerical
dispersion effectively when coarse grids are used, and they usually involve in more grids in
a spatial direction than low-order schemes (Yang et al., 2006). For example, the tenth-order
compact FD scheme (e.g., Wang et al., 2002), which usually uses more grids than low order
schemes, also suffers from numerical dispersion. The demand for more grids in high-order
FD methods prevents the algorithms from efficient parallel implementation and artificial
boundary treatment. The flux-corrected transport (FCT) technique was suggested for
eliminating the numerical dispersion (Fei & Larner 1995, Zhang et al., 1999, Yang et al, 2002;
Zheng et al., 2006), but the FCT method can hardly recover the resolution lost by numerical
dispersion when the spatial sampling becomes too coarse (Yang et al., 2002). On the other
hand, waves have inherent dispersions as they propagate in porous media with fluids. This
implies that two kinds of dispersions (numerical dispersion and physical dispersion) might
occur simultaneously in wave fields if the conventional FD methods are used to compute
the wave fields in a porous medium. In such a case, it is not a good idea to use the FCT
technique to eliminate the numerical dispersions because we do not know how to choose the
proper control parameters used in the FCT method for suppressing the numerical
dispersions (Yang et al., 2006). The pseudo-spectral method (PSM) is attractive as the space
operators are exact up to the Nyquist frequency, but it requires the Fourier transform (FFT)
of wave-field to be made, which is computationally expensive for 3D anisotropic models
and has the difficulties of handling non-periodic boundary conditions and the non-locality
on memory access of the FFT, which makes the parallel implementation of the algorithms
and boundary treatments less efficient (Mizutani et al., 2000). Meanwhile, it also suffers
from numerical dispersion in the time direction, and its numerical dispersion is serious as
the Courant number, defined by
0
/ct x
(Dablain 1986; Sei & Symes, 1995), is large,
i.e. as the time increment is large (Yang et al., 2006).
Another easy way to deal with the numerical dispersion is to use fine grids to increase
spatial samples per wavelength. For example, a spatial sampling rate of more than 20 points
per shortest wavelength is needed when a second-order FD scheme is used to obtain reliable
results (Holberg, 1987), whereas a fourth-order scheme seems to produce accurate results at
ten grid points per shortest wavelength. Dablain (1986) states that eight and four grid points
at the Nyquist frequency are required to eliminate numerical dispersion using second-order
and fourth-order FD methods, respectively. More grid points per wavelength mean more
computational cost and storage. It is not advisable to apply these techniques in large-scale
computation, especially for a large scale 3D simulation of seismic wave propagation because
of an intensive use of Central Processing Unit (CPU) time and the requirement of a large
amount of direct-access memory. Fortunately, with the rapid development of computer
performance and the birth of parallel technology in past several decades, 3D wave
simulation through using different numerical methods on a large scale or high frequencies
becomes affordable, and the study of 3D numerical techniques has been a hot spot and
rapidly developed because of its applying to practical issues in the fields of Acoustics and
Geophysics.
Recently, the so-called nearly analytic discrete (NAD) method and optimal NAD (ONAD)
(Yang et al., 2006) suggested by Yang et al. (2003) for acoustic and elastic equations, which
was initially developed by Konddoh et al. (1994) for solving parabolic and hyperbolic
A Fourth-Order Runge-Kutta Method
with Low Numerical Dispersion for Simulating 3D Wave Propagation
213
equations, is another effective method for decreasing the numerical dispersion. The method,
based on the truncated Taylor expansion and the local interpolation compensation for the
truncated Taylor series, uses the wave displacement-, velocity- and their gradient fields to
restructure the wave displacement-fields. On the basis of such a structure, the NAD and
ONAD methods can greatly increase the computational efficiency and save the memory
storage. However, the NAD method has only second-order time accuracy. The ONAD
method is effective in solving the acoustic and elastic wave equations for a single-phase
medium, and it can not be applied to a two-phase porous wave equations such as Biot’s
porous wave equations (Biot, 1956a, b), because these equations include the particle velocity
∂U/∂t (U is the wave displacement) and the ONAD method does not compute this field.
More recently, the NAD and ONAD methods were also extended to solve the Biot
poroelastic equations (Yang et al., 2007a) and the three-dimensional anisotropic wave
equations (Yang et al., 2007b).
The main purpose of this chapter is to develop a new 3D numerical method to effectively
suppress the numerical dispersion caused by the discretization of the acoustic- and elastic-
wave equations through using both the local spatial difference-operator and the fourth-order
Runge-Kutta (RK) method so that the numerical technique developed in this chapter has rapid
computational speed and can save the memory storage. For to do this, we first transform the
original wave equations into a system of first-order partial differential equations with respect
to time t, then we use the local high-order interpolation of the wave displacement, the particle
velocity, and their gradients to approximate the high-order spatial derivatives, which
effectively converts the wave equation to a system of semi-discrete ordinary differential
equations (ODEs). Finally, we use the fourth-order RK method to solve the semi-discrete
ODEs, and change the 4-stage RK formula to 2-stage scheme resulting that the modified 3D RK
algorithm can save the memory storage. Based on such a structure, this method has fourth-
order accuracy both in time and space, and it can be directly extended to solve the two-phase
porous wave equations including the particle velocity ∂U/∂t (Biot, 1956a,b) because of
simultaneously obtaining the velocity fields when computing the displacement fields.
To demonstrate the numerical behavior of this new method, in this chapter we provide the
theoretical study on the properties of the 3D RK method: such as stability criteria, theoretical
error, numerical dispersion, and computational efficiency, and compare the numerical error
of the 3D RK with those of the second-order conventional FD scheme and the fourth-order
LWC method for the 3D initial value problem of acoustic wave equation. Meanwhile, we
also compare the numerical solutions computed by the 3D RK with the analytical solutions,
and present some wave-field modeling results of this method against those of some high-
order FD schemes including the SG and LWC methods for the acoustic case. Besides, we
also present the synthetic seismograms in the 3D three-layer isotropic medium and the wave
field snapshots in the 3D two-layer medium and the 3D transversely isotropic medium with
a vertical symmetry axis (VTI). All these promising numerical results illustrate that the 3D
RK can suppress effectively the numerical dispersion caused by discretizing the wave
equations when too few sampling points per minimum wavelength are used or models have
large velocity contrasts between adjacent layers, further resulting in both increasing the
computational efficiency and saving the memory storage when big grids are used. These
numerical results also imply that simultaneously using both the wave displacement and its
gradients to approximate the high-order spatial derivatives is important for both reducing
the nu
merical dispersion and compensating the important wave field information included
in the displacement and particle velocity gradients.