Electricity Infrastructures in the Global Marketplace Part 13 pptx
Bạn đang xem bản rút gọn của tài liệu. Xem và tải ngay bản đầy đủ của tài liệu tại đây (2.94 MB, 50 trang )
Impacts of GHG Programs and Markets on the Power Industry 569
taken urgently if we are to stabilize CO
2
emissions at 550 ppm or lower (see Figure 15.6).
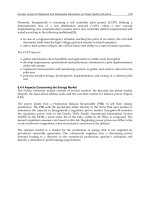
Stabilization at 550 ppm is projected to limit global temperature rise to 2
0
C during the 21
st
Century. The Stern Review Report has estimated that this will require a 60% reduction in
emissions from the energy sector by 2050 (see www.sternreview.org.uk).
Source: World Resources Institute, CAIT Energy Information Administration Reference Scenario,
Energy emissions only.
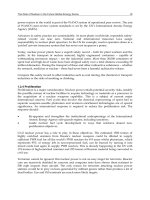
Figure 15.5. Forecast GHG emissions by major developing nations compared to US & Europe
Source IPCC
Figure 15.6. Depiction of CO
2
emission reductions required to stabilize at 550ppm
15.2.2 Major Impacts on Power Systems
Some of the major impacts that CC will have on the power industry and systems include:
Rising average and peak air, ground and water temperatures and variable river water flows
Impact on equipment/plant ratings and power system security
Changes to seasonal demand patterns and peaks
Impact on reserve margins and reliability of supply.
0
1
2
3
4
5
6
7
8
9
US West
Europe
China Russia Japan India Africa Mexico Brazil
Gt CO
2
e
Projected emissions, 2025
2002 emissions
Figure 15.3. Global Average Near Surface Temperatures
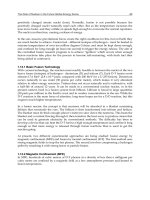
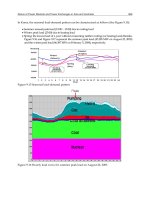
As shown in Figure 15.4, global emissions are forecast to grow from all sources – transport
and power generation growing fastest.
Source: Hadley Centre for Climate Prediction and Research Based on Folland et al (2000) and Jones and
Moberg
Figure 15.4. Forecast growth in GHG emissions by Sector
Current emissions per capita are highest in the developed nations, the USA being highest at
20 tonnes of CO
2
per capita per year. However the larger fast-growing developing countries
such as China and India account for much of the forecast growth in CO
2
e emissions (see
Figure 15.5 ). By 2025 China will be emitting GHGs at the same level as the USA. Thus the
developed and developing nations must both be part of the solution and action must be
9.4
5.4
4.1
5.8
1.5
7.6
16.8
9.3
5.6
8.1
1.9
7.6
0
2
4
6
8
10
12
14
16
18
Power
Generation and
Heat Plants
Transport Industry Agriculture Waste Land Use
2002 actual emissions
2030 projected emissions
G
t
CO
2
e
Electricity Infrastructures in the Global Marketplace570
The IPCC produces Assessment Reports, Technical Papers; and Supporting Material. The
Fourth assessment reports for Working Group I and Working Group II were issued in early
2007. They concluded that GHG forcing has very likely caused most of the observed global
warming over the last 50 years. This strengthened the scientific evidence for anthropogenic
global warming and the case for increasing adaptive capability to cope with the CC already
occurring. The latter is particularly important for the poorest developing countries which
will be hardest hit by CC and have the least capability to adapt.
15.2.3.3 Asia Pacific partnership on clean development and climate (APP)
The Asia-Pacific Partnership (APP) on Clean Development and Climate is an innovative
new effort to accelerate the development and deployment of clean energy technologies. APP
Partner Countries Australia, Canada, China, India, Japan, Republic of Korea, and the United
States have agreed to work together and with private sector partners to meet goals for
energy security, national air pollution reduction, and CC in ways that promote sustainable
economic growth and poverty reduction.
APP was announced by President Bush on July 27, 2005. The initial six countries were
Australia, China, India, Japan, Republic of Korea & USA which together are responsible for
about 50% of world GDP and CO2 Emissions. Canada joined in 2007. The objective of APP
is:- “To focus on practical measures to create new investment, build local capacity and
remove barriers to the introduction of clean, more efficient technologies to improve national
energy security, reduce pollution and address long term CC.” The major power industry
priorities are clean energy & high efficiency.
APP held their first meeting in January 2006 in Sydney, Australia. At this meeting a Work
Plan was developed and eight Task Forces were setup with a focus on the power sector and
energy intensive industries. This included:-
Cleaner fossil energy
Renewable energy technology and distributed generation
Power generation and transmission efficiency (supply-side efficiency)
Steel; Aluminum; Cement; and Coal mining
Buildings and appliances (demand side efficiency).
The Task Forces will build on existing initiatives.
India hosted the second APP meeting in October 2007. Examples of APP successes include:
New Energy Efficiency labels used in China, similar to those in the U.S. ENERGY STAR
program, are expected to encourage Chinese consumers to use more energy efficient
appliances. This APP coordinated activity is projected to bring about an annual carbon
emission reduction of 17.7 million tons of CO2, the equivalent of removing three million cars
from the road for just one appliance, television set-top boxes.
Solar Turbines, an APP private sector partner, has worked with Chinese partners to
identify and setup units that provide 35 megawatts of clean energy technology to the
Extreme weather events (eg hurricanes)
Increased risk to generation, delivery systems (Transmission and Disribution (T&D),
telecommunications, and System Control Center reliability
Emergency response and restoration needs and costs increased
Need for improved extreme weather advance warning systems.
Forest Fires & Floods
Increased risk to generation and delivery (T&D) infrastructure with impacts on
reliability and costs.
Rising sea levels
Risk to coastal generation and delivery systems (T&D) infrastructure and populations
There is a need to monitor and record these climate changes and impacts in order to
establish sound databases on which to base the design and implementation of appropriate
response and adaptation measures.
15.2.3 Major Global Programs
We will now take a look at some of the major programs and initiatives by the international
community to mitigate and adapt to CC.
15.2.3.1 Kyoto protocol
The Kyoto Protocol developed by the UN Framework Convention on Climate Change
(UNFCCC) was signed in December 1997 after two years of debate and negotiation about
the inadequacies of the UNFCCC and its voluntary mechanisms and the need for more
meaningful requirements. Much of the impetus for the Protocol came from the
Intergovernmental Panel on Climate Change’s (IPCC) Second Assessment Report which
concluded that “the balance of evidence suggests a discernible human influence on global
CC.” The Kyoto Protocol commits developed countries which have signed the protocol to
legally-binding emission reduction targets for six greenhouse gases – carbon dioxide,
methane, nitrous oxide, hydro fluorocarbons, per fluorocarbons, and sulfur hexafluoride
to be reached by the period 2008-2012. (CFCs are controlled under the Montreal Protocol.)
These targets, which range by country from –8% to +10%, provide for a 5% emissions
reduction from 1990 levels in aggregate.
With ratification of the protocol by Russia in the fall of 2004, the required level of “55% of
developed country emissions” was reached and the protocol officially came into force on
February 16, 2005. The Issue of the IPCC Fourth Assessment Report in 2007 strengthened the
case for reducing GHG emissions.
15.2.3.2 Intergovernmental panel on climate change (IPCC)
IPCC was established by the World Meteorogical Organization (WMO) and United Nations
Environmental Programme (UNEP) in 1988. It is open to all members of the UN and WMO.
Its objective is:- “to assess scientific, technical and socio- economic information relevant for
the understanding of CC, its potential impacts and options for adaptation and mitigation.”
Impacts of GHG Programs and Markets on the Power Industry 571
The IPCC produces Assessment Reports, Technical Papers; and Supporting Material. The
Fourth assessment reports for Working Group I and Working Group II were issued in early
2007. They concluded that GHG forcing has very likely caused most of the observed global
warming over the last 50 years. This strengthened the scientific evidence for anthropogenic
global warming and the case for increasing adaptive capability to cope with the CC already
occurring. The latter is particularly important for the poorest developing countries which
will be hardest hit by CC and have the least capability to adapt.
15.2.3.3 Asia Pacific partnership on clean development and climate (APP)
The Asia-Pacific Partnership (APP) on Clean Development and Climate is an innovative
new effort to accelerate the development and deployment of clean energy technologies. APP
Partner Countries Australia, Canada, China, India, Japan, Republic of Korea, and the United
States have agreed to work together and with private sector partners to meet goals for
energy security, national air pollution reduction, and CC in ways that promote sustainable
economic growth and poverty reduction.
APP was announced by President Bush on July 27, 2005. The initial six countries were
Australia, China, India, Japan, Republic of Korea & USA which together are responsible for
about 50% of world GDP and CO2 Emissions. Canada joined in 2007. The objective of APP
is:- “To focus on practical measures to create new investment, build local capacity and
remove barriers to the introduction of clean, more efficient technologies to improve national
energy security, reduce pollution and address long term CC.” The major power industry
priorities are clean energy & high efficiency.
APP held their first meeting in January 2006 in Sydney, Australia. At this meeting a Work
Plan was developed and eight Task Forces were setup with a focus on the power sector and
energy intensive industries. This included:-
Cleaner fossil energy
Renewable energy technology and distributed generation
Power generation and transmission efficiency (supply-side efficiency)
Steel; Aluminum; Cement; and Coal mining
Buildings and appliances (demand side efficiency).
The Task Forces will build on existing initiatives.
India hosted the second APP meeting in October 2007. Examples of APP successes include:
New Energy Efficiency labels used in China, similar to those in the U.S. ENERGY STAR
program, are expected to encourage Chinese consumers to use more energy efficient
appliances. This APP coordinated activity is projected to bring about an annual carbon
emission reduction of 17.7 million tons of CO2, the equivalent of removing three million cars
from the road for just one appliance, television set-top boxes.
Solar Turbines, an APP private sector partner, has worked with Chinese partners to
identify and setup units that provide 35 megawatts of clean energy technology to the
Extreme weather events (eg hurricanes)
Increased risk to generation, delivery systems (Transmission and Disribution (T&D),
telecommunications, and System Control Center reliability
Emergency response and restoration needs and costs increased
Need for improved extreme weather advance warning systems.
Forest Fires & Floods
Increased risk to generation and delivery (T&D) infrastructure with impacts on
reliability and costs.
Rising sea levels
Risk to coastal generation and delivery systems (T&D) infrastructure and populations
There is a need to monitor and record these climate changes and impacts in order to
establish sound databases on which to base the design and implementation of appropriate
response and adaptation measures.
15.2.3 Major Global Programs
We will now take a look at some of the major programs and initiatives by the international
community to mitigate and adapt to CC.
15.2.3.1 Kyoto protocol
The Kyoto Protocol developed by the UN Framework Convention on Climate Change
(UNFCCC) was signed in December 1997 after two years of debate and negotiation about
the inadequacies of the UNFCCC and its voluntary mechanisms and the need for more
meaningful requirements. Much of the impetus for the Protocol came from the
Intergovernmental Panel on Climate Change’s (IPCC) Second Assessment Report which
concluded that “the balance of evidence suggests a discernible human influence on global
CC.” The Kyoto Protocol commits developed countries which have signed the protocol to
legally-binding emission reduction targets for six greenhouse gases – carbon dioxide,
methane, nitrous oxide, hydro fluorocarbons, per fluorocarbons, and sulfur hexafluoride
to be reached by the period 2008-2012. (CFCs are controlled under the Montreal Protocol.)
These targets, which range by country from –8% to +10%, provide for a 5% emissions
reduction from 1990 levels in aggregate.
With ratification of the protocol by Russia in the fall of 2004, the required level of “55% of
developed country emissions” was reached and the protocol officially came into force on
February 16, 2005. The Issue of the IPCC Fourth Assessment Report in 2007 strengthened the
case for reducing GHG emissions.
15.2.3.2 Intergovernmental panel on climate change (IPCC)
IPCC was established by the World Meteorogical Organization (WMO) and United Nations
Environmental Programme (UNEP) in 1988. It is open to all members of the UN and WMO.
Its objective is:- “to assess scientific, technical and socio- economic information relevant for
the understanding of CC, its potential impacts and options for adaptation and mitigation.”
Electricity Infrastructures in the Global Marketplace572
15.2.5 Renewable Energy
Renewable energy projects, particularly wind, small hydro and solar, offer compelling
environmental advantages when compared to conventional fossil fuel-based power
generation, including little or no conventional pollutant and GHG emissions. Renewable
energy projects face serious challenges competing with conventional fossil fuel-fired power
projects. They have achieved only limited success in the marketplace.
One of the most significant challenges facing renewable energy projects is the subsidy given
by many governments to conventional forms of energy. Another challenge facing renewable
energy development is the remote, decentralized nature of many renewable energy projects.
The wind industry now has a global installed capacity of over 50,000 MW and is growing at
35 to 40% per year. In 2006, for the first time, more new wind capacity was brought on line
than nuclear power. The solar photovoltaics industry, which is now a $1 billion industry, is
growing at 30% per year. The potential of renewables has not escaped the big conventional
energy companies, including BP Amoco, ABB, GE, Enron and others, all of which have
made considerable investments in the renewable sector. For example BP's alternative
energy investments are valued at up to $7 billion. GE is investing heavily in its
Ecomagination program launched in 2004. This is GE's commitment to imagine and build
innovative solutions that solve today's environmental challenges such as climate change and
benefit customers and society at large. The target investment in renewable energy is $6
billion by 2010. (See:
15.2.6 Emissions Trading
An effective tool or mechanism to achieve cost effective GHG reduction targets is the
concept of emissions trading or transfers among participants. Essentially this involves
treating GHG emission allowances and reduction/removal credit units like any other
commodity in the marketplace. Arrangements are made for them to be traded on national
and international exchanges. The marketplace sets the value of GHG emission credit units.
These are bought and sold by countries and companies to facilitate meeting their GHG
targets at lowest cost. For this to work, just like any other commodity, there must be
internationally accepted standards or a “common currency” for the measurement,
monitoring, reporting, verification and certification of emission credit units [1]. The
effectiveness of emissions trading schemes has been proven by the success of trading in acid
rain gases (SOx and NOx) in curbing acid rain in North America. GHG trading schemes in
the UK and Europe are already showing successful results for reducing CO
2
emissions ( see:
and:
15.2.6.1 Emerging GHG markets
GHG markets can currently be split into two categories:
The Kyoto compliant market
The non-Kyoto compliant market.
coking industry in China. Initial projections indicate an annual savings of
approximately 410,000 metric tons of CO
2
equivalent when all units are operational.
15.2.4 Other Programs and Initiatives
There are many other programs and initiatives at the regional, national, state/province and
individual company/entity level. We consider the North American scene in the following
and the UK Stern Review is noteworthy as it looks at the economics of CC both UK and
global. Clinton’s Large Cities Climate Leadership is also noteworthy - grass roots action in
22 cities.
15.2.4.1 Other programs and initiatives
Federal policies are driven by economy concerns, but the GHG lobby is pushing hard.
States are showing leadership in developing regulations and setting GHG reduction targets:
NJ; MA; NY; NH; ME; CA have set reduction targets
North-east US Initiative (RGGI and RGGR) (see Section 15.4. of this Chapter)
Western Governors Alliance developing GHG policies
The California Assembly passed the Global Warming Solutions Act (Assembly Bill
32) on August 30, 2006 and a companion bill for the electricity sector (Senate Bill
1368) which sets power plant emission performance standards
Many states adopting Renewable Portfolio Standards (RPS) (see Section 15.4.2, and
Energy Efficiency (EE) Programs).
There are several independent voluntary programs by Business, Individuals, and NGOs
15.2.4.2 Canada
The Conservative Government in Canada is developing a “Made in Canada” Plan.
Canada has ratified the Kyoto Protocol but economic analysis shows that meeting Kyoto
targets cannot be done without major impact on the economy (recession). Large industry
emission reduction targets are expected with provision for “offsets”. The focus is on
technology solutions. For example The Early Actions Measures (TEAM) program has
invested in leading edge projects. Also energy efficiency, renewable energy technologies,
clean coal with carbon capture and storage, nuclear and hydrogen are priorities. Through
Kyoto, Canadian entities have access to the Kyoto mechanisms of CDM & JI (see Section
15.2.6 for details).
15.2.4.3 Stern review report main conclusions
Doing nothing is not an option; action must be global, prompt and strong and we must
mitigate and
adapt. As already mentioned, the target for the energy sector is a 60%
reduction in CO
2
emissions by 2050 to stabilize at 550 ppm (see www.sternreview.org.uk).
The global economic impact is manageable “we can grow and be green”. An important
priority is to increase the adaptive capability of the poorest developing countries that will be
hit earliest and hardest by CC and are least able to cope.
Impacts of GHG Programs and Markets on the Power Industry 573
15.2.5 Renewable Energy
Renewable energy projects, particularly wind, small hydro and solar, offer compelling
environmental advantages when compared to conventional fossil fuel-based power
generation, including little or no conventional pollutant and GHG emissions. Renewable
energy projects face serious challenges competing with conventional fossil fuel-fired power
projects. They have achieved only limited success in the marketplace.
One of the most significant challenges facing renewable energy projects is the subsidy given
by many governments to conventional forms of energy. Another challenge facing renewable
energy development is the remote, decentralized nature of many renewable energy projects.
The wind industry now has a global installed capacity of over 50,000 MW and is growing at
35 to 40% per year. In 2006, for the first time, more new wind capacity was brought on line
than nuclear power. The solar photovoltaics industry, which is now a $1 billion industry, is
growing at 30% per year. The potential of renewables has not escaped the big conventional
energy companies, including BP Amoco, ABB, GE, Enron and others, all of which have
made considerable investments in the renewable sector. For example BP's alternative
energy investments are valued at up to $7 billion. GE is investing heavily in its
Ecomagination program launched in 2004. This is GE's commitment to imagine and build
innovative solutions that solve today's environmental challenges such as climate change and
benefit customers and society at large. The target investment in renewable energy is $6
billion by 2010. (See:
15.2.6 Emissions Trading
An effective tool or mechanism to achieve cost effective GHG reduction targets is the
concept of emissions trading or transfers among participants. Essentially this involves
treating GHG emission allowances and reduction/removal credit units like any other
commodity in the marketplace. Arrangements are made for them to be traded on national
and international exchanges. The marketplace sets the value of GHG emission credit units.
These are bought and sold by countries and companies to facilitate meeting their GHG
targets at lowest cost. For this to work, just like any other commodity, there must be
internationally accepted standards or a “common currency” for the measurement,
monitoring, reporting, verification and certification of emission credit units [1]. The
effectiveness of emissions trading schemes has been proven by the success of trading in acid
rain gases (SOx and NOx) in curbing acid rain in North America. GHG trading schemes in
the UK and Europe are already showing successful results for reducing CO
2
emissions ( see:
and:
15.2.6.1 Emerging GHG markets
GHG markets can currently be split into two categories:
The Kyoto compliant market
The non-Kyoto compliant market.
coking industry in China. Initial projections indicate an annual savings of
approximately 410,000 metric tons of CO
2
equivalent when all units are operational.
15.2.4 Other Programs and Initiatives
There are many other programs and initiatives at the regional, national, state/province and
individual company/entity level. We consider the North American scene in the following
and the UK Stern Review is noteworthy as it looks at the economics of CC both UK and
global. Clinton’s Large Cities Climate Leadership is also noteworthy - grass roots action in
22 cities.
15.2.4.1 Other programs and initiatives
Federal policies are driven by economy concerns, but the GHG lobby is pushing hard.
States are showing leadership in developing regulations and setting GHG reduction targets:
NJ; MA; NY; NH; ME; CA have set reduction targets
North-east US Initiative (RGGI and RGGR) (see Section 15.4. of this Chapter)
Western Governors Alliance developing GHG policies
The California Assembly passed the Global Warming Solutions Act (Assembly Bill
32) on August 30, 2006 and a companion bill for the electricity sector (Senate Bill
1368) which sets power plant emission performance standards
Many states adopting Renewable Portfolio Standards (RPS) (see Section 15.4.2, and
Energy Efficiency (EE) Programs).
There are several independent voluntary programs by Business, Individuals, and NGOs
15.2.4.2 Canada
The Conservative Government in Canada is developing a “Made in Canada” Plan.
Canada has ratified the Kyoto Protocol but economic analysis shows that meeting Kyoto
targets cannot be done without major impact on the economy (recession). Large industry
emission reduction targets are expected with provision for “offsets”. The focus is on
technology solutions. For example The Early Actions Measures (TEAM) program has
invested in leading edge projects. Also energy efficiency, renewable energy technologies,
clean coal with carbon capture and storage, nuclear and hydrogen are priorities. Through
Kyoto, Canadian entities have access to the Kyoto mechanisms of CDM & JI (see Section
15.2.6 for details).
15.2.4.3 Stern review report main conclusions
Doing nothing is not an option; action must be global, prompt and strong and we must
mitigate and adapt. As already mentioned, the target for the energy sector is a 60%
reduction in CO
2
emissions by 2050 to stabilize at 550 ppm (see www.sternreview.org.uk).
The global economic impact is manageable “we can grow and be green”. An important
priority is to increase the adaptive capability of the poorest developing countries that will be
hit earliest and hardest by CC and are least able to cope.
Electricity Infrastructures in the Global Marketplace574
retailers to reduce annual emissions from 8.65 to 7.27 tonnes C0
2
e per capita. All six GHGs
expressed as units of one tonne of CO
2
are covered. They can achieve their targets by offsetting
their liability with credits created from renewable energy and low emission generation, tree
planting and energy efficiency. The system operates with a financial penalty of up to, but not
higher than, AUS$15 (about US$8.5) per tonne of excess tonne CO
2
e emitted.
The EU-ETS was launched in January 2005 and trades in EU Allowances (EUA) are already
taking place. In this scheme each regulated entity in the scheme is assigned an “allowance”
or amount of GHG it is permitted to emit. Entities may buy surplus allowances from other
entities to meet their CO
2
commitments. The EU scheme may also be linked with the Kyoto
CDM and JI project mechanisms. Details of the EU-ETS may be found at:
This includes reports on results to
date and plans for the future of the scheme.
Although the former Presidential Administration in the U.S. did not seek ratification of the
Kyoto Protocol, American companies are pursuing voluntary programs to reduce
greenhouse gas emissions. Many are turning to emissions trading as a means of making
reductions in their overall greenhouse gas emissions profile. Tradable units are Verified
Emission Reductions (VERs) and have been trading since 1999. California and other West
Coast states as well as Northeastern states are now entering the carbon constrained world
through government mandates. Nine Midwestern states are also moving in this direction. In
two years, it is highly likely the US Federal Government will mandate economy wide
greenhouse gas emissions reductions that will focus on reducing the US carbon footprint of
over 6 billion tons
Typical prices in voluntary GHG markets range from $1 to $10 per tCO2e and the EU market has
ranged as high as $30 per tCO2e. Latest information on GHG market prices can be obtained by
registering at the web-site of the Evolution Markets LLC:
15.2.7 Mitigate and/or Adapt
While programs to reduce/remove GHGs will help mitigate the extent of change in global
climate, there is still a need to adapt to the changes that have already occurred and may occur
in the future. Thus adaptation programs are equally important to mitigation programs and
there are many national and international initiatives for the assessment of CC variability and
impacts and associated adaptation measures. An internet search for the term “adapting to CC”
gives over 20,000 hits which is a measure of the global, extensive interest in this topic.
The Government of Canada Conference on Adapting to CC held in Montreal in May 2005
covered the following key topics which is indicative of the global scope of CC impacts:
Coastal Zones; Forestry and Forest Ecosystems; Infrastructure; Communities; Industry;
Engineering; The Arctic; Health and Vulnerable Populations; Tourism; Regional Water
Impacts: Physical and Social Health Impacts; Agriculture; Water Resources Management;
Fish and Aquatic Resources. There were also general sessions on Risk Management;
Hazards and Extremes; Research Programs and Tools; Adaptive Capacity; Economics;
Education and Awareness; and Taking Action on Adaptation.
The bulk of the current global activity in GHG trading is centered on the Kyoto compliant
market. Developed countries, which have ratified the Kyoto Protocol and accepted their
GHG emission reduction target, termed Annex 1 countries, may meet their commitments
through domestic CC policy activity and the use of the Kyoto mechanisms. These
“flexibility” mechanisms are Joint Implementation (JI); Clean Development Mechanism
(CDM) and International Emissions Trading (IET).
Both JI and CDM are "project based mechanisms" and involve carrying out CC mitigation
projects for the reduction or removal of GHG emissions. JI projects allow Annex I Parties to
implement projects that reduce GHG emissions by sources, or enhance removals by "sinks",
in the territories of other Annex I Parties, and to credit the resulting emission reduction
units (ERU) against their own emission targets. CDM projects allow Annex I Parties to
implement projects that reduce or remove GHG emissions in developing countries. Annex I
Parties may use certified emission reductions (CER) generated by CDM projects in
developing countries to contribute to compliance with their GHG emission commitments.
The rules governing the CDM are available at: and those for JI
projects are expected to be similar – see IET permits an
Annex I Party to transfer (sell) part of its assigned GHG emission allowance (the amount of
emissions the Party may emit during the commitment period) to another Annex I Party. It
also permits trading of CERs and ERUs – see following web-site for background and rules:
Canada's Clean Development Mechanism and Joint Implementation (CDM & JI) Office was
established within the Climate Change and Energy Division of the Department of Foreign
Affairs and International Trade (DFAIT)) in 1998. The Office is the federal government's
focal point for CDM and JI activities. It was created to enhance Canada's capacity to take
advantage of the opportunities offered by the CDM and JI. Opportunities for Canadian
industry can include: (i) generation of emission reduction credits; (ii) access to new markets
and investment opportunities; (iii) an opportunity to demonstrate the viability of a
voluntary approach; (iv) a showcase for environmental leadership. The services provided
are aimed at reducing transaction costs for Canadian companies given the elaborate steps
and procedures for these mechanisms.
The main non-Kyoto compliant markets are the UK Emission Trading Scheme (UK-ETS), the
European Union-Emission Trading Scheme (EU-ETS), the Chicago Climate Exchange, and
the New South Wales Trading System. The UK-ETS was launched in 2002 and was the
world’s first national economy wide GHG trading scheme. It is essentially a cap and trade
scheme open to all entities in the UK, including 6,000 companies that already had CC
Agreements. Full details of the scheme and results to date can be found on the web-site of
the UK Department of Environment, Food and Rural Affairs (DEFRA) at:
See the following web-site for a full report on 2006 results:-
In 2003, the New South Wales (NSW) Government in Australia introduced an emissions
trading scheme building on an existing emissions benchmarking program in connection
with electricity retailer licensing conditions. The benchmark system requires electricity
Impacts of GHG Programs and Markets on the Power Industry 575
retailers to reduce annual emissions from 8.65 to 7.27 tonnes C0
2
e per capita. All six GHGs
expressed as units of one tonne of CO
2
are covered. They can achieve their targets by offsetting
their liability with credits created from renewable energy and low emission generation, tree
planting and energy efficiency. The system operates with a financial penalty of up to, but not
higher than, AUS$15 (about US$8.5) per tonne of excess tonne CO
2
e emitted.
The EU-ETS was launched in January 2005 and trades in EU Allowances (EUA) are already
taking place. In this scheme each regulated entity in the scheme is assigned an “allowance”
or amount of GHG it is permitted to emit. Entities may buy surplus allowances from other
entities to meet their CO
2
commitments. The EU scheme may also be linked with the Kyoto
CDM and JI project mechanisms. Details of the EU-ETS may be found at:
This includes reports on results to
date and plans for the future of the scheme.
Although the former Presidential Administration in the U.S. did not seek ratification of the
Kyoto Protocol, American companies are pursuing voluntary programs to reduce
greenhouse gas emissions. Many are turning to emissions trading as a means of making
reductions in their overall greenhouse gas emissions profile. Tradable units are Verified
Emission Reductions (VERs) and have been trading since 1999. California and other West
Coast states as well as Northeastern states are now entering the carbon constrained world
through government mandates. Nine Midwestern states are also moving in this direction. In
two years, it is highly likely the US Federal Government will mandate economy wide
greenhouse gas emissions reductions that will focus on reducing the US carbon footprint of
over 6 billion tons
Typical prices in voluntary GHG markets range from $1 to $10 per tCO2e and the EU market has
ranged as high as $30 per tCO2e. Latest information on GHG market prices can be obtained by
registering at the web-site of the Evolution Markets LLC:
15.2.7 Mitigate and/or Adapt
While programs to reduce/remove GHGs will help mitigate the extent of change in global
climate, there is still a need to adapt to the changes that have already occurred and may occur
in the future. Thus adaptation programs are equally important to mitigation programs and
there are many national and international initiatives for the assessment of CC variability and
impacts and associated adaptation measures. An internet search for the term “adapting to CC”
gives over 20,000 hits which is a measure of the global, extensive interest in this topic.
The Government of Canada Conference on Adapting to CC held in Montreal in May 2005
covered the following key topics which is indicative of the global scope of CC impacts:
Coastal Zones; Forestry and Forest Ecosystems; Infrastructure; Communities; Industry;
Engineering; The Arctic; Health and Vulnerable Populations; Tourism; Regional Water
Impacts: Physical and Social Health Impacts; Agriculture; Water Resources Management;
Fish and Aquatic Resources. There were also general sessions on Risk Management;
Hazards and Extremes; Research Programs and Tools; Adaptive Capacity; Economics;
Education and Awareness; and Taking Action on Adaptation.
The bulk of the current global activity in GHG trading is centered on the Kyoto compliant
market. Developed countries, which have ratified the Kyoto Protocol and accepted their
GHG emission reduction target, termed Annex 1 countries, may meet their commitments
through domestic CC policy activity and the use of the Kyoto mechanisms. These
“flexibility” mechanisms are Joint Implementation (JI); Clean Development Mechanism
(CDM) and International Emissions Trading (IET).
Both JI and CDM are "project based mechanisms" and involve carrying out CC mitigation
projects for the reduction or removal of GHG emissions. JI projects allow Annex I Parties to
implement projects that reduce GHG emissions by sources, or enhance removals by "sinks",
in the territories of other Annex I Parties, and to credit the resulting emission reduction
units (ERU) against their own emission targets. CDM projects allow Annex I Parties to
implement projects that reduce or remove GHG emissions in developing countries. Annex I
Parties may use certified emission reductions (CER) generated by CDM projects in
developing countries to contribute to compliance with their GHG emission commitments.
The rules governing the CDM are available at: and those for JI
projects are expected to be similar – see IET permits an
Annex I Party to transfer (sell) part of its assigned GHG emission allowance (the amount of
emissions the Party may emit during the commitment period) to another Annex I Party. It
also permits trading of CERs and ERUs – see following web-site for background and rules:
Canada's Clean Development Mechanism and Joint Implementation (CDM & JI) Office was
established within the Climate Change and Energy Division of the Department of Foreign
Affairs and International Trade (DFAIT)) in 1998. The Office is the federal government's
focal point for CDM and JI activities. It was created to enhance Canada's capacity to take
advantage of the opportunities offered by the CDM and JI. Opportunities for Canadian
industry can include: (i) generation of emission reduction credits; (ii) access to new markets
and investment opportunities; (iii) an opportunity to demonstrate the viability of a
voluntary approach; (iv) a showcase for environmental leadership. The services provided
are aimed at reducing transaction costs for Canadian companies given the elaborate steps
and procedures for these mechanisms.
The main non-Kyoto compliant markets are the UK Emission Trading Scheme (UK-ETS), the
European Union-Emission Trading Scheme (EU-ETS), the Chicago Climate Exchange, and
the New South Wales Trading System. The UK-ETS was launched in 2002 and was the
world’s first national economy wide GHG trading scheme. It is essentially a cap and trade
scheme open to all entities in the UK, including 6,000 companies that already had CC
Agreements. Full details of the scheme and results to date can be found on the web-site of
the UK Department of Environment, Food and Rural Affairs (DEFRA) at:
See the following web-site for a full report on 2006 results:-
In 2003, the New South Wales (NSW) Government in Australia introduced an emissions
trading scheme building on an existing emissions benchmarking program in connection
with electricity retailer licensing conditions. The benchmark system requires electricity
Electricity Infrastructures in the Global Marketplace576
15.2.7.1 Mitigation priorities for power industry
No silver bullet: - Silver buckshot!!
The scale of the problem is so large that there is no single solution to reducing global GHG
emissions. We will need all the options to achieve success, including:
o Energy Efficiency and Conservation (End Use and Supply Side)
o Low emission energy technologies (Renewable energy such as wind, solar, hydro,
geothermal etc)
o Clean Coal (Includes Carbon Capture & Storage -CCS)
o Reducing dependence on fossil fuels
o Development of LNG & Biofuels
o Advanced Nuclear new build
o Development of the Hydrogen economy.
15.2.7.2 Adaptation priorities for power industry
Adaptation is essential to deal with CC that has already occurred
Adaptive capacities need to be increased to deal with CC impacts, particularly in
poor countries that will be hardest hit and least able to cope
Power Sector Adaptation Measures: Examples
- “Hardening” grid systems against extreme events
- Coping with changed load patterns & plant ratings
- Strengthening advance warning, emergency response & restoration plans
- Improving back-up telecommunications and grid control
- Extending climate monitoring and recording.
15.2.8 Section Conclusions
The global response to CC is diverse and major and covers both mitigation and adaptation
technologies. Much more needs to be done and business and governments must work together
on cost effective solutions to minimize risk. Major thrusts must be on clean, hi-efficiency
technology for mitigation, and increasing adaptive capacity, particularly in the poorest countries
that will be hit earliest and hardest by CC and are least able to cope. There may be funding
challenges as will ensuring the skilled resources are available to implement the needed measures.
Climate science is hugely complex and still fraught with uncertainties and it is prudent to
adopt a "no regrets" strategy at this time that makes good sense and minimizes costs and
risks whatever the outcome on actual global climate change. We need a risk management
approach that balances the costs and economic risks of overly severe CO
2
emission
reduction targets against the costs and benefits of increasing our adaptive capability to cope
with climate change This is particularly so in the developing countries which would be
hardest hit by overly restrictive targets affecting their economic development and currently
have the least adaptive capability.
15.3 Value of Non-Carbon Power and Emissions Avoidance
Estimates for the range of values to be ascribed to the avoidance and reduction of emissions
using non-carbon or low emitting sources is now evaluated. This analysis utilizes published data
The financial and insurance industries are particularly interested in the risks and impacts
associated with CC. Reference [6] provides an overview of risks to the financial sector and
stresses the need for international collaboration and research. Reference [7] provides the
perspective of the insurance industry.
The IPCC Fourth Assessment Report Working Group II Report "Impacts, Adaptation and
Vulnerability" has Chapter 18 discussing the inter-relationships between mitigation and
adaptation measures and the trade-offs between the two. See:-
Striking the balance between mitigation and adaptation investments is an exercise in risk
management. Focusing on technology measures for adapting to CC that has and may continue
to occur is strategically important in managing those risks. Because of the complexities and
considerable uncertainties in CC science and predictions, investment in adaptation measures
to manage climate risks may prove to be of better value and have more certain, tangible
benefits than CC mitigation (GHG reduction) measures. This is particularly important for the
poorest developing countries which are least able to adapt and would be hardest hit. The risks
of not developing the economies of these countries (that requires energy development as a
critical driver) is far greater than the risks of CC. The human race has shown a great ability
and propensity to adapt to climate circumstances beyond its control.
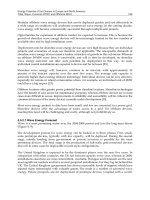
Figure 15.7 illustrates a classic cost/risk minimization approach to mitigation and
adaptation. The mitigation curve is characterized by rapidly increasing costs and risks to the
global economy the lower the target for CO
2
e concentrations in the atmosphere. The
adaptation curve is characterized by rapidly increasing costs and risks to the climate and the
global economy the higher CO
2
e concentrations are permitted to go. The sum of the two
curves gives a range of CO
2
e concentrations for minimizing cost and risk. This is estimated
by some researchers to be in the range of 450 to 550 ppm of CO
2
e.
Figure 15.7. Cost/Risk Minimization Curves
Impacts of GHG Programs and Markets on the Power Industry 577
15.2.7.1 Mitigation priorities for power industry
No silver bullet: - Silver buckshot!!
The scale of the problem is so large that there is no single solution to reducing global GHG
emissions. We will need all the options to achieve success, including:
o Energy Efficiency and Conservation (End Use and Supply Side)
o Low emission energy technologies (Renewable energy such as wind, solar, hydro,
geothermal etc)
o Clean Coal (Includes Carbon Capture & Storage -CCS)
o Reducing dependence on fossil fuels
o Development of LNG & Biofuels
o Advanced Nuclear new build
o Development of the Hydrogen economy.
15.2.7.2 Adaptation priorities for power industry
Adaptation is essential to deal with CC that has already occurred
Adaptive capacities need to be increased to deal with CC impacts, particularly in
poor countries that will be hardest hit and least able to cope
Power Sector Adaptation Measures: Examples
- “Hardening” grid systems against extreme events
- Coping with changed load patterns & plant ratings
- Strengthening advance warning, emergency response & restoration plans
- Improving back-up telecommunications and grid control
- Extending climate monitoring and recording.
15.2.8 Section Conclusions
The global response to CC is diverse and major and covers both mitigation and adaptation
technologies. Much more needs to be done and business and governments must work together
on cost effective solutions to minimize risk. Major thrusts must be on clean, hi-efficiency
technology for mitigation, and increasing adaptive capacity, particularly in the poorest countries
that will be hit earliest and hardest by CC and are least able to cope. There may be funding
challenges as will ensuring the skilled resources are available to implement the needed measures.
Climate science is hugely complex and still fraught with uncertainties and it is prudent to
adopt a "no regrets" strategy at this time that makes good sense and minimizes costs and
risks whatever the outcome on actual global climate change. We need a risk management
approach that balances the costs and economic risks of overly severe CO
2
emission
reduction targets against the costs and benefits of increasing our adaptive capability to cope
with climate change This is particularly so in the developing countries which would be
hardest hit by overly restrictive targets affecting their economic development and currently
have the least adaptive capability.
15.3 Value of Non-Carbon Power and Emissions Avoidance
Estimates for the range of values to be ascribed to the avoidance and reduction of emissions
using non-carbon or low emitting sources is now evaluated. This analysis utilizes published data
The financial and insurance industries are particularly interested in the risks and impacts
associated with CC. Reference [6] provides an overview of risks to the financial sector and
stresses the need for international collaboration and research. Reference [7] provides the
perspective of the insurance industry.
The IPCC Fourth Assessment Report Working Group II Report "Impacts, Adaptation and
Vulnerability" has Chapter 18 discussing the inter-relationships between mitigation and
adaptation measures and the trade-offs between the two. See:-
Striking the balance between mitigation and adaptation investments is an exercise in risk
management. Focusing on technology measures for adapting to CC that has and may continue
to occur is strategically important in managing those risks. Because of the complexities and
considerable uncertainties in CC science and predictions, investment in adaptation measures
to manage climate risks may prove to be of better value and have more certain, tangible
benefits than CC mitigation (GHG reduction) measures. This is particularly important for the
poorest developing countries which are least able to adapt and would be hardest hit. The risks
of not developing the economies of these countries (that requires energy development as a
critical driver) is far greater than the risks of CC. The human race has shown a great ability
and propensity to adapt to climate circumstances beyond its control.
Figure 15.7 illustrates a classic cost/risk minimization approach to mitigation and
adaptation. The mitigation curve is characterized by rapidly increasing costs and risks to the
global economy the lower the target for CO
2
e concentrations in the atmosphere. The
adaptation curve is characterized by rapidly increasing costs and risks to the climate and the
global economy the higher CO
2
e concentrations are permitted to go. The sum of the two
curves gives a range of CO
2
e concentrations for minimizing cost and risk. This is estimated
by some researchers to be in the range of 450 to 550 ppm of CO
2
e.
Figure 15.7. Cost/Risk Minimization Curves
Electricity Infrastructures in the Global Marketplace578
15.3.2 Valuing Emissions Reduction
To value reduction and energy source substitution, it is necessary to value usage and
emissions increase, which in present society are an acquired historical right. Then, the
several different approaches to establishing a benchmark value for emissions avoidance by
comparing it to the value of the original emissions themselves can be evaluated.
15.3.2.1 Economic value to a nation and the world
The value of carbon energy to the world is in providing economic growth. The purely
economic value of the carbon emissions and power source is reflected in producing financial
wealth for the country (such as the national GDP) using carbon energy. Energy is greatest in
developed (rich) nations and a correlation between the growth in GDP to the growth in
carbon energy use can be observed. This relationship also holds true at the global level.
Hence, the global growth in GHG concentration in the atmosphere over the last 30 years
(measured as ppmCO
2
at Mauna Loa, Hawaii where 1 ppmCO
2
~ 9.10
12
tCO
2
) is directly and
linearly correlated to the Gross World Product (GWP) (measured in teradollars, $10
12
US).
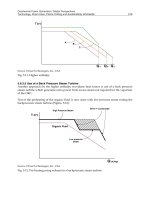
GWP data (source: is compared
with CO
2
concentrations from Mauna Loa in Figure 15.8. To reduce the effect of the year-to-year
noise in the CO
2
concentrations, five-year averages for GWP are plotted against the change in
CO
2
measured over those five years. Rather than plot ppm values of CO
2
, the change is
converted to Gt of CO
2
released based on 7.9 Gt of CO
2
required to cause a 1 ppm increase in the
atmosphere accompanied by an equal release being absorbed in the oceans. 1 ppm was taken to
be equivalent to a total of 15.8 Gt of CO
2
released. A linear fit of the data was calculated as:
CO
2
(Gt) = 0.433 GWP(t$) + 8.70
The data can be interpreted as flattening over time, indicating diminishing energy intensity
in the creation of value, but the average global economic value between 1950 and 2004 is 430
$(US 2004)/t CO
2
(it is reasonable to use 1950 as the base year since the CO
2
build-up prior
to about 1950 was relatively small).
CO
2
= 0.433 GWP + 8.6964
0
5
10
15
20
25
30
35
10 20 30 40 50 60
GWP (T$US 2004)
CO
2
emitted (GT)
Figure 15.8. The global correlation.
15.3.2.2 Economic value to investors
In addition, the economics also involve the value to shareholders and investors in oil and
gas companies: they have implicitly assigned a value by owning the company and taking a
dividend on the profits.
to establish the values of the business and investor return, emissions avoidance, energy
reduction, efficiency improvement, conservation and alternate technology deployment. It shows
that there is no one unique, globally traded and valid value. The range of values ascribed to
avoidance is coupled to the economic value of energy use. The range of costs of emissions
reduction is highly dependent on the socio-politico-economic assumptions. Numerical results for
both present and future energy scenarios are provided, explicitly including hydrogen and other
non-carbon power sources in defining the economic value of a sustainable non-carbon future.
That carbon and emissions avoidance has value has been already understood and analyzed by
the oil and gas industry, and carbon pricing has been assumed and undertaken in business
planning [8]. In the UK, there is an ongoing formal review [9] that states: “The economic
challenges are complex. At its most basic level, CC is an externality: the emission of greenhouse gases
damages others. But these costs will be felt over a long period and over the entire globe; their exact
nature is uncertain; they interact with other market failures and imperfections; and those most affected –
future generations – are not able to speak up for their interests. This points to a long-term international
collaborative response. Effective collaboration will require a shared understanding of the incentives and
institutions needed, and careful attention to the complex ethical issues involved.”
In the UK there are future generational and moral issues to consider, with their own special
emotive power and value. CC has already impacted commercial and industrial strategy.
One leading oil and gas company has taken a position summarized as: “We have worked for
most of the last decade on the basis that one day carbon will be priced and that the application of
technology which can reduce carbon will have a commercial value.”[8].
To proceed with a transparent economic analysis, the existence and definition of two
contributory values may be postulated and considered: an objective monetary value based
on a market or trading of rights to emit GHGs and the associated emission avoidance costs;
and a subjective social value based on the estimates of the probabilities of mitigation, of
planet-wide changes to human lifestyle, and of species change, and their relevant costs. The
true comparative “value” is therefore a composite estimate, including both tangible and
intangible costs and risks, and depends on evaluation of the components contributing to
these two types of values.
15.3.1 Nuclear Energy Example
To look at any alternate energy sources, it is necessary to define ones own costs and
emissions, based on prevailing market and economic conditions. The potential impacts of
GHG reduction and avoidance, and the opportunities and benefits from fuel switching that
would be needed to stabilize the atmospheric GHGs to preserve economic growth and social
progress, should be defined.
Illustrative estimates of the “value” to be assigned to avoidance and reduction using nuclear
energy from the present zero value assigned to nuclear energy to the actual economic and
social values derived from emissions avoidance that would still supply a sustainable energy
future should be determined. These can then be directly compared to values derived from
carbon credit trading, energy portfolio standards, and carbon sequestration, including the
direct and indirect costs, risks and uncertainties.
Impacts of GHG Programs and Markets on the Power Industry 579
15.3.2 Valuing Emissions Reduction
To value reduction and energy source substitution, it is necessary to value usage and
emissions increase, which in present society are an acquired historical right. Then, the
several different approaches to establishing a benchmark value for emissions avoidance by
comparing it to the value of the original emissions themselves can be evaluated.
15.3.2.1 Economic value to a nation and the world
The value of carbon energy to the world is in providing economic growth. The purely
economic value of the carbon emissions and power source is reflected in producing financial
wealth for the country (such as the national GDP) using carbon energy. Energy is greatest in
developed (rich) nations and a correlation between the growth in GDP to the growth in
carbon energy use can be observed. This relationship also holds true at the global level.
Hence, the global growth in GHG concentration in the atmosphere over the last 30 years
(measured as ppmCO
2
at Mauna Loa, Hawaii where 1 ppmCO
2
~ 9.10
12
tCO
2
) is directly and
linearly correlated to the Gross World Product (GWP) (measured in teradollars, $10
12
US).
GWP data (source: is compared
with CO
2
concentrations from Mauna Loa in Figure 15.8. To reduce the effect of the year-to-year
noise in the CO
2
concentrations, five-year averages for GWP are plotted against the change in
CO
2
measured over those five years. Rather than plot ppm values of CO
2
, the change is
converted to Gt of CO
2
released based on 7.9 Gt of CO
2
required to cause a 1 ppm increase in the
atmosphere accompanied by an equal release being absorbed in the oceans. 1 ppm was taken to
be equivalent to a total of 15.8 Gt of CO
2
released. A linear fit of the data was calculated as:
CO
2
(Gt) = 0.433 GWP(t$) + 8.70
The data can be interpreted as flattening over time, indicating diminishing energy intensity
in the creation of value, but the average global economic value between 1950 and 2004 is 430
$(US 2004)/t CO
2
(it is reasonable to use 1950 as the base year since the CO
2
build-up prior
to about 1950 was relatively small).
CO
2
= 0.433 GWP + 8.6964
0
5
10
15
20
25
30
35
10 20 30 40 50 60
GWP (T$US 2004)
CO
2
emitted (GT)
Figure 15.8. The global correlation.
15.3.2.2 Economic value to investors
In addition, the economics also involve the value to shareholders and investors in oil and
gas companies: they have implicitly assigned a value by owning the company and taking a
dividend on the profits.
to establish the values of the business and investor return, emissions avoidance, energy
reduction, efficiency improvement, conservation and alternate technology deployment. It shows
that there is no one unique, globally traded and valid value. The range of values ascribed to
avoidance is coupled to the economic value of energy use. The range of costs of emissions
reduction is highly dependent on the socio-politico-economic assumptions. Numerical results for
both present and future energy scenarios are provided, explicitly including hydrogen and other
non-carbon power sources in defining the economic value of a sustainable non-carbon future.
That carbon and emissions avoidance has value has been already understood and analyzed by
the oil and gas industry, and carbon pricing has been assumed and undertaken in business
planning [8]. In the UK, there is an ongoing formal review [9] that states: “The economic
challenges are complex. At its most basic level, CC is an externality: the emission of greenhouse gases
damages others. But these costs will be felt over a long period and over the entire globe; their exact
nature is uncertain; they interact with other market failures and imperfections; and those most affected –
future generations – are not able to speak up for their interests. This points to a long-term international
collaborative response. Effective collaboration will require a shared understanding of the incentives and
institutions needed, and careful attention to the complex ethical issues involved.”
In the UK there are future generational and moral issues to consider, with their own special
emotive power and value. CC has already impacted commercial and industrial strategy.
One leading oil and gas company has taken a position summarized as: “We have worked for
most of the last decade on the basis that one day carbon will be priced and that the application of
technology which can reduce carbon will have a commercial value.”[8].
To proceed with a transparent economic analysis, the existence and definition of two
contributory values may be postulated and considered: an objective monetary value based
on a market or trading of rights to emit GHGs and the associated emission avoidance costs;
and a subjective social value based on the estimates of the probabilities of mitigation, of
planet-wide changes to human lifestyle, and of species change, and their relevant costs. The
true comparative “value” is therefore a composite estimate, including both tangible and
intangible costs and risks, and depends on evaluation of the components contributing to
these two types of values.
15.3.1 Nuclear Energy Example
To look at any alternate energy sources, it is necessary to define ones own costs and
emissions, based on prevailing market and economic conditions. The potential impacts of
GHG reduction and avoidance, and the opportunities and benefits from fuel switching that
would be needed to stabilize the atmospheric GHGs to preserve economic growth and social
progress, should be defined.
Illustrative estimates of the “value” to be assigned to avoidance and reduction using nuclear
energy from the present zero value assigned to nuclear energy to the actual economic and
social values derived from emissions avoidance that would still supply a sustainable energy
future should be determined. These can then be directly compared to values derived from
carbon credit trading, energy portfolio standards, and carbon sequestration, including the
direct and indirect costs, risks and uncertainties.
Electricity Infrastructures in the Global Marketplace580
15.3.2.4 Actual trading value
A value can therefore be assigned from what emitters will actually pay to preserve or obtain
the rights or credit of releasing GHGs. This value can be determined from a defined and
hopefully market-driven “emissions trading” scheme, where the right to emit is established
via some limit placed on the total allowed amount (a so-called cap-and-trade system).
Within the pre-determined GHG emissions amount, which is distributed between emitters
and energy market sectors, credits can be traded and exchanged for a price determined by
credit supply and emissions demand.
Currently, it is estimated [10] that about 100 million tons of carbon credits are transacted in
various markets worldwide. The World Bank report [11] stated: “There are four active markets for
GHG allowances as of May 2005; the EU-ETS, the UK Emissions Trading System, the New South
Wales trading system and the Chicago Climate Exchange”. Volumes exchanged on these allowance
markets have increased dramatically compared with 2005, and is now comparable to the
volumes exchanged through project-based transactions. Cumulative volume exchanged on
these four markets from January 2004 to March 2005 is about 56MtCO
2
e.
Of the four allowance markets, the EU-ETS is the largest, with an estimated 39MtCO
2
e
exchanged since January 2004, the bulk transacted since January 2005.
Unlike project-based assets, allowances are homogeneous assets, and purchase contracts for
allowances are fairly homogenous. As a result, the spread of prices for one tonne of CO
2
of
emissions (an EUA) at any given point in time is small.
The dominant trading is clearly in the EU, where an emissions trading schemed has been
deployed which allowed trading of emissions credits (i.e., emissions rights) on the open market,
within some overall limit or cap on the EU total. Presently, some 25 countries with some 6,000
participating companies constitute a trading volume of 2.1 billion allocated tons CO
2
per year.
In this European Trading Scheme (ETS) predictions have also been made of the effect of
demand on the trading price [12].
The estimates ranged from $20 to $100$/tCO
2
depending on actual US demand, which is
presently zero. A useful conversion factor to bear in mind, since economic studies use different
currencies, is that for 2006 currency conversion rates, $100/tC = 20€/tCO
2
. For 2005-2006 the
ETS trading value range was between 10 and 30€/tCO
2
[13], and fluctuated widely.
This estimate is as close to an actual market value that is available. It is artificial as it refers
solely in the EU, is not a global value, and is dependent on meeting arbitrary EU Kyoto targets.
15.3.2.5 Negative value of negawatts: conservation
and efficiency relative socio-economic values
The conservation cost is obtained by adopting or encouraging restrictions in the energy
demand (so-called demand-side management) and use, plus impact of efficiency and
conservation measures versus adding energy sources.
To set the market value, it is noted that oil and gas already has an assigned market value,
and hence so has the carbon content used for energy production, since 1 bbl oil contains
~115kgC (= 495 kgCO
2
).
To set the order of magnitude, the value to stockholders and owners as profit from
corporate sales is taken. At the 2006 BP Annual General Meeting (www.bp.com
), and in the
Financial and Operating Information for 2001-2005, it was reported that $19B was
distributed to investors in 2005-2006 with a replacement cost /bbl in 2005 of ~$48/bbloe.
The profit per $/kgC = 41.8¢/kgC = 418$/tC translates to a present carbon emissions value
to investors of 114 $/tCO
2
, assuming no carbon is sequestered and all is used in combustion,
oxidation and/or transportation.
The future potential or prospective distribution to shareholders is given as ~$65B over the
three years 2006-2008. With a refining margin ~$850/bbl, the 2005 production was
~2.5Mbbl/d at a cost of ~$50/bbl ~$45B/a.
Returning about $65B over 3 years ~$22B/a, so the projected future profit/bbloe
~$22B/0.91Bbbl = $24/bbloe. Hence the investors’ future Carbon value ~$48/tCO
2
.
To attract investment or to be economically competitive without subsidy, any non-carbon
alternate or carbon reduction scheme must have at least this substitute market investment value.
15.3.2.3 Assumed value of the right to emit
In a carbon-constrained system, the right to emit is governed by voluntary and/or regulated
limits on total emissions. Thus emitting carbon can have a price or cost. The Kyoto Treaty
targets are approximately a 5% global percentage reduction from prior years (1990 was
taken as the baseline). To meet or encourage meeting this modest target, some nations
invoked an “emissions trading schemes” either individually or collectively.
Many economic studies have attempted to determine or set limits on the assumed value, and
establish the impact on the national, regional or local economy (e.g., Regional Greenhouse Gas
Initiative (RGGI) report). Funds that are spent on carbon costs that raise energy prices cannot
be spent on consumer goods. If promoting such a scheme a low value is assumed (typically $5-
10/tCO
2
), but the results are clearly sensitive to the assumed cost. In Canada, the impact on
future national “scenarios” were examined under certain key assumptions.
These included the assumptions of a +2%/a base GDP growth, but also assumed a $10/tCO
2
cap guarantee with international permits from other countries who were below their agreed
targets (e.g., Russia). The negative impact was about 3.5% over some 30 years, or ~0.1%/a
lost economic growth. This has an estimated value of the fraction of the GDP, ~0.01x$1T/a
~$10B/a in GDP reduction.
Assuming a needed 200 MtCO
2
reduction to meet the target, this implies an allowed
economic value ~$10B/200Mt = $50/t.
Impacts of GHG Programs and Markets on the Power Industry 581
15.3.2.4 Actual trading value
A value can therefore be assigned from what emitters will actually pay to preserve or obtain
the rights or credit of releasing GHGs. This value can be determined from a defined and
hopefully market-driven “emissions trading” scheme, where the right to emit is established
via some limit placed on the total allowed amount (a so-called cap-and-trade system).
Within the pre-determined GHG emissions amount, which is distributed between emitters
and energy market sectors, credits can be traded and exchanged for a price determined by
credit supply and emissions demand.
Currently, it is estimated [10] that about 100 million tons of carbon credits are transacted in
various markets worldwide. The World Bank report [11] stated: “There are four active markets for
GHG allowances as of May 2005; the EU-ETS, the UK Emissions Trading System, the New South
Wales trading system and the Chicago Climate Exchange”. Volumes exchanged on these allowance
markets have increased dramatically compared with 2005, and is now comparable to the
volumes exchanged through project-based transactions. Cumulative volume exchanged on
these four markets from January 2004 to March 2005 is about 56MtCO
2
e.
Of the four allowance markets, the EU-ETS is the largest, with an estimated 39MtCO
2
e
exchanged since January 2004, the bulk transacted since January 2005.
Unlike project-based assets, allowances are homogeneous assets, and purchase contracts for
allowances are fairly homogenous. As a result, the spread of prices for one tonne of CO
2
of
emissions (an EUA) at any given point in time is small.
The dominant trading is clearly in the EU, where an emissions trading schemed has been
deployed which allowed trading of emissions credits (i.e., emissions rights) on the open market,
within some overall limit or cap on the EU total. Presently, some 25 countries with some 6,000
participating companies constitute a trading volume of 2.1 billion allocated tons CO
2
per year.
In this European Trading Scheme (ETS) predictions have also been made of the effect of
demand on the trading price [12].
The estimates ranged from $20 to $100$/tCO
2
depending on actual US demand, which is
presently zero. A useful conversion factor to bear in mind, since economic studies use different
currencies, is that for 2006 currency conversion rates, $100/tC = 20€/tCO
2
. For 2005-2006 the
ETS trading value range was between 10 and 30€/tCO
2
[13], and fluctuated widely.
This estimate is as close to an actual market value that is available. It is artificial as it refers
solely in the EU, is not a global value, and is dependent on meeting arbitrary EU Kyoto targets.
15.3.2.5 Negative value of negawatts: conservation
and efficiency relative socio-economic values
The conservation cost is obtained by adopting or encouraging restrictions in the energy
demand (so-called demand-side management) and use, plus impact of efficiency and
conservation measures versus adding energy sources.
To set the market value, it is noted that oil and gas already has an assigned market value,
and hence so has the carbon content used for energy production, since 1 bbl oil contains
~115kgC (= 495 kgCO
2
).
To set the order of magnitude, the value to stockholders and owners as profit from
corporate sales is taken. At the 2006 BP Annual General Meeting (www.bp.com), and in the
Financial and Operating Information for 2001-2005, it was reported that $19B was
distributed to investors in 2005-2006 with a replacement cost /bbl in 2005 of ~$48/bbloe.
The profit per $/kgC = 41.8¢/kgC = 418$/tC translates to a present carbon emissions value
to investors of 114 $/tCO
2
, assuming no carbon is sequestered and all is used in combustion,
oxidation and/or transportation.
The future potential or prospective distribution to shareholders is given as ~$65B over the
three years 2006-2008. With a refining margin ~$850/bbl, the 2005 production was
~2.5Mbbl/d at a cost of ~$50/bbl ~$45B/a.
Returning about $65B over 3 years ~$22B/a, so the projected future profit/bbloe
~$22B/0.91Bbbl = $24/bbloe. Hence the investors’ future Carbon value ~$48/tCO
2
.
To attract investment or to be economically competitive without subsidy, any non-carbon
alternate or carbon reduction scheme must have at least this substitute market investment value.
15.3.2.3 Assumed value of the right to emit
In a carbon-constrained system, the right to emit is governed by voluntary and/or regulated
limits on total emissions. Thus emitting carbon can have a price or cost. The Kyoto Treaty
targets are approximately a 5% global percentage reduction from prior years (1990 was
taken as the baseline). To meet or encourage meeting this modest target, some nations
invoked an “emissions trading schemes” either individually or collectively.
Many economic studies have attempted to determine or set limits on the assumed value, and
establish the impact on the national, regional or local economy (e.g., Regional Greenhouse Gas
Initiative (RGGI) report). Funds that are spent on carbon costs that raise energy prices cannot
be spent on consumer goods. If promoting such a scheme a low value is assumed (typically $5-
10/tCO
2
), but the results are clearly sensitive to the assumed cost. In Canada, the impact on
future national “scenarios” were examined under certain key assumptions.
These included the assumptions of a +2%/a base GDP growth, but also assumed a $10/tCO
2
cap guarantee with international permits from other countries who were below their agreed
targets (e.g., Russia). The negative impact was about 3.5% over some 30 years, or ~0.1%/a
lost economic growth. This has an estimated value of the fraction of the GDP, ~0.01x$1T/a
~$10B/a in GDP reduction.
Assuming a needed 200 MtCO
2
reduction to meet the target, this implies an allowed
economic value ~$10B/200Mt = $50/t.
Electricity Infrastructures in the Global Marketplace582
Basically, the needed proven and projected efficiency improvements are more expensive,
and cannot keep pace with increased carbon-based energy demand, so need policy
incentives (tax and cost breaks) to be adopted. Therefore, only by adopting non-carbon
energy sources can the trend of increased CO
2
emissions be changed, and therefore, a mix of
non-carbon sources is needed, including nuclear, as is also assumed by the United Nations
Intergovernmental Panel on Climate Change (IPCC).
In fact globally the situation is perversely made worse: the decreasing demand in one
country attained by precious conservation measures causes some reduction in what would
otherwise have been the cost of global energy production favoring increased demand by
others, as these other economies grow. Thus, the developing economies of, say, India and
China will use all the energy that others make available to the market place by conservation
and efficiency measures. The most that can be claimed in world markets is a decrease in the
rate of carbon energy growth, but not an actual decrease in the amount of carbon energy
used. This is confirmed by the data and all authoritative projections.
15.3.2.6 The alternative or substitution value
This value can be estimated based on alternate energy technology options that reduce
emissions but with added development, deployment and market costs that vary from
technology to technology, and from sector to sector. In principle, it is possible to consider
the value of emissions reduction versus emissions avoidance approaches (e.g., switching to
hydrogen as an energy carrier).
It is not so simple to apply a value which is a composite based on relative health, emissions, land
use, fuel supply, social and political aspects to arrive at relative rankings for differing substitute
energy sources, emissions reduction technologies and GHG sinks in portfolio of options.
Consider the simplest case of power generation. Different sources and means produce
differing amounts of emissions over their full “life cycle”, meaning from mining the raw
materials, the construction and the operation, and finally the disposal and decommissioning.
For any given source of power, there is a GHG emissions amount per kWh.
To evaluate the relative emissions value of any two options, a calculation can be made as follows:
Differential Value of Avoidance, $ = [ΔgCO
2
/kWh] x [ΔkWh] x [Δ$/gCO
2
]
where,
ΔgCO
2
/kWh is the difference between the emissions for any two sources
ΔkWh is the difference in the amount of power generated
Δ$/gCO
2
is the difference in the generating cost for any two sources.
Typical relative values are shown in Figure 15.9 for a variety of modern electric power units
and a variety of studies, to illustrate the order of magnitudes.
For any given carbon value, for any given generation source, it is even more
straightforward. For generation of 5TWh each year (by 600MW.a) avoiding approximately
3Mt/a @20$/t, then the avoided emissions value may be assumed to be roughly $60M/a.
There are more subtle social values also that can be determined from the so-called external
impacts or from reduced use of carbon energy. The most popular are called conservation
and efficiency improvements, and are presumed to value energy-use reduction, and hence
emissions avoidance. Reduced energy usage is good if energy efficiency is also improved
and there is also a net relative benefit. Reductions in energy use have been given the term
“Negawatts” [14] to reflect the reduction attained.
There are two ways to improve economic efficiency: (i) in the production of energy, and (ii)
in its use. By using a standard discounted cash flow model, as used for actual power plants
and systems, the costs of saving electricity to their assumed new power plant generating
costs, using consistent discount rates can be compared.
A test case (scientific data) for the claims of efficiency gains leading to energy and emissions
reduction is taken from actual USA data. After extensive effort, the results of improvements
in energy technology and efficiency are clear. The US Department of Energy (DOE) has had
a large and important program of work on efficiency for many years. This shows the
perverse market effect that as (carbon) energy is made cheaper, more is used, leading to
actual increases in energy use and in emissions.
Consider the actual and projected energy intensities, energy use and emissions in the USA
for 1990-2020. The data and projections are shown in “Energy Outlook 2001” [10].
The numbers and figures clearly show that energy use and emissions rise as energy
technology improves and the price falls (similar trends appear in prior years), both in the
past and into the future.
Improved efficiency (technology) was responsible for about 60% of the observed decline in
energy intensity, is now declining and is more expensive to introduce. As a result of the
continued improvements in the efficiency of end-use and electricity generation technologies,
total energy intensity in the reference case is projected to decline at an average annual rate
of 1.6 percent between 1999 and 2020.
The projected decline in energy intensity (1.6%) is considerably less than that experienced
during the 1970s and early 1980s, when energy intensity declined, on average, by 2.3% per
year. Approximately 40 percent of that decline can be attributed to structural shifts in the
economy—shifts to service industries and other less energy-intensive industries; however,
the rest resulted from the use of more energy-efficient equipment.
Although more advanced technologies may reduce energy consumption, in general they are
more expensive when initially introduced. In order to penetrate into the market, advanced
technologies must be purchased by the consumers; however, many potential purchasers may
not be willing to buy more expensive equipment that has a long period for recovering the
additional cost through energy savings, and many may value other attributes over energy
efficiency. In order to encourage more rapid penetration of advanced technologies, to reduce
energy consumption or carbon dioxide emissions, it is likely that either market policies, such
as higher energy prices, or non-market policies, such as new standards, may be required.
Impacts of GHG Programs and Markets on the Power Industry 583
Basically, the needed proven and projected efficiency improvements are more expensive,
and cannot keep pace with increased carbon-based energy demand, so need policy
incentives (tax and cost breaks) to be adopted. Therefore, only by adopting non-carbon
energy sources can the trend of increased CO
2
emissions be changed, and therefore, a mix of
non-carbon sources is needed, including nuclear, as is also assumed by the United Nations
Intergovernmental Panel on Climate Change (IPCC).
In fact globally the situation is perversely made worse: the decreasing demand in one
country attained by precious conservation measures causes some reduction in what would
otherwise have been the cost of global energy production favoring increased demand by
others, as these other economies grow. Thus, the developing economies of, say, India and
China will use all the energy that others make available to the market place by conservation
and efficiency measures. The most that can be claimed in world markets is a decrease in the
rate of carbon energy growth, but not an actual decrease in the amount of carbon energy
used. This is confirmed by the data and all authoritative projections.
15.3.2.6 The alternative or substitution value
This value can be estimated based on alternate energy technology options that reduce
emissions but with added development, deployment and market costs that vary from
technology to technology, and from sector to sector. In principle, it is possible to consider
the value of emissions reduction versus emissions avoidance approaches (e.g., switching to
hydrogen as an energy carrier).
It is not so simple to apply a value which is a composite based on relative health, emissions, land
use, fuel supply, social and political aspects to arrive at relative rankings for differing substitute
energy sources, emissions reduction technologies and GHG sinks in portfolio of options.
Consider the simplest case of power generation. Different sources and means produce
differing amounts of emissions over their full “life cycle”, meaning from mining the raw
materials, the construction and the operation, and finally the disposal and decommissioning.
For any given source of power, there is a GHG emissions amount per kWh.
To evaluate the relative emissions value of any two options, a calculation can be made as follows:
Differential Value of Avoidance, $ = [ΔgCO
2
/kWh] x [ΔkWh] x [Δ$/gCO
2
]
where,
ΔgCO
2
/kWh is the difference between the emissions for any two sources
ΔkWh is the difference in the amount of power generated
Δ$/gCO
2
is the difference in the generating cost for any two sources.
Typical relative values are shown in Figure 15.9 for a variety of modern electric power units
and a variety of studies, to illustrate the order of magnitudes.
For any given carbon value, for any given generation source, it is even more
straightforward. For generation of 5TWh each year (by 600MW.a) avoiding approximately
3Mt/a @20$/t, then the avoided emissions value may be assumed to be roughly $60M/a.
There are more subtle social values also that can be determined from the so-called external
impacts or from reduced use of carbon energy. The most popular are called conservation
and efficiency improvements, and are presumed to value energy-use reduction, and hence
emissions avoidance. Reduced energy usage is good if energy efficiency is also improved
and there is also a net relative benefit. Reductions in energy use have been given the term
“Negawatts” [14] to reflect the reduction attained.
There are two ways to improve economic efficiency: (i) in the production of energy, and (ii)
in its use. By using a standard discounted cash flow model, as used for actual power plants
and systems, the costs of saving electricity to their assumed new power plant generating
costs, using consistent discount rates can be compared.
A test case (scientific data) for the claims of efficiency gains leading to energy and emissions
reduction is taken from actual USA data. After extensive effort, the results of improvements
in energy technology and efficiency are clear. The US Department of Energy (DOE) has had
a large and important program of work on efficiency for many years. This shows the
perverse market effect that as (carbon) energy is made cheaper, more is used, leading to
actual increases in energy use and in emissions.
Consider the actual and projected energy intensities, energy use and emissions in the USA
for 1990-2020. The data and projections are shown in “Energy Outlook 2001” [10].
The numbers and figures clearly show that energy use and emissions rise as energy
technology improves and the price falls (similar trends appear in prior years), both in the
past and into the future.
Improved efficiency (technology) was responsible for about 60% of the observed decline in
energy intensity, is now declining and is more expensive to introduce. As a result of the
continued improvements in the efficiency of end-use and electricity generation technologies,
total energy intensity in the reference case is projected to decline at an average annual rate
of 1.6 percent between 1999 and 2020.
The projected decline in energy intensity (1.6%) is considerably less than that experienced
during the 1970s and early 1980s, when energy intensity declined, on average, by 2.3% per
year. Approximately 40 percent of that decline can be attributed to structural shifts in the
economy—shifts to service industries and other less energy-intensive industries; however,
the rest resulted from the use of more energy-efficient equipment.
Although more advanced technologies may reduce energy consumption, in general they are
more expensive when initially introduced. In order to penetrate into the market, advanced
technologies must be purchased by the consumers; however, many potential purchasers may
not be willing to buy more expensive equipment that has a long period for recovering the
additional cost through energy savings, and many may value other attributes over energy
efficiency. In order to encourage more rapid penetration of advanced technologies, to reduce
energy consumption or carbon dioxide emissions, it is likely that either market policies, such
as higher energy prices, or non-market policies, such as new standards, may be required.
Electricity Infrastructures in the Global Marketplace584
This range does perhaps underestimate the real cost since the figures do not usually include
collateral CO
2
emission associated with the CCS operation. The use of combined EOR, CCS
and gas recovery is presently being examined at full scale, combined with hydrogen
production and power generation (see www.bp.com).
15.3.2.8 Value of alternate technologies
With continually rising emissions, there is a so-called “technology gap” to the desired goal
of some reduced level. It would be of value if alternate technologies were some “magic
bullet” that removed emissions, but a diversified portfolio of options is often recommended
[17]. The costs to develop and deploy can be subsidized in the short term. But in a
competitive marketplace, like the energy sector, the chance of success or market share for a
new technology or product is heavily dependent on relative or comparative cost.
Projected cost of GHG reductions in the USA and the EU
Cost ($/tCO2 )= 39 e
0.0015Mt
R
2
= 0.6974
0
200
400
600
800
1000
1200
1400
1600
0 500 1000 1500 2000 2500
Cumulative Reduction (MtCO2)
Price (per MtCO2)
Figure 15.11. The Value of Technology
Recently, analyses of the emissions reduction potential of alternate technology pathways and
scenarios have been published by the OECD’s International Energy Agency at the specific
request of the G8 countries [18]. This was to address the socio-political issues of environment,
energy security, air pollution and poverty to determine a “clean, clever and competitive
energy future”. The study concluded that deployment of technologies that have an additional
cost of less than a cost of $25/t CO
2
could halve oil and electricity demand and stabilize
emissions by 2050. Unfortunately sensitivity to the value was not studied, but it is clear that
this value would exclude many of the technology options in Figure 15.11 and will not really
impact transport emissions as it represents only some 1-2% of current fuelling costs.
15.3.2.9 Policy value: energy insecurity and carbon taxes
Government and national policy makers like to retain control over their own destiny and
country. Since many of the major sources of carbon energy are focused in regions of relative
geo-political instability, there is a value to be placed on having energy security and diversity
of supply. The use of “policy measures” (a euphemism for taxes) is usual for governments, to
raise revenue and/or provide fiscal incentives.
Thus, the recent Province of Quebec’s “Plan d’Action” [19] is based on monetary incentives
for GHG emissions avoidance.
These emissions differences may be translated into generating costs impacts, that is the price
actually paid by a consumer (cf. gasoline). Avoiding 5Mt/yCO
2
@$30/t = 150M$/y. With a
1000MW(e) plant, approximately 7.8TWh/y will be generated, so the added cost of
emissions, or conversely the benefit of avoidance is 1.9c/kWh, which is about a 30% increase
in generating cost.
15.3.2.7 Avoidance, capture and sequestration value
The alternative is to eliminate, avoid or capture the emissions. Recently focus has been on
establishing so-called Carbon Capture and Storage (CCS) as a viable option, which is
essentially the immobilization of CO
2
in either: (a) a gas in natural or man-made geologic
structures such as existing mines, deep saline aquifers, oil and gas wells, and salt domes; or
(b) other stable chemical or physical forms. Also, pressurized re-injection into oil wells to
recover additional oil (called Enhanced Oil Recovery (EOR)) is feasible at such sites, and
CO
2
can also be collected elsewhere and piped to the injection location.
16 – 23154
Hydro
3636
Wind
701811778855
Oil
0213 – 1516
Nuclear
97114 - 189
Solar Panels
9789741071
Coal
500696605
Natural Gas
France (production only)
Gouvernement de France,
2000
IAEA
Spadero et al. 2000
www.iaea.org
Canada
Andseta & Gagnon HQ,
2000
Switzerland
PSI GaBe 2000
www.psi.ch
Electric Energy
Technology
Figure 15.9. The relative life cycle emissions from differing sources.
Figure 15.10. The comparative value of CCS. (Source: DTI, 2003.)
Since the amounts (volume and mass) of carbon are potentially very large, it is preferable to
site CCS facilities near larger sources. The recent UK report [16] has costed many concepts,
and derives a CCS cost range of some 10-30$/tCO
2
. Perhaps unsurprisingly, this cost range
is consistent with the trading value, implying that these are perhaps the two main
competing options (i.e., CCS or buy emissions credits). The comparative value of CCS taken
from the Department of Trade and Industry (DTI) report is indicated in Figure 15.10.
Impacts of GHG Programs and Markets on the Power Industry 585
This range does perhaps underestimate the real cost since the figures do not usually include
collateral CO
2
emission associated with the CCS operation. The use of combined EOR, CCS
and gas recovery is presently being examined at full scale, combined with hydrogen
production and power generation (see www.bp.com
).
15.3.2.8 Value of alternate technologies
With continually rising emissions, there is a so-called “technology gap” to the desired goal
of some reduced level. It would be of value if alternate technologies were some “magic
bullet” that removed emissions, but a diversified portfolio of options is often recommended
[17]. The costs to develop and deploy can be subsidized in the short term. But in a
competitive marketplace, like the energy sector, the chance of success or market share for a
new technology or product is heavily dependent on relative or comparative cost.
Projected cost of GHG reductions in the USA and the EU
Cost ($/tCO2 )= 39 e
0.0015Mt
R
2
= 0.6974
0
200
400
600
800
1000
1200
1400
1600
0 500 1000 1500 2000 2500
Cumulative Reduction (MtCO2)
Price (per MtCO2)
Figure 15.11. The Value of Technology
Recently, analyses of the emissions reduction potential of alternate technology pathways and
scenarios have been published by the OECD’s International Energy Agency at the specific
request of the G8 countries [18]. This was to address the socio-political issues of environment,
energy security, air pollution and poverty to determine a “clean, clever and competitive
energy future”. The study concluded that deployment of technologies that have an additional
cost of less than a cost of $25/t CO
2
could halve oil and electricity demand and stabilize
emissions by 2050. Unfortunately sensitivity to the value was not studied, but it is clear that
this value would exclude many of the technology options in Figure 15.11 and will not really
impact transport emissions as it represents only some 1-2% of current fuelling costs.
15.3.2.9 Policy value: energy insecurity and carbon taxes
Government and national policy makers like to retain control over their own destiny and
country. Since many of the major sources of carbon energy are focused in regions of relative
geo-political instability, there is a value to be placed on having energy security and diversity
of supply. The use of “policy measures” (a euphemism for taxes) is usual for governments, to
raise revenue and/or provide fiscal incentives.
Thus, the recent Province of Quebec’s “Plan d’Action” [19] is based on monetary incentives
for GHG emissions avoidance.
These emissions differences may be translated into generating costs impacts, that is the price
actually paid by a consumer (cf. gasoline). Avoiding 5Mt/yCO
2
@$30/t = 150M$/y. With a
1000MW(e) plant, approximately 7.8TWh/y will be generated, so the added cost of
emissions, or conversely the benefit of avoidance is 1.9c/kWh, which is about a 30% increase
in generating cost.
15.3.2.7 Avoidance, capture and sequestration value
The alternative is to eliminate, avoid or capture the emissions. Recently focus has been on
establishing so-called Carbon Capture and Storage (CCS) as a viable option, which is
essentially the immobilization of CO
2
in either: (a) a gas in natural or man-made geologic
structures such as existing mines, deep saline aquifers, oil and gas wells, and salt domes; or
(b) other stable chemical or physical forms. Also, pressurized re-injection into oil wells to
recover additional oil (called Enhanced Oil Recovery (EOR)) is feasible at such sites, and
CO
2
can also be collected elsewhere and piped to the injection location.
16 – 23154
Hydro
3636
Wind
701811778855
Oil
0213 – 1516
Nuclear
97114 - 189
Solar Panels
9789741071
Coal
500696605
Natural Gas
France (production only)
Gouvernement de France,
2000
IAEA
Spadero et al. 2000
www.iaea.org
Canada
Andseta & Gagnon HQ,
2000
Switzerland
PSI GaBe 2000
www.psi.ch
Electric Energy
Technology
16 – 23154
Hydro
3636
Wind
701811778855
Oil
0213 – 1516
Nuclear
97114 - 189
Solar Panels
9789741071
Coal
500696605
Natural Gas
France (production only)
Gouvernement de France,
2000
IAEA
Spadero et al. 2000
www.iaea.org
Canada
Andseta & Gagnon HQ,
2000
Switzerland
PSI GaBe 2000
www.psi.ch
Electric Energy
Technology
Figure 15.9. The relative life cycle emissions from differing sources.
Figure 15.10. The comparative value of CCS. (Source: DTI, 2003.)
Since the amounts (volume and mass) of carbon are potentially very large, it is preferable to
site CCS facilities near larger sources. The recent UK report [16] has costed many concepts,
and derives a CCS cost range of some 10-30$/tCO
2
. Perhaps unsurprisingly, this cost range
is consistent with the trading value, implying that these are perhaps the two main
competing options (i.e., CCS or buy emissions credits). The comparative value of CCS taken
from the Department of Trade and Industry (DTI) report is indicated in Figure 15.10.
Electricity Infrastructures in the Global Marketplace586
15.4 Impact of Regional Greenhouse Gas Initiative and Renewable
Portfolio Standards on Power System Planning
Two developments in the Northeastern United States are having an impact on power system
planning in that region. One is a cap on CO
2
emissions recently adopted by seven states.
This is the result of a voluntary Regional Greenhouse Gas Initiative (RGGI) developed by
nine states over the last two years. The second development is Renewable Portfolio
Standards (RPS) that have been implemented in most states in the Northeastern US.
15.4.1 RGGI
The initial RGGI agreement
#
involved seven states (Maine, New Hampshire, Vermont,
Connecticut, New York, New Jersey and Delaware) that signed a Memorandum of
Understanding (MOU) in December 2005 to implement a cap and trading program for CO
2
emissions from power plants greater than 25 MW in those states. Massachusetts and Rhode
Island joined in February 2007 and Maryland joined in April 2007. Pennsylvania, the Eastern
Canadian Provinces, and New Brunswick are observers in the process. While participation
in RGGI was voluntary, the MOU makes the cap mandatory.
The MOU establishes a CO
2
cap of 126.1 million tons for the initial seven states that would
be implemented starting in 2009 and remaining at this level until 2014. In 2015, a gradual
reduction in the cap would start and reach a 10% lower level by 2019. The cap would be
implemented with a Model Rule as a framework for states to implement state regulations
governing the details of the state cap and trading rules, compliance etc. The overall
program would be administered through a Regional Organization, but would not have
regulatory authority.
The CO
2
cap would be apportioned among the seven states and the states would apportion
their caps to the individual generators in their state granting one CO
2
allowance for each ton
of emissions. The trading of CO
2
allowances would be allowed across the seven states. To
provide consumer benefits from this program the states would withhold 25% of the
allowances from the generators. These could be sold and the funds used to support energy
efficiency, renewable resources, carbon capture, or customer rebates.
A compliance flexibility feature of the RGGI program will be the ability of an affected
generator to use offsets for up to 3.3% of its compliance obligation. Offsets are reductions in
CO
2
or other greenhouse
gases made outside of the electric sector that have been approved
and certified by a regulatory process as to their legitimacy. These offsets can be created from
a number of possible designated greenhouse gas reductions in the RGGI states on a one for
one basis, or created in the U.S. outside of RGGI on a two for one basis. An additional
flexibility aspect of the RGGI program is that it has two price triggers when CO
2
allowances
reach price thresholds of $7/ton and $10/ton. With allowances at these price levels, more
compliance flexibility is allowed in the use of offsets with an increase in the percentage use
for compliance and a broader geographical area from which the offsets can be created and
bought.
#
www.rggi.org/agreement.htm
For a cost of some $200M in taxes plus $328M in other measures, with a program total $1.2b,
the goal of the Plan is to avoid ~10Mt/aCO
2
in six years. The specific value assigned to
carbon emissions avoidance is not stated, but can be estimated from the proposed program
costs given above as within a range:
High ~$1.2B/(10Mt/a x 6) = $20/tCO
2
Low ~$200M/(4.8Mt/a x 6) = $7/tCO
2
If the cost or value is too high, the democratic election process usually solves this issue.
15.3.2.10 Global value of sustainable avoidance
As a final estimate of the value of emissions avoidance, some global limit or “target’ for
allowable emissions should be assumed. This is taken as a doubling of pre-industrial CO
2
concentrations to about 550 ppm in the atmosphere. The reduction achieved by any
avoidance or technology means can be translated into an atmospheric concentration
reduction. As a working example, the impact for a range of emissions reduction
assumptions based on the UN’s IPCC scenarios [20] for future energy use [21] has been
evaluated, This was done using the MAGICC/SCENGEN [22] global model as an emissions
scenario sensitivity tool. Any emissions avoidance could be assumed, but specifically we
adopted the range covering high- and low-energy use by (the IPCC, the A1F1 and B2 base
scenarios) [21]. These scenarios were modified by inclusion of significant added penetration
of sources with low carbon dioxide emissions (including nuclear energy) for new power
generation by 2030; and the adoption of a significant fraction of hydrogen in global
transportation by 2040.
The results [21] show an emissions avoidance/reduction potential of 200 to 300 ppm CO
2
by
2100, using such a penetration of non-carbon power. This scale of emissions avoidance
essentially allows for unconstrained economic growth, which is good for the developing
nations pursuing this course course of action.
15.3.3 Results
Using existing data, estimates for the range of values to be ascribed to carbon emissions
were evaluated and provided. This analysis utilizes published data to establish the values of
the business return, emissions avoidance, energy reduction, efficiency improvement,
conservation and alternate technology deployment. As a result, it is shown that there is no
one unique, globally traded and valid value. The value ascribed to avoidance is coupled to
the economic value of energy use; and hence the range of costs of emissions reduction is
highly dependent on socio-politico-economic assumptions.
The use of alternate non-carbon energy is relatively of high value in typical schemes,
including impact of conservation and efficiency measures. The results show a definite trend
that confirms the considerable advantage of adding new-build advanced nuclear energy
plants as potentially the lowest cost emissions reduction option with the highest value.
Impacts of GHG Programs and Markets on the Power Industry 587
15.4 Impact of Regional Greenhouse Gas Initiative and Renewable
Portfolio Standards on Power System Planning
Two developments in the Northeastern United States are having an impact on power system
planning in that region. One is a cap on CO
2
emissions recently adopted by seven states.
This is the result of a voluntary Regional Greenhouse Gas Initiative (RGGI) developed by
nine states over the last two years. The second development is Renewable Portfolio
Standards (RPS) that have been implemented in most states in the Northeastern US.
15.4.1 RGGI
The initial RGGI agreement
#
involved seven states (Maine, New Hampshire, Vermont,
Connecticut, New York, New Jersey and Delaware) that signed a Memorandum of
Understanding (MOU) in December 2005 to implement a cap and trading program for CO
2
emissions from power plants greater than 25 MW in those states. Massachusetts and Rhode
Island joined in February 2007 and Maryland joined in April 2007. Pennsylvania, the Eastern
Canadian Provinces, and New Brunswick are observers in the process. While participation
in RGGI was voluntary, the MOU makes the cap mandatory.
The MOU establishes a CO
2
cap of 126.1 million tons for the initial seven states that would
be implemented starting in 2009 and remaining at this level until 2014. In 2015, a gradual
reduction in the cap would start and reach a 10% lower level by 2019. The cap would be
implemented with a Model Rule as a framework for states to implement state regulations
governing the details of the state cap and trading rules, compliance etc. The overall
program would be administered through a Regional Organization, but would not have
regulatory authority.
The CO
2
cap would be apportioned among the seven states and the states would apportion
their caps to the individual generators in their state granting one CO
2
allowance for each ton
of emissions. The trading of CO
2
allowances would be allowed across the seven states. To
provide consumer benefits from this program the states would withhold 25% of the
allowances from the generators. These could be sold and the funds used to support energy
efficiency, renewable resources, carbon capture, or customer rebates.
A compliance flexibility feature of the RGGI program will be the ability of an affected
generator to use offsets for up to 3.3% of its compliance obligation. Offsets are reductions in
CO
2
or other greenhouse
gases made outside of the electric sector that have been approved
and certified by a regulatory process as to their legitimacy. These offsets can be created from
a number of possible designated greenhouse gas reductions in the RGGI states on a one for
one basis, or created in the U.S. outside of RGGI on a two for one basis. An additional
flexibility aspect of the RGGI program is that it has two price triggers when CO
2
allowances
reach price thresholds of $7/ton and $10/ton. With allowances at these price levels, more
compliance flexibility is allowed in the use of offsets with an increase in the percentage use
for compliance and a broader geographical area from which the offsets can be created and
bought.
#
www.rggi.org/agreement.htm
For a cost of some $200M in taxes plus $328M in other measures, with a program total $1.2b,
the goal of the Plan is to avoid ~10Mt/aCO
2
in six years. The specific value assigned to
carbon emissions avoidance is not stated, but can be estimated from the proposed program
costs given above as within a range:
High ~$1.2B/(10Mt/a x 6) = $20/tCO
2
Low ~$200M/(4.8Mt/a x 6) = $7/tCO
2
If the cost or value is too high, the democratic election process usually solves this issue.
15.3.2.10 Global value of sustainable avoidance
As a final estimate of the value of emissions avoidance, some global limit or “target’ for
allowable emissions should be assumed. This is taken as a doubling of pre-industrial CO
2
concentrations to about 550 ppm in the atmosphere. The reduction achieved by any
avoidance or technology means can be translated into an atmospheric concentration
reduction. As a working example, the impact for a range of emissions reduction
assumptions based on the UN’s IPCC scenarios [20] for future energy use [21] has been
evaluated, This was done using the MAGICC/SCENGEN [22] global model as an emissions
scenario sensitivity tool. Any emissions avoidance could be assumed, but specifically we
adopted the range covering high- and low-energy use by (the IPCC, the A1F1 and B2 base
scenarios) [21]. These scenarios were modified by inclusion of significant added penetration
of sources with low carbon dioxide emissions (including nuclear energy) for new power
generation by 2030; and the adoption of a significant fraction of hydrogen in global
transportation by 2040.
The results [21] show an emissions avoidance/reduction potential of 200 to 300 ppm CO
2
by
2100, using such a penetration of non-carbon power. This scale of emissions avoidance
essentially allows for unconstrained economic growth, which is good for the developing
nations pursuing this course course of action.
15.3.3 Results
Using existing data, estimates for the range of values to be ascribed to carbon emissions
were evaluated and provided. This analysis utilizes published data to establish the values of
the business return, emissions avoidance, energy reduction, efficiency improvement,
conservation and alternate technology deployment. As a result, it is shown that there is no
one unique, globally traded and valid value. The value ascribed to avoidance is coupled to
the economic value of energy use; and hence the range of costs of emissions reduction is
highly dependent on socio-politico-economic assumptions.
The use of alternate non-carbon energy is relatively of high value in typical schemes,
including impact of conservation and efficiency measures. The results show a definite trend
that confirms the considerable advantage of adding new-build advanced nuclear energy
plants as potentially the lowest cost emissions reduction option with the highest value.
Electricity Infrastructures in the Global Marketplace588
also assumed that the natural gas infrastructure would be expanded as needed. In the
ISO/RTOs’ regional planning processes, generation expansion scenarios will need to be
examined with more detailed modeling to confirm that system reliability can be maintained
and to determine the magnitude of the market costs of implementing the RGGI CO
2
cap.
RPS is providing some incentives for new renewable projects, especially wind and biomass.
Based on the ISO/RTO system interconnection queues, wind and biomass appear to be the
more attractive renewable projects being built. These renewable projects have to be sited
where the energy source is located, which is usually not close to a major load centers, i.e. on
remote ridgelines for onshore wind or where there are forested areas to provide wood
harvesting with minimum transportation costs.
15.5 Conclusions
There is growing evidence of impacts of CC due to GHGs. Action is needed to reduce GHG
emissions to mitigate risks of CC and to increase global capability to adapt. The power
industry is a major part of the problem and must be part of the solution and show
leadership. Much has been done through global and other programs, but there is urgency to
do much more to reduce risks.
It is prudent to adopt a "no regrets" strategy at this time that makes good sense and
minimizes costs and risks whatever the outcome on actual global climate change. The
preferred risk management approach must balance the costs and economic risks of overly
severe CO
2
emission reduction targets against the costs and benefits of increasing our
adaptive capability to cope with climate change This is particularly so in the developing
countries which would be hardest hit by overly restrictive targets affecting their economic
development and currently have the least adaptive capability.
Major thrusts must be on clean, hi-efficiency technology for mitigation of emissions, and
increasing adaptive capability, particularly of poorer developing countries. There are many
opportunities for the power industry to show leadership in technology, processes and
markets. There will be funding and skilled resources challenges, but there are many good
investment opportunities.
Business and governments must work together on climate change mitigation and
adaptation. GHG reductions can be realized through use of (i) market-based programs in
which customers or manufacturers are provided technical support and/or incentives; (ii)
mandatory energy-efficiency standards, applied at the point of manufacture or at the time of
construction; (iii) voluntary energy-efficiency standards; and (iv) increased emphasis of
private or public R&D programs to develop low emission energy technologies and more
efficient products.
There is no one unique, globally traded and valid value for carbon. The value ascribed to
avoidance is coupled to the economic value of energy use; and hence the range of costs of
emissions reduction is highly dependent on socio-politico-economic assumptions. The use
of alternate non-carbon energy is of relatively high value in typical schemes, including
impact of conservation and efficiency measures. The results show a definite trend that
Massachusetts (MA) and Rhode Island (RI) also participated in the development of the
RGGI program but did not sign the initial MOU. MA implemented its own CO
2
cap in 2006
affecting six fossil generating plants in that state. The MA cap is based on historical
emissions (tons), and on a maximum emissions rate of 1800lb/MWH. It also established
price caps so it has similarities to the RGGI program.
15.4.2 Renewable Portfolio Standards
RPS have been implemented by state legislation and regulation to encourage development
of renewable resources. The RPS are percentage targets of the energy supplied that the load
serving companies are required to meet on an annual basis. The percentage target generally
increases each year and can be met with a range of renewable technologies. These typically
include solar photovoltaic, wind, biomass, energy from wastes, and in some states fuel cells.
The Northeast states with RPS include Maine, Vermont, Massachusetts, Rhode Island,
Connecticut, New York, New Jersey, Pennsylvania and Maryland.
Compliance by the load serving entities generally is made from the energy from renewable
projects across the region and is accomplished with the purchase of Renewable Energy
Certificates (RECs
1
) associated with these projects. The value of a REC adds to the worth of
the energy from a project, and provides greater incentives for investing in the development
of renewable resources
15.4.3 Impacts on Power System Planning
Both RGGI and RPS have impacts on electric system planning in the region. The RGGI
program would function similar to the SO
2
and NO
x
cap and trade systems that have been
functioning in the US and Canada. These systems provide regulatory certainty as to
emission requirements for the generating plants affected. RGGI would be adding a third
mandatory emissions cap for power plants in the seven participating states.
The RGGI Cap would function in the same manner like the SO
2
and NO
x
caps, and cause
dispatch or bidding adders that would increase the operating cost of fossil plants, especially
coal and oil since these fuels have the highest CO
2
emission rates. These costs could change
relative dispatch of the units and hence the system transmission flows.
In the modeling conducted during the development of the RGGI program, a wide range of
natural gas price assumptions was examined for the electric system expansion to show
feasibility of the cap. The results showed a very diverse set of generation additions to serve
the energy and peak load growth out through 2024. For assumptions of more historical
levels of natural gas prices the additions included a large amount of natural gas fueled
combined cycle (NGCC) and onshore wind generation. For assumptions of higher natural
gas prices, such as were experienced in 2005, clean coal plants were the major capacity
addition with a lesser amount of NGCC and a similar amount of wind was selected in the
model (to meet RPS) as with lower natural gas prices. The large amount of wind may not be
feasible if the siting difficulties of current wind projects continue. These RGGI scenarios
1
A REC equals one MWH of renewable energy.
Impacts of GHG Programs and Markets on the Power Industry 589
also assumed that the natural gas infrastructure would be expanded as needed. In the
ISO/RTOs’ regional planning processes, generation expansion scenarios will need to be
examined with more detailed modeling to confirm that system reliability can be maintained
and to determine the magnitude of the market costs of implementing the RGGI CO
2
cap.
RPS is providing some incentives for new renewable projects, especially wind and biomass.
Based on the ISO/RTO system interconnection queues, wind and biomass appear to be the
more attractive renewable projects being built. These renewable projects have to be sited
where the energy source is located, which is usually not close to a major load centers, i.e. on
remote ridgelines for onshore wind or where there are forested areas to provide wood
harvesting with minimum transportation costs.
15.5 Conclusions
There is growing evidence of impacts of CC due to GHGs. Action is needed to reduce GHG
emissions to mitigate risks of CC and
to increase global capability to adapt. The power
industry is a major part of the problem and must be part of the solution and show
leadership. Much has been done through global and other programs, but there is urgency to
do much more to reduce risks.
It is prudent to adopt a "no regrets" strategy at this time that makes good sense and
minimizes costs and risks whatever the outcome on actual global climate change. The
preferred risk management approach must balance the costs and economic risks of overly
severe CO
2
emission reduction targets against the costs and benefits of increasing our
adaptive capability to cope with climate change This is particularly so in the developing
countries which would be hardest hit by overly restrictive targets affecting their economic
development and currently have the least adaptive capability.
Major thrusts must be on clean, hi-efficiency technology for mitigation of emissions, and
increasing adaptive capability, particularly of poorer developing countries. There are many
opportunities for the power industry to show leadership in technology, processes and
markets. There will be funding and skilled resources challenges, but there are many good
investment opportunities.
Business and governments must work together on climate change mitigation and
adaptation. GHG reductions can be realized through use of (i) market-based programs in
which customers or manufacturers are provided technical support and/or incentives; (ii)
mandatory energy-efficiency standards, applied at the point of manufacture or at the time of
construction; (iii) voluntary energy-efficiency standards; and (iv) increased emphasis of
private or public R&D programs to develop low emission energy technologies and more
efficient products.
There is no one unique, globally traded and valid value for carbon. The value ascribed to
avoidance is coupled to the economic value of energy use; and hence the range of costs of
emissions reduction is highly dependent on socio-politico-economic assumptions. The use
of alternate non-carbon energy is of relatively high value in typical schemes, including
impact of conservation and efficiency measures. The results show a definite trend that
Massachusetts (MA) and Rhode Island (RI) also participated in the development of the
RGGI program but did not sign the initial MOU. MA implemented its own CO
2
cap in 2006
affecting six fossil generating plants in that state. The MA cap is based on historical
emissions (tons), and on a maximum emissions rate of 1800lb/MWH. It also established
price caps so it has similarities to the RGGI program.
15.4.2 Renewable Portfolio Standards
RPS have been implemented by state legislation and regulation to encourage development
of renewable resources. The RPS are percentage targets of the energy supplied that the load
serving companies are required to meet on an annual basis. The percentage target generally
increases each year and can be met with a range of renewable technologies. These typically
include solar photovoltaic, wind, biomass, energy from wastes, and in some states fuel cells.
The Northeast states with RPS include Maine, Vermont, Massachusetts, Rhode Island,
Connecticut, New York, New Jersey, Pennsylvania and Maryland.
Compliance by the load serving entities generally is made from the energy from renewable
projects across the region and is accomplished with the purchase of Renewable Energy
Certificates (RECs
1
) associated with these projects. The value of a REC adds to the worth of
the energy from a project, and provides greater incentives for investing in the development
of renewable resources
15.4.3 Impacts on Power System Planning
Both RGGI and RPS have impacts on electric system planning in the region. The RGGI
program would function similar to the SO
2
and NO
x
cap and trade systems that have been
functioning in the US and Canada. These systems provide regulatory certainty as to
emission requirements for the generating plants affected. RGGI would be adding a third
mandatory emissions cap for power plants in the seven participating states.
The RGGI Cap would function in the same manner like the SO
2
and NO
x
caps, and cause
dispatch or bidding adders that would increase the operating cost of fossil plants, especially
coal and oil since these fuels have the highest CO
2
emission rates. These costs could change
relative dispatch of the units and hence the system transmission flows.
In the modeling conducted during the development of the RGGI program, a wide range of
natural gas price assumptions was examined for the electric system expansion to show
feasibility of the cap. The results showed a very diverse set of generation additions to serve
the energy and peak load growth out through 2024. For assumptions of more historical
levels of natural gas prices the additions included a large amount of natural gas fueled
combined cycle (NGCC) and onshore wind generation. For assumptions of higher natural
gas prices, such as were experienced in 2005, clean coal plants were the major capacity
addition with a lesser amount of NGCC and a similar amount of wind was selected in the
model (to meet RPS) as with lower natural gas prices. The large amount of wind may not be
feasible if the siting difficulties of current wind projects continue. These RGGI scenarios
1
A REC equals one MWH of renewable energy.
Electricity Infrastructures in the Global Marketplace590
[7] Peter Hoeppe and Gerhard Berz, “Risks of Climate Change – Perspective of the Re-
Insurance Industry, IEEE-PES General Meeting, San Francisco, June 2005, Paper
05GM0523.
[8] Lord Browne, BP Group Chief Executive, Speech to the World Petroleum Congress,
Johannesburg, 29 September 2005. Available:
[9] Stern Review of the Economics of Climate Change, Discussion Paper 31, January 2006, p3.
www.hm-treasury.gov.uk/Independent_Reviews/
stern_review_economics_climate_change/sternreview
[10] H. Hasselknippe, “Climate Change & Business”, Auckland, PointCarbon, November
2004.
[11] International Emissions Trading Association (IETA), World Bank, “State and Trends of
the Carbon Market”, Washington, DC, May 2005.
[12] W.D. Nordhaus, “Life After Kyoto: Alternative Approaches to Global Warming
Policies”, Yale University, December 9, 2005.
[13] PointCarbon. Available: .
[14] A.B. Lovins, “Climate Change and Energy”, presented at The Inaugural Lorne Trottier
Public Science Symposium, McGill University, November 24, 2005. Available:
[15] US DOE, “Energy Outlook 2001”, Energy Information Agency, Washington, 2001.
[16] DTI, “Review of the Feasibility of Carbon Dioxide Capture and Storage in the UK”, UK
Report, 2003.
[17] Battelle, “Global Energy Technology Strategy: Addressing Climate Change”, 2004.
Available: .
[18] IEA, “Energy Technology Perspectives: Scenarios and Strategies to 2050”, International
Energy Agency, OECD, Paris, 2006.
[19] Gouvernement de Québec, Plan d’Action 2006-2012, “Le Québec et les Changements
Climatiques: Un Défi pour l’Avenir”.
[20] IPCC, “Climate Change 2001: The Scientific Basis”, Third Assessment Report, UN
International Panel on Climate Change. Available:
[21] A.M. Miller, S. Suppiah, and R.B. Duffey, “Climate Change Gains More from Nuclear
Substitution that from Conservation”, Nuclear Engineering and Design, 236, pp.
1657-1667, 2006.
[22] T.M. Wigley, S.C.B. Raper, M. Hulme and S. Smith, 2004 “The MAGICC/SCENGEN
Climate Scenario Generator, Version 4.1”, Climate Research Unit. Available:
[23] Dr. Ahmed Zobaa , Cairo University, Egypt and James McConnach, Ontario, Canada
“International Response to Climate Change: An Overview” IEEE-PES GM2006,
Montreal (Paper ID 06GM0027)
[24] Gilles Potvin, Senior Program Officer, CDM & JI Office, Ontario Canada “Canada’s
CDM and JI Office” IEEE-PES GM2006, Montreal (Paper ID 06GM0660)
[25] Dr. Romney Duffey, Principal Scientist, Atomic Energy of Canada Ltd. Ontario,
Canada, “The Value of Non-Carbon Power and Emissions Avoidance”IEEE-PES
GM2006, Montreal (PaperID 06GM0914)
confirms the considerable advantage of adding new-build advanced nuclear plants as
potentially the lowest cost emissions reduction option with the highest value.
Adapting to climate changes will present challenges for all involved in infrastructure design
and construction, health and medicine, water resources management, coastal zone
management, agriculture, land use and forestry, and other areas. Increasing adaptive
capability is a priority for the short term, particularly for the poorest developing countries
which will be hit earliest and hardest by climate change and are least able to cope.
The RGGI CO
2
cap and the RPS requirements in Northeastern USA are adding new impacts
and considerations for power system planning in that region. RGGI will most likely
increase energy costs from fossil generators in the states where it will apply and possibly
affect reliability. RPS will encourage smaller renewable resource projects, mostly onshore
wind and biomass fuels that will interconnect at lower transmission or distribution voltage
levels, and will not likely help serve large load centers. As larger amounts of wind projects
are added, they could affect the need for increased operating reserve.
15.6 Acknowledgements
This Chapter has been compiled by James McConnach, Castle Hill Engineering Services,
Bracebridge, Ontario, Canada; Chair of the IEEE PES W.G. on Climate Change. Contributing
authors include; Romney B. Duffey (Principal Scientist with AECL, Pembroke, Ontario,
Canada); Gilles Potvin (CDM & JI Office, Foreign Affairs Canada, Ottawa, ON, Canada);
Alistair I. Miller (Researcher Emeritus, AECL, Pembroke, Ontario, Canada), and James E.
Platts (ISO New Zealand, Inc., Holyoke, MA, USA). The Chapter is primarily based on an
up-date of the papers presented at the Panel Session on “The Impacts of GHG Programs and
Markets on the Power Industry” at the IEEE-PES 2006 General Meeting (GM2006) in
Montreal ([23-26]).
15.7 References
[1] T J Hammons and J S McConnach. Proposed Standard for the Quantification of CO2
Emission Credits, Electric Power Components and Systems, Taylor & Francis, Vol.
33, (1), pp. 39-58, 2005.
[2] M. Jaccard, and W. D. Montgomery. 1996, “Costs of reducing greenhouse gas emissions
in the USA and Canada,” Energy Policy, vol.24, 10/11, 1996, pp.889-898.
[3] States’ Guidance Document: Policy Planning to Reduce Greenhouse Gas Emissions,
Second Edition (EPA, 1998).
[4]
A. Chappell, and C. T. Agnew, “Modelling climate change in West African Sahel rainfall
(1931-90) as an artifact of changing station locations,” International Journal of
Climatology, vol. 24, no 5, April 2004, pp. 547-554.
[5] Jim McConnach, Janet Ranganathan, Scott Rouse, Thomas Baumann and Namat
Elkouche “Plans and Programs for Greenhouse Gas Reductions, Removals and
Trading” Presented at PGI2004, Orlando, Dec. 2004.
[6] A F Zobaa, “Climate Change Risks and Financial Sector” IEEE-PES General Meeting,
San Francisco, June 2005, Paper 05GM0044.
Impacts of GHG Programs and Markets on the Power Industry 591
[7] Peter Hoeppe and Gerhard Berz, “Risks of Climate Change – Perspective of the Re-
Insurance Industry, IEEE-PES General Meeting, San Francisco, June 2005, Paper
05GM0523.
[8] Lord Browne, BP Group Chief Executive, Speech to the World Petroleum Congress,
Johannesburg, 29 September 2005. Available:
[9] Stern Review of the Economics of Climate Change, Discussion Paper 31, January 2006, p3.
www.hm-treasury.gov.uk/Independent_Reviews/
stern_review_economics_climate_change/sternreview
[10] H. Hasselknippe, “Climate Change & Business”, Auckland, PointCarbon, November
2004.
[11] International Emissions Trading Association (IETA), World Bank, “State and Trends of
the Carbon Market”, Washington, DC, May 2005.
[12] W.D. Nordhaus, “Life After Kyoto: Alternative Approaches to Global Warming
Policies”, Yale University, December 9, 2005.
[13] PointCarbon. Available: .
[14] A.B. Lovins, “Climate Change and Energy”, presented at The Inaugural Lorne Trottier
Public Science Symposium, McGill University, November 24, 2005. Available:
[15] US DOE, “Energy Outlook 2001”, Energy Information Agency, Washington, 2001.
[16] DTI, “Review of the Feasibility of Carbon Dioxide Capture and Storage in the UK”, UK
Report, 2003.
[17] Battelle, “Global Energy Technology Strategy: Addressing Climate Change”, 2004.
Available: .
[18] IEA, “Energy Technology Perspectives: Scenarios and Strategies to 2050”, International
Energy Agency, OECD, Paris, 2006.
[19] Gouvernement de Québec, Plan d’Action 2006-2012, “Le Québec et les Changements
Climatiques: Un Défi pour l’Avenir”.
[20] IPCC, “Climate Change 2001: The Scientific Basis”, Third Assessment Report, UN
International Panel on Climate Change. Available:
[21] A.M. Miller, S. Suppiah, and R.B. Duffey, “Climate Change Gains More from Nuclear
Substitution that from Conservation”, Nuclear Engineering and Design, 236, pp.
1657-1667, 2006.
[22] T.M. Wigley, S.C.B. Raper, M. Hulme and S. Smith, 2004 “The MAGICC/SCENGEN
Climate Scenario Generator, Version 4.1”, Climate Research Unit. Available:
[23] Dr. Ahmed Zobaa , Cairo University, Egypt and James McConnach, Ontario, Canada
“International Response to Climate Change: An Overview” IEEE-PES GM2006,
Montreal (Paper ID 06GM0027)
[24] Gilles Potvin, Senior Program Officer, CDM & JI Office, Ontario Canada “Canada’s
CDM and JI Office” IEEE-PES GM2006, Montreal (Paper ID 06GM0660)
[25] Dr. Romney Duffey, Principal Scientist, Atomic Energy of Canada Ltd. Ontario,
Canada, “The Value of Non-Carbon Power and Emissions Avoidance”IEEE-PES
GM2006, Montreal (PaperID 06GM0914)
confirms the considerable advantage of adding new-build advanced nuclear plants as
potentially the lowest cost emissions reduction option with the highest value.
Adapting to climate changes will present challenges for all involved in infrastructure design
and construction, health and medicine, water resources management, coastal zone
management, agriculture, land use and forestry, and other areas. Increasing adaptive
capability is a priority for the short term, particularly for the poorest developing countries
which will be hit earliest and hardest by climate change and are least able to cope.
The RGGI CO
2
cap and the RPS requirements in Northeastern USA are adding new impacts
and considerations for power system planning in that region. RGGI will most likely
increase energy costs from fossil generators in the states where it will apply and possibly
affect reliability. RPS will encourage smaller renewable resource projects, mostly onshore
wind and biomass fuels that will interconnect at lower transmission or distribution voltage
levels, and will not likely help serve large load centers. As larger amounts of wind projects
are added, they could affect the need for increased operating reserve.
15.6 Acknowledgements
This Chapter has been compiled by James McConnach, Castle Hill Engineering Services,
Bracebridge, Ontario, Canada; Chair of the IEEE PES W.G. on Climate Change. Contributing
authors include; Romney B. Duffey (Principal Scientist with AECL, Pembroke, Ontario,
Canada); Gilles Potvin (CDM & JI Office, Foreign Affairs Canada, Ottawa, ON, Canada);
Alistair I. Miller (Researcher Emeritus, AECL, Pembroke, Ontario, Canada), and James E.
Platts (ISO New Zealand, Inc., Holyoke, MA, USA). The Chapter is primarily based on an
up-date of the papers presented at the Panel Session on “The Impacts of GHG Programs and
Markets on the Power Industry” at the IEEE-PES 2006 General Meeting (GM2006) in
Montreal ([23-26]).
15.7 References
[1] T J Hammons and J S McConnach. Proposed Standard for the Quantification of CO2
Emission Credits, Electric Power Components and Systems, Taylor & Francis, Vol.
33, (1), pp. 39-58, 2005.
[2] M. Jaccard, and W. D. Montgomery. 1996, “Costs of reducing greenhouse gas emissions
in the USA and Canada,” Energy Policy, vol.24, 10/11, 1996, pp.889-898.
[3] States’ Guidance Document: Policy Planning to Reduce Greenhouse Gas Emissions,
Second Edition (EPA, 1998).
[4]
A. Chappell, and C. T. Agnew, “Modelling climate change in West African Sahel rainfall
(1931-90) as an artifact of changing station locations,” International Journal of
Climatology, vol. 24, no 5, April 2004, pp. 547-554.
[5] Jim McConnach, Janet Ranganathan, Scott Rouse, Thomas Baumann and Namat
Elkouche “Plans and Programs for Greenhouse Gas Reductions, Removals and
Trading” Presented at PGI2004, Orlando, Dec. 2004.
[6] A F Zobaa, “Climate Change Risks and Financial Sector” IEEE-PES General Meeting,
San Francisco, June 2005, Paper 05GM0044.
Electricity Infrastructures in the Global Marketplace592
[26] James Platts, ISO New England, USA, “Impact of Regional Greenhouse Gas Initiative
and Renewable Portfolio Standards on Power System Planning” IEEE-PES GM2006,
Montreal (Paper ID 06GM0920)
[27] The IPCC Fourth Assessment Report: Working Group II Report "Impacts, Adaptation
and Vulnerability". See:
Reference websites include:
/>
/>
UNFCCC (includes CDM & JI)
IPCC www.ipcc.ch
APP
CCAR www.climateregistry.org
RGGI www.rggi.org
Canada CC www.climatechange.gc.ca
TEAM www.team.gc.ca/english/
Stern Review www.sternreview.org.uk
CCX www.chicagoclimatex.com
UK-ETS www.defra.gov.uk/environment/climatechange/trading
EU-ETS
UK Met Office www.metoffice.gov.uk
Power Markets of Asian Countries in the International Markets Environment 593
X
Power Markets of Asian Countries in
the International Markets Environment
This Chapter deals with the current state and problems of power markets in Asian countries
in the international market environment. The process of restructuring the electric power
industry and forming power markets in the world has almost a twenty-year history. Certain
experience has been gained that reflects both the positive effects of market transformations
in the electric power industry and some problems. Power markets in Asian countries are
formed on the basis of world experience. However, in different countries this process
progresses at different paces. Generalization of the experience in market transformations in
the electric power industries of Asian countries, analysis of the benefits, and risks that may
occur as a result of such transformations will help specialists solve the problems encoun-
tered in their countries.
16.1 Development Of Power Market In India
At the time of independence in 1947, the Indian power sector was merely concentrated in
and around a few towns and urban areas to meet the need. In the following decade, it saw
development of massive river-valley projects that led to some form of limited intercon-
nected systems to provide power to the population along particular belts as a side-by-side
benefit to the effort made for irrigation for agricultural need and flood control. However, the
nineteen sixties gave proper status to development of the power sector both in terms of ge-
nerating unit sizes and transmission voltage due to the requirement of rapid industrial de-
velopment. This called for integration and evolution of the state grids. Attempt to join these
grids to form the five regional grids became successful by the nineteen seventies and eigh-
ties with unit sizes going from 210 to 500 MW and transmission voltage from 220 to 400 kV
as a consequence of transfer of a large amount of power from coal pit-head (mine-mouth)
thermal power stations to urban conglomerations. Subsequent scenario of the power sector
in the nineteen nineties and beyond has been quite bright from the point of view of devel-
opment of HVDC systems, incorporated both for bulk power supply over a large distance
up to about 1370 km, be it within a large state or region or for inter-regional transfer of pow-
er, and also for inter-regional back-to-back connection for limited transfer of power. Side by
side to this, the sector was unbundled with the recognition of generation, transmission and
distribution as separate and distinct activities so far as the power supply system is con-
cerned. Both at state level and central level regulatory commissions were formed to decide
tariff, grid code, etc. With opening up, the sector experienced participation of the private
sector entities, mainly in generation and then to some extent in distribution. Transmission
still remains a monopoly, with public holding terming it as State Transmission Utility (STU)
or Central Transmission Utility (CTU) depending upon whether it belongs to any state or
center. With Central Electricity Regulation Commission (CERC) permitting open access to
16