Environmental Management in Practice Part 1 pot
Bạn đang xem bản rút gọn của tài liệu. Xem và tải ngay bản đầy đủ của tài liệu tại đây (1.3 MB, 30 trang )
ENVIRONMENTAL
MANAGEMENTIN
PRACTICE
EditedbyElzbietaBroniewicz
Environmental Management in Practice
Edited by
Elzbieta Broniewicz
Published by InTech
Janeza Trdine 9, 51000 Rijeka, Croatia
Copyright © 2011 InTech
All chapters are Open Access articles distributed under the Creative Commons
Non Commercial Share Alike Attribution 3.0 license, which permits to copy,
distribute, transmit, and adapt the work in any medium, so long as the original
work is properly cited. After this work has been published by InTech, authors
have the right to republish it, in whole or part, in any publication of which they
are the author, and to make other personal use of the work. Any republication,
referencing or personal use of the work must explicitly identify the original source.
Statements and opinions expressed in the chapters are these of the individual contributors
and not necessarily those of the editors or publisher. No responsibility is accepted
for the accuracy of information contained in the published articles. The publisher
assumes no responsibility for any damage or injury to persons or property arising out
of the use of any materials, instructions, methods or ideas contained in the book.
Publishing Process Manager Davor Vidic
Technical Editor Teodora Smiljanic
Cover Designer Jan Hyrat
Image Copyright 2010. Used under license from Shutterstock.com
First published June, 2011
Printed in Croatia
A free online edition of this book is available at www.intechopen.com
Additional hard copies can be obtained from
Environmental Management in Practice, Edited by Elzbieta Broniewicz
p. cm.
ISBN 978-953-307-358-3
free online editions of InTech
Books and Journals can be found at
www.intechopen.com
Contents
Preface IX
Part 1 Environmental Management at the National
and Regional Level 1
Curbing Climate Change through a
Chapter 1
National Development of Climate Change Policy 3
Sumiani Yusoff
Environmental Protection
Chapter 2
Expenditure in European Union 21
Elzbieta Broniewicz
Community Ecology and Capacity:
Chapter 3
Advancing Environmental Communication
Strategies among Diverse Stakeholders 37
Rosemary M. Caron,
Michael E. Rezaee and Danielle Dionne
Regional Issues in Environmental Management 67
Chapter 4
Hiroyuki Taguchi
Geo-environmental Terrain Assessments Based on
Chapter 5
Remote Sensing Tools: A Review of Applications
to Hazard Mapping and Control 85
Paulo Cesar Fernandes
da Silva and John Canning Cripps
The Implementation of IPPC Directive
Chapter 6
in the Mediterranean Area 119
Tiberio Daddi, Maria Rosa De Giacomo, Marco Frey,
Francesco Testa and Fabio Iraldo
Contaminated Sites and Public Policies
Chapter 7
in São Paulo State, Brazil 145
Ana Luiza Silva Spínola and Arlindo Philippi Jr.
VI
Contents
Sustainable Management of Muddy Coastlines 159
Chapter 8
Steven Odi-Owei and Itolima Ologhadien
Part 2 Environmental Management in Industry 175
Indicators of Sustainable Business Practices 177
Chapter 9
Hyunkee Bae and Richard S. Smardon
Assessment of Industrial Pollution Load in Lagos,
Chapter 10
Nigeria by Industrial Pollution Projection System (IPPS)
versus Effluent Analysis 207
Adebola Oketola and Oladele Osibanjo
Pollution Prevention in the Pulp and Paper Industries 223
Chapter 11
Bahar K. Ince, Zeynep Cetecioglu
and Orhan Ince
Retrofit Approach for the Reduction of Water and Energy
Chapter 12
Consumption in Pulp and Paper Production Processes 247
Jesús Martínez Patiño and Martín Picón Núñez
An Application Model for
Chapter 13
Sustainability in the Construction Industry 267
Fernando Beiriz and Assed Haddad
Assessing the SMEs’ Competitive Strategies
Chapter 14
on the Impact of Environmental Factors:
A Quantitative SWOT Analysis Application 285
Hui-Lin Hai
Implementation of ISO 14000 in
Chapter 15
Luggage Manufacturing Industry: A Case Study 297
S. B. Jaju
Part 3 Technical Aspects of Environmental Management 311
The Statistical Distributions of Industrial
Chapter 16
Wastes: an Analysis of the Japanese
Establishment Linked Input-output Data 313
Hitoshi Hayami and Masao Nakamura
The Effects of Paper Recycling
Chapter 17
and its Environmental Impact 329
Iveta Čabalová, František Kačík, Anton Geffert and Danica Kačíková
Overview Management Chemical Residues
Chapter 18
of Laboratories in Academic Institutions in Brazil 351
Patrícia Carla Giloni-Lima, Vanderlei Aparecido de Lima
and Adriana Massaê Kataoka
Contents
VII
Lengthening Biolubricants´ Lifetime
Chapter 19
by Using Porous Materials 371
Estibaliz Aranzabe, Arrate Marcaide,
Marta Hernaiz and Nerea Uranga
A Fuzzy Water Quality Index for
Chapter 20
Watershed Quality Analysis and Management 387
André Lermontov, Lidia Yokoyama, Mihail Lermontov
and Maria Augusta Soares Machado
Environmental Management of Wastewater
Chapter 21
Treatment Plants – the Added Value
of the Ecotoxicological Approach 411
Elsa Mendonça, Ana Picado,
Maria Ana Cunha and Justina Catarino
Technology Roadmap for Wastewater
Chapter 22
Reuse in Petroleum Refineries in Brazil 425
Felipe Pombo, Alessandra Magrini
and Alexandre Szklo
Preface
Inrecentyearsthetopic ofenvironmentalmanagement hasbecomeverycommon.In
sustainabledevelopment conditions, central and local governments much more often
noticetheneedofactinginwaysthatdiminishnegativeimpactonenvironment.
Environmental management may take place on many different levels – starting from
global level,e.g. climate chan
ges,through national and regional level (environmental
policy) and ending on micro level. This publication shows many examples of envi‐
ronmentalmanagement.
In the chapters dealing with national and regional level of environmental manage‐
ment, authors have presented many different aspects: communication system, envi‐
ronmental costs, regional development indicators. Cas
e studies from various world
regionshavealsobeenincluded.
The second section of the book deals with environmental management in various in‐
dustries.It presents sustainable business practices in construction industry, pulp and
paper industry. Case studies in organizations have been a welcome addition to this
section.
Thelastsectionfocu
sesontechnicalaspectsofenvironmentalmanagement,mainlyon
water,wasteandwastewatermanagement.
The diversity of presented aspects within environmental management and approach‐
ingthesubjectfromtheperspectiveofvariouscountriescontributesgreatlytothede‐
velopmentofenvironmentalmanagementfieldofresearch.
Iwouldliketothankallofth
eauthorsforpresentinghighqualitychapters,Mr.Vidic
forefficient projectmanagement and allInTechstaff formakingthis publicationpos‐
sible.
PhDElzbietaBroniewicz,
TechnicalUniversityofBialystok
Poland
Part 1
Environmental Management
at the National and Regional Level
1
Curbing Climate Change through a National
Development of Climate Change Policy
Sumiani Yusoff
University of Malaya
Malaysia
1. Introduction
In the last century, global development trends have tended to favour democratic systems
and the capitalist ideology. In turn more equitable, economically secure, technologically
advanced and intellectually progressive societies have developed around the world.
However, at the same time, the side-effects of these trends have also been the creation of a
materialistic society, high energy and resource consuming economy alongside inevitable,
irreversible environmental damage and resource plundering. Economic analysis has a
special role in contemporary national policy-making, as most of the important decisions fall
within the economic domain. A country’s development level is principally measured by its
GDP or monetary economic growth. Therefore, an economic model that is less materialistic
and less energy demanding have to be introduced to achieve sustainable development,
especially in the long-run. The development of a sustainable economic model has to
recognise the environmental impact as part of the development agenda and finding a viable
relationship between the two components. One common idea is to internalise the
environmental impact into the economic scene with benefits to society and economy at
large. To achieve the sustainable economic model, innovative policy instruments are
essential in creating the necessary shifts in economic trends or patterns. A climate change
policy plays a role in directing a country towards a sustainable economic development
model by regulating the GHGs emission with appropriate sectoral policies in place.
2. Non-renewable energy and carbon emission
With 0.4 per cent of the world’s population, Malaysia’s 27 million people accounted for 0.6
per cent of the global carbon emissions. As a developing country, Malaysia’s carbon
emissions growth is one of the fastest; it grew by 221 per cent from 1990 to 2004 (UNDP
Human Development Report 2007/2008).
1
Malaysia’s rapid rise in its carbon emissions is
the result of robust expansion in its industrial and automotive sectors, the over dependence
on fossil fuel as its TPES (Total Primary Energy Supply), unsustainable waste management
and forest and grassland conversion. With a CO
2
emission intensity of GDP of 1.198 million
metric tonne (MT) / USD million (IMF & CDIAC, 2006); Malaysia has one of the highest
1
Source: UNDP Human Development Report 2007/2008.
< />
Environmental Management in Practice
4
carbon emission intensity of GDP in the world, indicated a low economy output to carbon
emission.
Malaysia had announced that it is taking a voluntary reduction of up to 40 per cent carbon
emission intensity of GDP by the year 2020 compared to 2005 level at Copenhagen in 2009
(Theseira, 2010). To reach the carbon emission reduction, substantial action has to be taken.
This requires first and foremost a viable policy on climate change to achieve this goal.
Country Annual CO
2
emissions
(in ‘000 MT)
GDP
(in billions of USD)
CO2 intensity of GDP
(million MT / USD
billion)
Malaysia 187,865 156.86 1.198
Thailand 272,521 206.99 1.317
Indonesia 333,483 364.35 0.915
Mexico 436,150 952.34 0.458
Argentina 173,536 212.71 0.816
Turkey 269,452 529.19 0.509
Sweden 50,875 393.76 0.129
UK 568,520 2,435.70 0.233
US 5,752,289 13,178.35 0.437
Japan 1,293,409 4,363.63 0.296
Table 1. Comparison of the carbon dioxide emissions intensity of GDP in 2006
2
A high carbon emission intensity of GDP would normally display the following results in
the economy: The major sectors that drive the country’s economic growth have high carbon
emissions with GDP by sector: Industrial: 42.3 per cent, Services: 47.6 per cent and
Agricultural: 10.1 per cent (CIA, 2005). In 2000, the country’s total primary energy supply
(TPES) was 49.47 million tons of oil equivalents (MTOE). The greatest percentage of the
Malaysian fuel mix is petroleum products. In 2006, the TPES increase to 68.33 MTOE and it
is projected to grow at a 3.5 per cent per year to 147 MTOE in 2030 because of the increase in
demand for coal, oil and gas; with coal demand accounting for the highest growth rate at 9.7
per cent per year through 2030 (IEA, 2008).
Higher energy use per GDP indicates a lower economy output per unit of energy use.
Malaysia has one of the highest energy uses (oil equivalent) per unit GDP compared with
the developed countries in the comparison lists. Although Malaysia shows a lower value
compared with regional developing countries; the fossil fuel consumption in the total
energy shares (95.5 per cent) is higher than Thailand (81.2 per cent) and Indonesia (68.8 per
cent). This finding can deduce that Malaysia has the highest carbon emission intensity of
GDP among the countries of comparison.
2
Sources: GDP data - IMF (International Monetary Fund), 2006 CO
2
emission - CDIAC (Carbon Dioxide
Information Analysis Center), 2006
Curbing Climate Change through a National Development of Climate Change Policy
5
48%
35%
12%
4%
1%
Gas
Oil
Coal
Comb.
Renew.&
Waste
Hydro
Fig. 1. Malaysia’s shares of TPES in 2007
3
Country MT of
CO
2
emission/
capita
Energy use
(kg of oil
equivalent
per capita)
Energy use
(kt of oil
equivalent)
Energy use /
GDP (kt of oil
equivalent /
USD billion)
Fossil fuel
energy
consumption
(% of total)
Malaysia 7.2 2733 72,589 462.76 95.5
Thailand 4.3 1553 103,991 502.40 81.2
Indonesia 1.5 849 190,647 523.25 68.8
Mexico 4.1 1750 184,262 193.48 89.3
Argentina 4.4 1850 73,065 343.50 89.5
Turkey 3.6 1370 100,005 188.98 90.5
Sweden 5.6 5512 50,422 128.05 32.9
UK 9.4 3464 211,308 86.76 89.6
US 19 7766 2,339,942 177.56 85.6
Japan 10.1 4019 513,519 117.68 83.2
*Energy use refers to the TPES
*Fossil fuel refers to coal, oil and natural gas
Table 2. Comparison of energy use and fossil fuel consumption, 2007
4
3. Unsustainable electricity production
Energy in Malaysia is consumed mainly in the transportation and industrial sectors, 38.2 per
cent and 37.8 per cent respectively in 2005, followed by commercial and residential sectors
at 12.5 per cent and the non-energy, which consumes 9.7 per cent of the total energy.
Electrical energy production increased from 1,622 gigawatt per hour (GWh) in 1963 to 4,971
3
Source: IEA (International Energy Agency), 2008.
<
4
Source: CDIAC, 2006; IEA, 2007; IMF, 2006.
Environmental Management in Practice
6
GWh in 1974 and 57,435 GWh in 1998. In 1996, 16 per cent of electrical production was
hydro generated, and over 83 per cent was of thermal origin (National Energy Balance,
PTM, 2006). In 2007, the country hit a staggering 101325 GWh of total electricity production
with only about 6.4 per cent was hydro generated, (coal 29.5 per cent, natural gas 62 per cent
and oil 2.1 per cent) according to the statistic shown by IEA in 2010.
Country Electricity
consumption*
(TWh)
Electricity
Consumption
/Population
(kWh/capita)
Electricity (production by source) %
Fossil
fuel*
hydro nuclear others
Malaysia 97.39 3668 93.6 6.4 - -
Thailand 137.68 2157 91.4 5.7 - 2.9
Indonesia 127.17 564 87.1 7.9 - 5.0
Mexico 214.34 2028 81.4 10.6 4.0 4.0
Argentina 104.99 2658 65.8 26.7 6.3 1.2
Turkey 163.35 2210 80.9 18.7 - 0.4
Sweden 139.40 15238 2.4 44.5 45.0 8.1
UK 373.36 6142 77.6 2.3 15.9 4.2
US 4113.07 13616 71.6 6.3 19.2 2.9
Japan 1082.72 8475 66.8 7.4 23.3 2.5
*Gross production + imports - exports - transmission/distribution losses
*Fossil fuel refers to oil, gas and coal
Table 3. Electricity production by source in 2007
5
The country’s electricity consumption per capita is higher than the regional and other
developing countries in the comparison list. Furthermore, the share of fossil fuel of the
electricity production is the highest among all the countries in comparison. From the brief
findings, it can be deduced that the factor contribute to the high carbon emission in any
major sectors is the non-renewable energy supply. To reduce the carbon emission in any
sector, a fundamental shift in the country’s TPES to a higher share of renewable energy is an
imperative determinant.
4. Climate change related policies in Malaysia
In general, Malaysia adopts a “precautionary principle” policy with actions to mitigate or
adapt to climate change. A National Climate Committee was formed in 1995 with various
government agencies, stakeholders from the business and civil society groups. The
strategies adopted by the committee include to reduce the heavy reliance on fossil fuel in
energy sector, promote renewable energy and energy efficiency, public awareness
programme, sustainable forest management, ensure food sufficiency and undertaking
coastal vulnerability index (CVI) study that serve as a basis for the development of adaptive
5
Source: IEA, 2010.
Curbing Climate Change through a National Development of Climate Change Policy
7
measures to mitigate the impact of sea level rise. (Conservation and Environment
Management Division, CEMD, 2007)
Existing relevant policies in the country that will, directly or indirectly affect the
development of an integrated and coherent climate change policy include:
1. National Policy on the Environment, 2002
2. National Forestry Policy, 1978
3. National Policy on Biological Diversity, 1998
4. National Energy Policy, 1979
5. National Automotive Policy, 2009
6. Third National Agricultural Policy, 1998-2010
7. National Physical Plan, 2006
5. National renewable energy policy 2011
Based on the data below (see Table 4), about 40-50 per cent of the carbon emissions
originated from the energy and industrial sector. The emission from the industrial activities
is mainly attributed to the energy sector as well. Therefore, the focus has to be on the energy
sector in order to achieve any significant reduction goal.
Rank Sub-sector GHGs Emission, CO
2
e
(mil. MT)
Percentage
1 Emission from energy industries
CO
2
58,486 28.2
2 Transportation CO
2
35,587 17.2
3 Manufacturing and construction
CO
2
26,104 12.6
4 Landfills CH
4
24,541 11.8
5 Forest and grassland conversion CO
2
24,111 11.6
6 Fugitive emissions from fuel CH
4
21,987 10.60
7 Mineral products CO
2
9,776 4.7
8 Emission from soil CO
2
4,638 2.2
9 Commercial CO
2
2,122 1.0
207,352 99.9
Table 4. Key sources of GHGs emissions in Malaysia
6
The key policies guiding energy-related activities in Malaysia consisted of:
National Petroleum Policy 1975
National Energy Policy 1979
National Depletion Policy 1980
Four Fuel Diversification Policy 1981
Fifth Fuel Diversification Policy (Eighth Malaysia Plan 2001-2005)
In conjunction with these policies, a number of government supported projects to assist the
National Energy Conservation plans, have been identified. Under the guidance and
supervision of the Malaysia Energy Centre (PTM), some of the projects introduced are CDM
(Clean Development Mechanisms), IRP (Integrated Resource Planning), MEDIS (Malaysia
6
Source: Abdul Rahim Nik, FRIM (Forest Reserve Institute of Malaysia), 2009.
Environmental Management in Practice
8
Energy Database and Information System), MIEEIP (Malaysian Industrial Energy Efficiency
Improvement Project), BioGen (biomass power generation and co-generation in palm oil
industry), MBIPV (Malaysian Building Integrated Photovoltaic Technology Application
Project) and Demand Side Management.
The SREP (Small Renewable Energy Programme) allows Renewable Energy (RE) projects
with up to 10 megawatt (MW) of capacity only. The programme was introduced during 8
th
Malaysia Plan (2001-2005) under the fifth fuel diversification policy which targeted a 5 per
cent renewable energy share of total electricity generation; however failed to achieve its
target. In 9
th
Malaysia Plan or 9
th
MP, (2006-2010), targeted RE capacity to be connected to
power utility grid is 300MW in Peninsula Malaysia and 50MW in Sabah with a 1.8 per cent
of total power generation mix (65 per cent natural gas, 36 per cent coal, 6 per cent hydro &
0.2 per cent oil). However, RE capacity connected to power utility grid as of 31
st
December
2009 was 53MW which is barely 15 per cent of 9
th
MP target. The off grid RE (private palm
oil millers and solar hybrids) is more than 430MW (Badriyah, 2010).
The reasons for slow RE development are identified as market failure, absence of legal
framework, lack of institutional measures and constraint in financial and technological
aspects. A new ministry, Ministry of Energy, Water and Green Technology (KeTTHA) was
formed in 2009 following the introduction of Green Technology Policy 2009. The ministry
had formulated goals on sustainable use of energy and water. The ministry also provides
incentive for the use of green technology. A new policy on renewable energy (National
Renewable Energy Policy) will be introduced next year (Loo, 2010). With the new Act, a new
feed-in tariff system will be introduced to stimulate the renewable energy sector. The policy
statement is “Enhancing the utilization of indigenous renewable energy resources to
contribute towards national electricity supply security and sustainable socio-economic
development.”
6. Potential carbon emission reductions in energy sector
The potential of carbon emissions reduction in energy sectors is discussed in this section.
Comparison is made between the existing use of renewable energy and its potential in
Malaysia. It is found that Malaysia has a vast potential in renewable energy as compared
with the existing utilisation.
Renewable energy Installed Capacity (MW) Potential Capacity (MW)
Solar 6.2 6500
Wind 0.2 (low potential)
Municipal Solid Waste - 400
Hydropower 2225
(year 2000)
22 000
Mini-Hydro 23.8 500
Biomass/Biogas
479 1300
(Palm Oil Waste)
Table 5. Comparison of currently installed and potential capacity of renewable energy
7
7
Source: Loh, T., Yusoff, S., 2009.
Curbing Climate Change through a National Development of Climate Change Policy
9
Year Cumulative RE Capacity RE Power Mix
(vs Peak Demand)
Cumulative CO
2
avoided
2010 73 MW 0.5% 0.3 mt
2015 985 MW 6% 11.1 mt
2020 2080 MW 11% 42.2 mt
2030 4000 MW 17% 145.1 mt
*RE capacity achievements are dependent on the size of RE fund
*Assumptions: Feed-in Tariff (FiT) in place & 15.6 per cent compound annual growth rate (CAGR) of RE
power capacity from 2011 to 2030
Table 6. National Renewable Energy Target
8
The current power generation capacity connected to the Malaysia National Grid is 19,023
MW in 2007 (Energy Commission, 2007). Based on the data in Table 4, the potential power
generation by renewable energy is 30,700 MW, which is more than the current power
generation. Therefore, if the country can reach 40% of the potential renewable energy
capacity, 60% of the existing power generation will be from renewable energy. However,
less than 10% of the potential renewable energy is utilized currently.
With the implementation of feed-in tariff, the RE power mix is projected to reach 11% in
year 2020 (Badriyah, 2010) and the achievement of the 40% reduction of carbon intensity of
GDP will be subjected to the country GDP growth. Therefore, the increase of the renewable
energy share in the total power generation is a predominant agenda in the development of a
climate change policy.
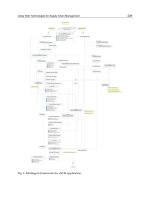
7. Draft national climate change policy
The policy study on climate change was conducted by CEMD under the Ministry of Natural
Resource Environment (MNRE) in collaboration with LESTARI (Institute for Environment
and Development). The study adopted a three-pronged approach to support the national
positions at the UNFCCC and Kyoto Protocol meetings, formulation of a national policy and
action plan, and delineation of state level responses to climate change adaptation and
mitigation (Figure 2). The first approach is the critical review of several international and
local research papers and public documents that was related to post-2012 responses,
decision documents of the UNFCCC and Kyoto Protocol, Malaysia’s Third Outline
Perspective Plan (OPP3), Ninth Malaysia Plan (RMK9), relevant national policies, and
Malaysia’s Initial National Communication (INC). The second approach involved the
comparative studies of national policies or strategies on climate change from selected
countries and the third approach focused on stakeholder consultation through national and
regional workshops, interviews and surveys which were carried out in a four overlapping
phases. The need for a national policy on climate change was articulated in the first and
second phase; while in the third and fourth phase, the policy framework including its key
actions was supported as a promising tool to mainstream climate change in national
development (Tan, et al, 2009).
8
Source: Badriyah, KeTTHA, August 2010.
Environmental Management in Practice
10
Fig. 2. Climate change policy study approach and expected outputs
9
Fig. 3. Overall framework of a national climate change policy
10
9
Source: Tan, C. T.; Pereira, J. J. & Koh, F. P. (2009). Stakeholder Consultation in the Development of
Climate Change Policy: Malaysia’s Approach. Environmental Policy: A multinational conference on
policy analysis and teaching methods, KDI School of Public Policy and Management, Seoul, Korea.
Curbing Climate Change through a National Development of Climate Change Policy
11
Ob
j
ectives
Mainstreamin
g
of measures to address climate chan
g
e challen
g
es throu
g
h
strengthened economic competitiveness, wise management of resources,
environmental conservation and enhanced quality of life for sustainable development.
Integration of responses into national policies, plans and programmes to strengthen
the resilience of development from arising impacts of climate change.
Strengthening of institutional and implementation capacity to better harness
o
pp
ortunities in reducin
g
ne
g
ative im
p
acts of climate chan
g
e.
Princi
p
les/Strate
g
ic Thrusts
Principle 1. Development on a Sustainable Path: Inte
g
rate climate chan
g
e responses in
national development plans to fulfil the country’s aspiration for sustainable development.
Strategic Thrust 1. Facilitate the harmonisation of existing policies to address climate
change adaptation and mitigation in a balanced manner.
Strategic Thrust 2. Institute measures to make development climate-resilient through
low carbon economy to enhance global competitiveness and attain environmentally
sustainable socio-economic growth.
Strategic Thrust 3. Support climate-resilient industrial development and investment in
pursuit of sustainable socio-economic growth.
Principle 2. Sustainability of Environment and Natural Resources: Initiate actions on
climate change issues that contribute to environmental conservation and sustainable use of
natural resources while enhancing energy efficiency and sufficiency as well as water and
food security
.
Strategic Thrust 1. Adopt balanced adaptation and mitigation measures to climate-
proof development, strengthen environmental conservation and promote
sustainability of natural resources
Principle 3. Integrated Planning and Implementation: Integrate planning and
implementation to climate-proof development.
Strategic Thrust 1. Institute measures to integrate cross-cutting issues in policies,
plans, programmes and projects in order to increase resilience to and minimise
negative impacts of climate change.
Strategic Thrust 2. Support knowledge-based decision making through intensive
climate related research and development and capacity building of human resources.
Principle 4. Effective Participation: Improve participation of stakeholders and major
groups for effective implementation of climate change responses.
Strategic Thrust 1. Improve collaboration through efficient communication and
coordination among all stakeholders for effective implementation of climate change
responses.
Strategic Thrust 2. Increase awareness and public participation to promote
behavioural responses to climate change.
Principle 5. Common but Differentiated Responsibility: International involvement on
climate change will be based on the principle of common but differentiated responsibility.
Strategic Thrust 1. Strengthen involvement in international activities on climate
chan
g
e based on the principle of common but differentiated responsibilit
y
.
Table 7. The Draft National Policy on Climate Change – Objectives, Principles and Strategic
Thrusts
11
10
Op. cit. Tan, et al. (2009).
11
Source: Pereira, 2008
Environmental Management in Practice
12
8. Challenges in the development of climate change policy in Malaysia
8.1 Institutional reformation and policy restructuring
The formation of an institutional framework on climate change issue is the foundation to
achieve any result in carbon emission. A clear cut government policy direction on
sustainable development has to be established in the quest of achieving goal on carbon
emission reduction. The agenda toward low carbon economy requires strong and persistent
institutional reformation and political will and direction in a long term basis. A
government’s primary concerns are the country’s economic growth and social welfare.
Urgency and priority are the major considerations for the development of any public policy
especially for a developing country. Tackling climate change issue or striving towards the
sustainable development model is a long term planning process. A country abundant in
natural resources may lack urgency in policy planning and implementation in climate
change. Coordination and cooperation between various government agencies toward a
achieving a common goal on carbon emission reduction is lacking at the moment. In the
Malaysian context, political influence is always the prime mover in creating any trends as
the decision making power is lacking among the civil servants. Another constraint in policy
making process is the conflict in authority and power distribution between federal and state
government.
12
8.2 Lack of expertise in climate change issue
The R&D in climate change is relatively new in the country with concern on the matter is
primarily driven by the signing and ratifying of Kyoto Protocol in carbon emission
reduction and now more recently, the 40 per cent reduction of carbon emission intensity of
GDP as pledged in COP 15. Local expertise on climate change issue especially the trend in
the country is important and a proper data management plan needs to be implemented. The
country need climate change experts that possess knowledge in climate change globally as
well as have a strong understanding on the local socio economic development. Education
from primary level is important to instil the understanding of climate change issue to the
people since young. With proper education system, the topic can become more pertinent
among the people and hopefully will produce more climate change experts.
8.3 Economic status (lack of financial capacity)
State of the art technology and solution to any environmental issue are readily available as
solutions. The constraint is in its economic viability (i.e. pricing). The economic status does
not allow solution for long term environmental issue which typically consume huge amount
of money. For example, in waste management sector, the polluter pay principle (PPP) can
directly encourage recycling. However it must be equipped with a proper pricing
mechanism such as a variable unit based pricing scheme which will serve as a basis of the
carrot and stick approach (Munasinghe, 2008). Another example is greywater or sullage that
contributes to of 6 per cent of the total river point source pollution (DOE, 2001). The solution
to sullage discharge is to retrofit the existing piping back to the sewer line for further
treatment. However, the constraint is always related to the cost and priority. The DID
(Department of Irrigation and Drainage) had introduced some measures in tackling river
12
Based on the stakeholders discussion session at SLiM 2010 Roundtable: Creating an Institutional
Framework for Implementing Sustainable Development (8
th
July)
Curbing Climate Change through a National Development of Climate Change Policy
13
pollution such as gross pollutant trap (GPT) and FOG (fat, oil and grease) trap, but these
have not been very effective. The most pragmatic solution is sullage pipe retrofitting which
is costly and require strong political will to implement it.
13
The same situation happens to
renewable energy such as solar, biomass, biogas and the like. The example shows the
inadequacy of financial capability in solving a pertinent local environmental issue.
8.4 Public understanding on climate change issue
Public understanding on environmental issue is imperative in the development of the
climate change policy as it directly affect the life of an individual. In Malaysia, the
understanding of climate change by the public at large is rather insufficient. For example,
most of the people are not aware that driving a car or petrol consumption can lead to
climate change by carbon emission. Awareness campaigns by the government or NGOs
does not take into account the bigger picture provide an understanding of the cause of
environmental issues such as climate change. The publicity drive by the government
produces only a superficial understanding on the part of the general public so it does not
accurately reflect or actually lead to good environmental practices as such. That is to say, the
rhetoric is not matched by the reality of an environmentally-friendly situation.
One of the tools to analyse the entire environmental impacts of an issue is LCA (Life Cycle
Assessment) which the public in general do not understand. One example is the issue of the
banning on the use of plastic bags by certain states in the country. For most, plastic is
something “negative” to the environment because of its non-biodegradable nature. Plastic
which is beneficial as a “carrier” or for packaging may pose a problem when it comes to
“inconsiderate” disposal, especially to any water bodies. However, banning the use of
plastic bags will never solve the inconsiderate disposal problem and is myopic,
impracticable and counter-productive. The solution has to be proper education and
management since plastic bags are still a necessity as its use has yet to be outlasted by
environmental concerns. The use of plastic packaging has lesser negative environmental
impact if compared with other materials such as paper and metal because of the lower
carbon emission in a life cycle perspective. In fact, plastic has reduced the consumption of
fossil fuel on transportation and manufacturing.
14
8.5 Equity in socio-economic development
An important social criterion must be that climate change should not be a hindrance to the
development of a more equitable society where no one is made worse off. Thus,
environmental policies must leave room for the proper allocation and distribution of
resources in the pursuit of socio-economic welfare of the least better off in society.
Furthermore, without an equitable society, environmental policies are very difficult to be
implemented. For example, solar panel is burdensome for most middle and lower income
household without incentives. The total elimination of logging activities will cause the loss
of employment among low income workers. However there are also counter-examples: An
effective public transport system can bring benefit to the poor as well as reduce carbon
emission.
The development of a climate change policy has to include a concern of the poor as the
policy may affect their livelihood. In a global perspective, the use of parameters like carbon
13
(Keizrul, 2010, Public Lecture at Faculty of Engineering, University of Malaya, on World Water Day,
22
nd
March).
14
Source: MPMA (Malaysian Plastics Manufacturers Association), 2010.
Environmental Management in Practice
14
emission per GDP and per capita is questionable in relation to its applicability to all
countries with differing levels of economic growth. Developed countries usually have a
lower carbon emission per GDP but a higher carbon emission per capita; because of their
high economy power. While developing countries usually have comparably higher carbon
emission per GDP but lower carbon emission per capita. The measurement of emission with
GDP (economy) correlation should be a short term parameter to provide incentive and
opportunity for developing countries to boost their economy without much emission
liability. However, for developed countries, the focus should be the emission per capita with
the strong economy status. Kverndokk (1995)
15
argued that conventional justice and moral
principles should favour the equitable allocation of future GHG emission rights on the basis
of population, consistent with the UN human rights declaration underlining the equality of
all human beings.
9. Discussion
The paper had introduced the existing carbon emission status in the country, two policies
(National Renewable Energy and National Climate Change Policy) and identified the
challenges of the development and implementation of these policies. To overcome the
constraints arise in a viable approach, the climate change impacts have to be embedded into
any policy development. Internalization of climate impacts in economic with mixed
instruments, establishment of GHGs information centre, adaptation strategy and
institutional redesigning and education at all levels are the keys to achieve the carbon
reduction target.
9.1 Internalize climate change impact into the economy domain
As an externality in the current economy trend, environmental issue always meets the
problem of market failure. To achieve any goal and substantial result in environmental
issue, it has to be internalized in the economy domain by putting a price tag on it. When
there is a price to pay for any environmental damage caused, people will be able to feel it.
For example, climate change issue is something either people can’t feel it or due to mere
selfishness. Another example is landfill, which most people has never seen before and do
not understand its negative impacts. The economic functions of the environment have to be
valued for an internalization to happen. Three outlines for the evaluation of the functions
are amenity services (natural beauty, recreational, etc), natural resources (minerals and non-
minerals, forest, etc) and assimilation of waste products (land, water and air). With this
perception of recognizing the economic value of environment, the traditional economic
system and the environment will be dynamically interrelated (Munasinghe, 2008).
The entire activity or process of an environmental issue has to be integrated with price
mechanism to create a “market based” solution. Market based instrument (MBI) is an
economic approach to influence people to include environmental matters in any decision
making. Some of the examples are tradable permits, polluter pay principle, green levy, eco-
labeling, landfill tax, etc.
The polluter pay principle argues that those who create negative impact to the environment
should pay the corresponding costs. The economic rationale is to provide alternatives and
15
Source: Kverndokk, S., 1995. Tradeable CO
2
Emission Permits: Initial Distribution as a Justice
Problem, Environmental Value, 4(2), 129-48. <
Curbing Climate Change through a National Development of Climate Change Policy
15
incentive for polluters to reduce their impact or emission to optimal level. This “carrot and
stick” approach that incorporated in the principle can be further extended to principle of
recompensing victim by using the revenues collected by polluters (Munasinghe, 2008). The
approach is important to ensure fairness in the context of social equity. In this method,
economic valuation is an important prerequisite. CBA (cost benefit analysis) can be applied
to work out the valuation and quantify the damage in a monetary way.
Multi-criteria analysis will be useful for environmental solution that can’t be evaluated with
single criterion approach like CBA. MBI provides individual or company greater flexibility
in their approaches to pollution management. Contrary to the command and control
approach which is more prescriptive; MBI provides incentive to innovate and individual at
large to make the correct decision. By having a clear and inclusive monetary structure in
punishing or rewarding in the context of an environmental issue, the result will be more
obvious.
9.2 Mixed instrument: A practical approach in the decoupling of economy growth and
environmental impact (carbon emission)
While MBI can be more cost-effective than regulatory instruments it has its own drawbacks.
The major weaknesses of MBI are: (Munasinghe, 2008)
Their effects on environmental quality are not as predictable as those under a
traditional regulatory approach as polluters may choose their own solutions.
In the case of pollution charges, some polluters opt to pollute and to pay a charge if the
charge is not set at the appropriate level.
Require sophisticated institutions to implement and enforce them properly, particularly
in the case of charges and tradable permits.
Fig. 4. Decoupling of resource use with economy growth and environmental impact
Internalization of environmental impact in an economic perspective alone can’t bring out a
comprehensive solution in carbon emission reduction. The most apparent drawback is the
rich will pollute more while the poor will pollute less. It doesn’t solve the fundamental issue