Integrated Waste Management Volume I Part 1 potx
Bạn đang xem bản rút gọn của tài liệu. Xem và tải ngay bản đầy đủ của tài liệu tại đây (3.5 MB, 35 trang )
INTEGRATED WASTE
MANAGEMENT
– VOLUME I
Edited by Er. Sunil Kumar
Integrated Waste Management – Volume I
Edited by Er. Sunil Kumar
Published by InTech
Janeza Trdine 9, 51000 Rijeka, Croatia
Copyright © 2011 InTech
All chapters are Open Access articles distributed under the Creative Commons
Non Commercial Share Alike Attribution 3.0 license, which permits to copy,
distribute, transmit, and adapt the work in any medium, so long as the original
work is properly cited. After this work has been published by InTech, authors
have the right to republish it, in whole or part, in any publication of which they
are the author, and to make other personal use of the work. Any republication,
referencing or personal use of the work must explicitly identify the original source.
Statements and opinions expressed in the chapters are these of the individual contributors
and not necessarily those of the editors or publisher. No responsibility is accepted
for the accuracy of information contained in the published articles. The publisher
assumes no responsibility for any damage or injury to persons or property arising out
of the use of any materials, instructions, methods or ideas contained in the book.
Publishing Process Manager Romina Krebel
Technical Editor Teodora Smiljanic
Cover Designer Jan Hyrat
Image Copyright Perig, 2010. Used under license from Shutterstock.com
First published July, 2011
Printed in Croatia
A free online edition of this book is available at www.intechopen.com
Additional hard copies can be obtained from
Integrated Waste Management – Volume I, Edited by Er. Sunil Kumar
p. cm.
ISBN 978-953-307-469-6
free online editions of InTech
Books and Journals can be found at
www.intechopen.com
Contents
Preface IX
Part 1 Planning and Social Perspectives
Including Policy and Legal Issues 1
Chapter 1 Governance Crisis or Attitudinal Challenges?
Generation, Collection, Storage and
Transportation of Solid Waste in Ghana 3
Oteng-Ababio Martin
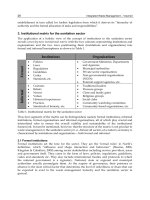
Chapter 2 Institutional Matrix
for Sustainable Waste Management 23
Peter Appiah Obeng and Joseph Boateng Agyenim
Chapter 3 Waste Management Facility Siting and Social Conflicts
– the Case of Hungary 41
Szántó Richárd
Chapter 4 Planning the Management of Municipal Solid Waste:
The Case of Region “Puglia (Apulia)” in Italy 55
Ludovico Spinosa and Carmine Carella
Chapter 5 Strength and Weakness of Municipal
and Packaging Waste System in Poland 79
Joanna Kulczycka, Agnieszka Generowicz
and Zygmunt Kowalski
Chapter 6 Management of Municipal Solid Wastes:
A Case Study in Limpopo Province,
South Africa 91
J. S. Ogola, L. Chimuka and S. Tshivhase
Part 2 Processing of Solid Waste 113
Chapter 7 Dry Digestion of Organic Residues 115
Sigrid Kusch, Winfried Schäfer and Martin Kranert
VI Contents
Chapter 8 Production of Activated Char and
Producer Gas Sewage Sludge 135
Young Nam Chun
Chapter 9 Modelled on Nature
– Biological Processes in Waste Management 153
Katharina Böhm, Johannes Tintner and Ena Smidt
Chapter 10 Development of On-Farm Anaerobic Digestion 179
Kevin G Wilkinson
Chapter 11 New Municipal Solid Waste Processing Technology
Reduces Volume and Provides Beneficial Reuse
Applications for Soil Improvement and Dust Control 195
H.A. Torbert, D.L. Gebhart and R.R. Busby
Chapter 12 Waste to Energy, Wasting Resources and Livelihoods 219
Jutta Gutberlet
Part 3 Industrial Solid Waste 237
Chapter 13 Solid Waste Utilization in Foundries
and Metallurgical Plants 239
Jan Jezierski and Krzysztof Janerka
Chapter 14 Economic and Operational Feasibility Analysis
of Solid Waste Minimization Projects 265
Matthew J. Franchetti
Chapter 15 Waste Management at the Construction Site 281
Joseph Laquatra and Mark Pierce
Chapter 16 Deconstruction Roles in the Construction and Demolition
Waste Management in Portugal -
From Design to Site Management 301
João Pedro Couto and Paulo Mendonça
Chapter 17 Hydraulic Conductivity of Steel Pipe Sheet Pile
Cutoff Walls at Coastal Waste Landfill Sites 323
Shinya Inazumi
Chapter 18 Environmental-Friendly Biodegradable
Polymers and Composites 341
Bergeret Anne
Chapter 19 Geochemical Risk Assessment Process
for Rio Tinto’s Pilbara Iron Ore Mines 365
Rosalind Green and Richard K Borden
Contents VII
Chapter 20 A Study of Elevated Temperatures on the Strength
Properties of LCD Glass Powder Cement Mortars 391
Her-Yung Wang and Tsung-Chin Hou
Chapter 21 Cost-Benefit Analysis of the Clean-Up
of Hazardous Waste Sites 405
Carla Guerriero and John Cairns
Part 4 Software Applications 415
Chapter 22 Benefits from GIS Based Modelling
for Municipal Solid Waste Management 417
Christos Chalkias and Katia Lasaridi
Chapter 23 Comparison of the Suitability of Two LCA Procedures
in Selecting the Best MSW Management System 437
Giovanni De Feo and Carmela Malvano
Chapter 24 Life Cycle Assessment in Municipal
Solid Waste Management 465
Konstadinos Abeliotis
Part 5 Leachate and Gas Management 483
Chapter 25 Odour Impact Monitoring for Landfills 485
Magda Brattoli, Gianluigi de Gennaro and Valentina de Pinto
Chapter 26 Performance Indicators for Leachate Management:
Municipal Solid Waste Landfills in Portugal 507
Graça Martinho and Joana Santos
Chapter 27 Measurements of Carbonaceous Aerosols Using
Semi-Continuous Thermal-Optical Method 521
Xiao-Ying Yu
Preface
The quantum of wastes generated in urban centres has become one of the difficult
tasks for those responsible for their management. The problem is becoming acute
specially in economically developing countries, where there is a financial crunch, and
other resources are scarce.
Although, there are varieties of publications dealing with various topics of solid waste
management, most of these documents have been published addressing the needs of
developed nations. Only a few documents have been specifically written to provide
the type of information that is required by those in developing countries. Also, most of
the documents are not accessible to all the readers, and there as well a strong need to
update the published documents once again in view of globalization. To maximize the
use of limited available resources, it was decided to combine information gathered
from both developed and developing countries on all the elements of solid waste
management under the title “Integrated Waste Management”. Due to overwhelming
response from authors all around the world, the book has been divided into two parts,
i.e. Volume I and II, and the papers have been grouped under different sub-headings.
This publication has been prepared primarily for researchers, engineers, scientists,
decision-makers and policy makers involved in the management of solid wastes. The
information provided in both the volumes would also be useful to students studying
environmental science and engineering.
Er. Sunil Kumar
Scientist
Council of Scientific and Industrial Research (CSIR)
National Environmental Engineering Research Institute (NEERI)
Kolkata Zonal Laboratory
Kolkata,
India
Part 1
Planning and Social Perspectives
Including Policy and Legal Issues
1
Governance Crisis or Attitudinal Challenges?
Generation, Collection, Storage and
Transportation of Solid
Waste in Ghana
Oteng-Ababio Martin
University of Ghana
Ghana
1. Introduction
Waste is a continually growing problem at global, regional and local levels and one of the
most intractable problems for local authorities in urban centers. With continuous economic
development and an increase in living standards, the demand for goods and services is
increasing quickly, resulting in a commensurate increase in per capita waste generation
(Narayana, 2008). In most developing countries, the problem is compounded by rapid
urbanization, the introduction of environmentally unfriendly materials, changing consumer
consumption patterns, lack of political commitment, insufficient budgetary allocations and
ill motivated (undedicated) workforce.
In Ghana, deficiencies in solid waste management (SWM) are most visible in and around
urban areas such as Accra, Tema and Kumasi where equally important competing needs
and financial constraints have placed an inordinate strain on the ability of the authorities to
implement a proper SWM strategy in tandem with the rapid population growth.
Consequently, most of the urban landscape is characterized by open spaces and roadsides
littered with refuse; drainage channels and gutters choked with waste; open reservoirs that
appear to be little more than toxic pools of liquid waste; and beaches strewn with plastic
garbage. The insidious social and health impact of this neglect is greatest among the poor,
particularly those living in the low-income settlements (UN-Habitat, 2010).
The provision of such environmental services had typically been viewed as the
responsibility of the central government. However, the costs involved, coupled with the
increasing rate of waste generation due to high urban population growth rates, have made it
difficult for collection to keep pace with generation, thus posing serious environmental
hazards. Apart from the unsightliness of waste, the public health implications have been
daunting, accounting for about 4.9% of GDP (MLGRD, 2010a). Data from the Ghana Health
Service indicate that six (6) out of the top ten (10) diseases in Ghana are related to poor
environmental sanitation, with malaria, diarrhea and typhoid fever jointly constituting 70%-
85% of out-patient cases at health facilities (MLGRD, 2010a).
Launching a National Campaign against Malaria in 2005, a Deputy Minister of Health noted
that “malaria remains the number one killer in the country, accounting for 17,000 deaths,
including 2,000 pregnant women and 15,000 children below the age of five”, a quarter of all
Integrated Waste Management – Volume I
4
child mortality cases and 36% of all hospital admissions over the past 10 years” (Daily
Graphic, November 3, 2005: 11). The Ghana Medical Association also stipulates that about
five million children die annually from illnesses caused by the environment in which they
live (World Bank, 2007). In Kumasi, a DHMT Annual Report (2006) states that, “out of the
cholera cases reported to health facilities, 50% came from Aboabo and its environs (Subin
Sub-Metro) where solid waste management is perceived to be the worst”.
Poor waste management practice also places a heavy burden on the economy of the country.
In Accra, solid waste haulage alone costs the assembly GH¢ 450,000 (US$307,340) a month,
with an extra GH¢ 240,000 (US$163,910) spent to maintain dump sites (Oteng-Ababio,
2010a), while in Kumasi, an average of GH¢720,000 (US$491,730) a month is spent on waste
collection and disposal (KMA, 2010). The negative practice is also partly responsible for the
perennial flooding and the associated severe consequences in most urban areas. The June
2010 flooding in Accra and Tema for example claimed 14 lives and destroyed properties
worth millions of cedis (NADMO, 2011).
Admittedly, these tendencies are not exclusive to Ghanaian cities. Most urban centers in the
developing world are united by such undesirable environmental characteristics. In Africa, it
is anticipated that the worst (in terms of increasing waste generation and poor management
practices) is yet to be experienced in view of the high rate of urbanization on the continent.
By 2030, Africa is expected to have an urban population of over 50%, with an urban growth
rate of 3.4% (UNFPA, 2009). The fear has been heightened by the changing dynamics of
waste composition due partly to globalization and the peoples’ changing consumption
pattern. The increasing presence of non-biodegradable and hazardous waste types means
that safe collection, transportation and disposal are absolutely crucial for public health
sustainability.
The study examines how Accra, Tema and Kumasi, the most urbanized centers in Ghana,
are grappling with SWM challenges in the wake of the glaring need to improve urban waste
collection systems. It contributes to the menu from which practitioners can identify
appropriate, cost effective and sustainable strategies for efficient solid waste collection,
handling and disposal systems. Ultimately, the lessons learned from these experiences are
useful not only for future policy formulation and implementation but more importantly, for
other cities that are experimenting with private sector participation. Fobil et al (2008)
intimated that, “the key observable feature is that the collection, transportation, and disposal
of solid waste have moved from the control of local government authorities to the increased
involvement of the private sector.” It would be an understatement to say that understanding
both the successes and failures of a city that has shifted most of the responsibility for SWM
to the private sector is important for those planning to chart a similar course.
2. Study methodology
A variety of research methods were employed to achieve the objectives set. These included
primary data collected using structured questionnaires, which covered the consumers,
private providers of solid waste services, and local authorities in the three selected cities.
The study also included a detailed investigation and survey of several collection points
within each city. A detailed survey and investigation were performed to assess the current
situation of the solid waste collection system in each of the cities. Also, selected focus group
discussions were conducted with the executives of service providers, landlord associations
as well as the rank and file of service beneficiaries, especially in the low-income areas. Other
Governance Crisis or Attitudinal Challenges?
Generation, Collection, Storage and Transportation of Solid Waste in Ghana
5
secondary data sources were contacted, including some from the metropolitan assemblies,
private organizations, and other community-based organizations.
To analyze the waste composition within each city, the entire area was examined based on
their socio-economic characteristics (low, middle and high-income). A total of 25 houses in
each city were randomly selected based on the population in each segment. Each selected
house was provided with a 240-liter plastic waste bin, lined with a plastic bag. Residents
were then required to dump their waste into the bin. Refuse from each house was collected
twice a week, on Tuesdays and Thursdays, for eight weeks. The bags from each house were
given special identification numbers and then transported to a designated site for
segregation. A large clean plastic sheet was spread on the floor at the sorting site, and the
contents were manually separated and the waste stream analyzed. Each category of waste
for each house was weighed on a manual spring scale and recorded on a spreadsheet. The
component materials in the waste stream were classified as follows:
Organic (putrescible);
Plastics (rubber);
Textiles;
Paper (cardboard);
Metals and cans Glass.
The data was analyzed using a variety of tools and methods. Data collected from the
interviews, investigations, surveys, and field work were processed, reviewed, and edited.
The quantitative data were tabulated and relevant statistical tools and computer software
were employed for analyzing and interpreting the results. Personal judgments, expert
comments, and the results from the interviews and public survey were used as a basis for
the analysis and interpretation of the qualitative data. In general, the results from the
three locations— Accra, Tema and Kumasi— were virtually identical, therefore the
analyses and subsequent discussions were organized and restricted around the main
themes for the study area as a whole, with occasional references to a few exceptions for
purposes of emphasis.
3. Result and data analysis
3.1 Waste generation
For the purpose of establishing the optimum collection systems, it is imperative to know the
quantities and densities of the waste and where it is coming from. Generally, it is established
that population growth greatly contributes to an increase in waste production. It has also
been empirically established that waste generation has increased rapidly over the years. In
Accra, for example, the amount of solid waste generated per day was 750-800 tonnes in 1994
(Asomani-Boateng, 2007); 1,800 tons per day in 2004 (Anomanyo, 2004); 2000 tons per day in
2007 (AMA, 2010; Oteng-Ababio, 2010a) and in 2010, it is estimated to be 2,200 tons
(personal interview).
A dilemma relates to the amount of waste generated per person, which varies greatly with
income (Houber, 2010). According to Blight and Mbande (1998), an affluent community may
generate about 3 to 5 times as much waste per capita as a poor one. Boadi and Knitunen
(2003) estimate that residents in low, middle and high income areas generate 0.40, 0.68 and
0.62 kilograms per day, respectively. They however noted that the density of waste is higher
in low-income areas (0.50 per kilo liter) because their waste typically has a greater portion of
organic and inert (sand and dust) matter, while packed products and cans form a significant
Integrated Waste Management – Volume I
6
part of waste in high-income areas. Density of waste in high-income areas is estimated at 0.2
kilo per kilo liter while middle-income areas have 0.24 kilos per liter.
To date, there has not been any comprehensive empirical study on per capita waste
generation in Ghana as a whole. All figures currently in use are crude estimates given by
various authorities. Whilst the MLGRD, for example, gives the average daily waste
generation as 0.51kg per person, the Water Research Institute (WRI) puts it at 0.41kg (WRI,
2000). Be that as it may, both have ramifications for planning purposes. Using these figures
and the official as well as unofficial population of Accra for 2000, (i.e. 1.65 and 3 million,
respectively), for example, in calculating daily waste generation, different figures are
generated (i.e., between 841.5 and 1,530 tonnes based on MLGRD figures, and between 676.5
and 1,230 tonnes using the WRI figures). The disparities between these figures in a single
year are just too great for any meaningful comparisons, analysis and proper planning, as a
good statistical data is the link between good planning and good results. Despite the
discrepancy, the low-income areas, home to about 80% of the population undoubtedly
generate the bulk of solid waste in the study area.
3.2 Waste composition
One significant aspect of solid waste in the study area is the changing complexity in the
waste stream. Compared to the developed countries, wastes generated in the study area
(and in developing countries for that matter) contain large volumes of organic matter. Table
1 presents a comparative study by Asase et al (2009) on the waste stream in Kumasi, Ghana
and that in London in Ontario, Canada. The data show the clear difference between the
composition of waste in the two cities, with organic materials accounting for 63% of waste in
Kumasi but only 30% in London.
Source: Asase et al, 2009
Fig. 1. Comparison of waste streams in Kumasi (Ghana) and London (Canada)
Governance Crisis or Attitudinal Challenges?
Generation, Collection, Storage and Transportation of Solid Waste in Ghana
7
According to Blight and Mbande (1998), the rapidly changing composition of waste stream
in developing countries is a reflection of the dynamics of their culture, the per capita income
of the community and the developmental changes in consumption patterns (Doan, 1998).
Most residents have begun to make extensive use of both polythene bags and other plastic
packaging, which creates an entirely new category of waste. Commenting on the menace of
plastic waste in 2005, an Accra Mayor described it as “a social menace of a dinosaur,
constituting over 60% of the 1,800 tons of waste generated within the Metropolis daily”
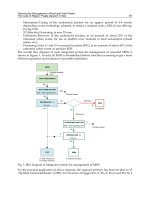
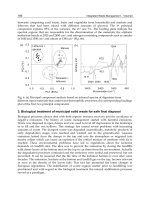
(Daily Graphic, 2005: 28). Figure 2 compares the waste composition in Accra and Tema from
1989-1999 and from 2000-2009. Figure 2 shows a reduction of organic waste content from
73% in 1989-1999 to 60% in 2000-2009 while plastic surged from 3% to 8% within the same
period. Also significant is the increasing miscellaneous category (which contains e-waste)
from 1% in the 1990
’
s to 4% in the 2010’s. The emergence of e-waste in the waste stream is
seen as an emerging challenge to waste management in Ghana (Oteng-Ababio, 2010b).
Source: Varying Composition of Solid Waste Stream, Greater Accra Metropolitan Area, Accra
Metropolitan Assembly (AMA) (2004) and Baseline Survey, MMDAs (2008) in the National
Environmental Sanitation Strategy and Action Plan (NESSAP), Ministry of Local Government and Rural
Development (MLGRD), 2010. Note that there is a discrepancy in the above figures. The data from the
period 1989-1999 adds up to 101% and not 100%. This data was taken directly from the source without
changing this figure.
Fig. 2. Dynamics of Waste Composition-Accra/Tema (1989-1999 and 2000-2009).
Results of waste composition analysis conducted during the study were also consistent with
the literature, with organic material (such as food, yard trimmings) being the most
prevalent, comprising about 67% of the waste generated in all the three research localities
(see Figure 3). Plastic material (such as plastic bottles and sachet bags) accounted for about
20%, while textiles accounted for about 5%. Figure 3 presents the percentage fractions of
each category of the waste stream in the study areas.
From figure 3, it is clear that organic waste dominates the sampled waste stream while
paper and plastic are the two other important constituents. The rest include glass, rubber,
leather, inert materials (dirt, bricks, stones, etc.), wood, cloth, and other materials. It is
estimated that the percentage contribution of most waste constituents will remain close to
Integrated Waste Management – Volume I
8
those of present years; however, there will be a dramatic change in plastic waste production
due to the increased use of plastic products among the Ghanaian populace, especially
people in the major cities. From the foregoing urban waste classifications, it is evident that
different categories of waste may require different handling, collection and disposal
strategies. The successful implementation of any SWM system is partly dependent on the
synergy between waste storage, loading and transportation. The compatibility between
these three elements of SWM systems ensures efficient and sustainable operations.
Generally, an appropriate waste storage facility must satisfy many requirements, including
convenience, size and durability.
Source: Field Survey, 2010.
Fig. 3. Percentage fractions of each category of the waste stream in the study areas
3.3 Waste storage practices
The research identified two major modes of storage for household solid waste in the study
area. The first involves the use of polythene bags, card board boxes, and old buckets, which
was quite prevalent in both the low and middle-income areas, and the standard plastic
containers in the high-income neighborhoods. It further revealed that the more improvised
(unorthodox) systems are used for waste storage, the more likely the area suffers poor SWM
practices. A critical analysis of the mode of solid waste storage in the various residential
areas within the study area buttresses this. The situation in Accra is presented in Table 1.
Table 1 shows the various waste storage facilities used in residential areas in Accra. Seventy-
four (82.2%) respondents in the high-income areas, where the house-to-house (HH) system
is prevalent, use the standard plastic containers. Only 16 (17.78%) of them used unorthodox
methods (polythene bags, old buckets, etc.). This is perhaps because waste in the high-
income areas is collected once or twice a week and therefore needs to be properly stored.
Alternatively, in the low-income areas where the communal container collection (CCC)
operates, 155 (73.81%) respondents used impoverished storage facilities. Indeed, waste in
such areas is stored for a very short period and residents can visit the container sites more
than once a day. A chi-square test, conducted on the mode of waste storage and the
residential location, gave a value of 105.579 at 6 degree of freedom (df). By inference, there is
Governance Crisis or Attitudinal Challenges?
Generation, Collection, Storage and Transportation of Solid Waste in Ghana
9
a highly significant relationship between the mode of waste storage and residential areas,
and by extension, the wealth of the area, and this is consistent with the literature (UN-
Habitat, 2010). This is also a function of the mode of waste disposal.
Classification
Std.
Containers
Polythene
Bags
Pile outside Others Total
Freq. % Freq. % Freq. % Freq. % Freq. %
Low Class 44 20.95 155 73.81 10 4.76 1 0.48 210 100
Medium
Class
91 45.5 93 46.5 13 6.5 3 1.5 200 100
High Class 74 82.22 16 17.78 0 0 0 0 90 100
Total 209 41.8 264 52 23 4.6 1 0.2 500 100
Source: Field Survey, 2010
Note: Chi-square value 105.579. Asyump. Sig. (2-Sided) 0.000 a. 4 cells (33.3%) were expected count less
than 5. The minimum expected count is 0.72.
Table 1. Mode of Solid Waste Storage by Residential Areas in AMA
Similar observations were made in Tema and Kumasi. However, unlike Accra and Kumasi,
100% and 65% of respondents in the high and middle-income areas of Tema, respectively,
used the standard plastic containers. This is primarily due to the planned nature of Tema.
Additionally, the authorities in Tema, through the Waste Management Department (WMD),
have been supplying plastic containers to residents at a fee, thus providing motivation and
impetus for the use of the standard containers. Consequently, littering in these areas is
relatively minimal and thus the city has a relatively clean environment.
It can also be inferred from the study that most residents in the low-income areas generally
lack the economic capabilities and will typically not willingly spend much money on waste
storage containers. This situation is more likely to occur under the container system where
children can send waste to the container site at least twice in a day. Indeed, because children
are mostly involved in waste disposal, residents are compelled to use lighter containers like
polythene bags, instead of the costly but ‘heavy’ standard containers, which are somewhat
incompatible with the prevailing institutional arrangement. Another observation, especially
in Kumasi, was that although some middle-income residents claim to be using standard
containers, practical observation revealed the use of improvised galvanized containers (see
Figure 4), possibly due to the higher cost of the former. A market survey of the prices of the
standard containers revealed that a 120-liter container (see Figure 4) which was GH ¢3.3 in
1995, cost GH ¢150 in 2010, an increase of about 4,445%, while a galvanized container was
selling at only GH ¢ 15.
The use of unapproved storage facilities and children in waste disposal, especially in the
low-income areas, presents its own problems, which the authorities seem to have glossed
over. For example, in most cases, children find it difficult to properly access the containers
because of their height. It thus becomes more convenient to throw waste on the ground
instead of dumping it in the refuse container. The situation is even worse in areas where
they are supposed to be assisted by caretakers for a fee, which is reminiscent of the “Pay-As-
You-Dump” (PAYD) system. Additionally, these unorthodox containers are constantly
subjected to ransacking by domestic animals to the detriment of the environment. This
Integrated Waste Management – Volume I
10
ultimately results in indiscriminate littering at the sites, with its attendant poor hygienic
conditions (see Figure 5). It is therefore not uncommon to see scattered waste bags being
loaded into the collection trucks with the help of shovels and rakes. This is a slow, laborious
and unhygienic system that results in poor vehicle utilization and low labour productivity.
Source: Field Survey, 2010
Fig. 4. Samples of standard and improvised waste receptacles.
Source: Field Survey, 2010.
Fig. 5. Indiscriminate dumping at a container site. (Note the high presence of plastics)
It was further observed that in the middle-income areas of Accra and Kumasi, some
residents in the informal sector, including mechanics, sawmill operators, car washing bays
and chop bar operators are virtually compelled to use unofficial dumping practices because
of the nature and volume of the waste they generate vis-à-vis the cost of disposing such
waste. In other words, the socio-economic characteristics in those neighborhoods make the
official services virtually inaccessible (cost prohibitive) to these residents, thus buttressing
Governance Crisis or Attitudinal Challenges?
Generation, Collection, Storage and Transportation of Solid Waste in Ghana
11
the argument that social propinquity may be different from social accessibility (Phillips,
1981; 1984).
3.4 Waste collection
For any sustainable waste management system, the collection system must be designed and
operated in an integrated way. In particular, the method of loading a collection truck must
suit the mode of storing waste. If the waste is destined for recycling, then it should be
designed to ensure minimum contamination. It is also important to ensure that, if waste is to
be deposited in a landfill, then the trucks in operation should be appropriate for landfill
manoeuvring. Generally, the waste collection rate in most African cities has been typically
low (see Table 2), ranging from 40-50% (Mwesigye et al, 2009). However, available data in
the study area indicate that there has been a significant increase in total waste collection
with the introduction of the private sector. Accra, for example, is currently said to have
attained a collection rate of 70% (AMA, 2009; Oteng- Ababio, 2010a) or 80% (Huober, 2010).
The remaining 20-30% uncollected waste is either burned or buried or dumped
indiscriminately (MLGRD, 2010b).
Population Growth (%) % of solid waste collected
Abidjan (Cote D’Ivore) 2,777,000 3.98 30-40
Dakar (Senegal) 1,708,000 3.93 30-40
Ndjamena (Chad) 800,000 5.00 15-20
Nairobi (Kenya) 2,312,000 4.14 30-45
Nouakchott (Mauritania) 611,883 3.75 20-30
Lome (Togo) 1,000,000 6.50 42.1
Yaoundé (Cameroon) 1,720,000 6.80 43
De res Salam (Tanzania) 2,500,000 4.30 48
Source: Sotamenou 2005 for Yaoundé; Rotich et al 2006 for Nairobi; Benrabia 2003 and Bernard 2002 for
Dakar and Abidjan; EAMAU 2002 for Lomé; Doublier 2003 for Ndjamena; Ould Tourad et al 2003 and
Pizzorno Environnement for Nouakchott; and Kassim 2006 and the International Development
Research Centre for Dar es Salaam in Parrot et al 2009 (cited in Houber, 2010).
Table 2. Cross-country analysis of population, growth and solid waste collected
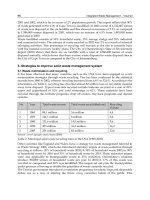
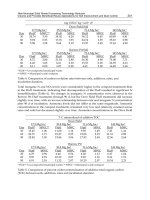
Table 3 presents the trend of total volume of waste collected between 2002 and 2008 in
Accra. The data indicate an overall progressive improvement in the collection rate from
476,281.92 in 2002 to 658,044.06 in 2008, an increase of about 38%. What remains debatable is
whether such increase has translated into quality service delivery. One would have expected
much improved sanitation, especially in low-income areas, yet ironically, the opposite
pertains. Those areas continue to be engulfed in filth and this seems to give credence to the
perception that some WMD officials collaborate with some private service providers to
cheat the assemblies. The data however shows a steady decline in the volume of waste
collected between 2002 and 2004. The situation could be attributed to the tardy payments
Integrated Waste Management – Volume I
12
from the authorities, which was worsened by the sharp increase in fuel prices and other
operational costs at the time.
Year Waste
Generated
Waste
collected
Waste
uncontrolled
%
collected
Private
contractors
shares
2002
675,000.00 476,281.92 198,718.08 70.56 N/A*
2003
657,000.00 419,671.30 237,328.70 63.88 N/A*
2004
657,000.00 424,802.42 232,197.58 64.66 96.28
2005
657,000.00 512,030.95 144,964.05 77.93 98.46
2006
657,000.00 639,854.69 17,145.31 97.39 98.06
2007
730,000.00 604,756.43 125,243.57 82.84 99.73
2008
730,000.00 658,044.06 71,955.94 90.14 99.94
Source: AMA/WMD, 2009. * N/A means data was not available at the time of the study.
Table 3. Waste Generation and Collection in Accra (2002-2008)
The study reveals that waste collection services within the study areas are provided by one
of two means: the house-to house (HH) and the communal container collection (CCC)
systems. The HH system is designed to serve low-density, medium and high-income areas
that have easy access and identifiable houses. With this system, private waste collectors are
expected to pick up waste from private homes, expectedly with compact trucks, for
dumping. The CCC, on the other hand, is designed to serve high-density, low and middle-
income areas that are more difficult to access by road. Under this system, residents are
expected to carry their waste free of charge to a communal container that is later emptied by
a collection truck. The assembly is expected to pay the private waste collector GH ¢10 per
every ton of waste sent to the dump site. Table 4 presents a brief discussion on the
characteristics of the two institutional arrangements.
The study revealed that because the low-income areas offer fewer opportunities for profit
(due partly to the tardy payment of the assemblies) compared to the high-income areas
where service providers have the privilege of negotiating directly with service beneficiaries,
the former generally receive the lowest priority from the service providers. There is also
enough evidence to suggest that the communal containers provided by the authorities are
frequently inadequate in terms of their volumes and the population threshold they are
expected to serve. This happens in situations where un-emptied or overflowing communal
containers have become common sights in such areas, constituting both a nuisance and
health hazards. The situation has worsened due to the high organic and moisture content of
the waste as well as the generally high temperatures which facilitate rapid decomposition,
coupled with the fact that waste in those areas is often mixed with human waste due to
inadequate sanitation facilities. The problem of inadequate facilities does not only lead to
indiscriminate dumping of waste, but also to strong foul smells emanating from the waste,
both of which compromise the health needs of residents.
Governance Crisis or Attitudinal Challenges?
Generation, Collection, Storage and Transportation of Solid Waste in Ghana
13
The limited refuse containers compel residents to travel long distances to access the few in
circulation. During the study, only 10% and 8% of respondents from the low-income areas in
Accra and Tema, respectively, indicated they traveled within a 50 meter radius to waste
container sites to dispose of their waste. The rest have to travel beyond the 50 meter mark
up to over 200 meters to assess a container. The situation appears worse in Kumasi where
about 50% of residents in Aboabo (low-income area) had to travel over 150 meters to the
nearest refuse receptacle. This has a negative impact on solid waste disposal as most
residents have the tendency of finding other convenient places to dispose of their waste,
places which are normally very close to where they live.
Variables House-to-house
collection
Collective container
collection
Standard collection frequency At least Weekly Daily
Dominant waste storage
container
Standard Plastic bins Old buckets
Polythene bags
Mode of transporting solid
waste
Multi-lift truck
Skip-loader
Open truck
Three-wheeled tractor
Pushcart
Mode of lifting waste
bins/containers
Multi-lift trucks Skip-loader
Main areas of operation High income Low income
Middle income Middle income
Characteristics of areas Good road-network Poor road network
Excellent accessibility
to houses
Poor accessibility to houses
User fees Yes No
Service provided by Private sector Local authority/Private
sector
Private contractor pay dumping
fees to AMA
Yes No
Source: Field Survey, 2010
Table 4. Major Characteristics of the Institutional Arrangements in the study area
Many reasons might have accounted for this development. For example, it was established
that some residents have encroached on the container sites, while the inability of the
authorities to regularly pay the collection companies adversely affects the rate at which the
containers are emptied. Consequently, some residents who cannot stand the filth and the
attendant stench vehemently protest and resist the continuous location of the containers at
those sites. During the survey period, there were instances where some residents of Abossey
Okai, for example, physically attacked the workers of Golden Falcon Company (a private
waste collection company) for attempting to place a container at a particular spot.
Integrated Waste Management – Volume I
14
3.4.1 Distance-decay and the use of refuse containers
Attempts were also made to ascertain how far residents are prepared to travel to access a
refuse container. In Accra, 124 (50%) respondents in low-incomes areas indicated their
willingness to access communal containers within a 50 meter radius while only 13 (5%) are
prepared to travel about 200 meters for the same purpose (see Figure 6). The situation was
not different from the responses from Kumasi, though fewer people (only 3.7%) were
prepared to travel beyond the 50 meter radius. This is due to the drudgery and opportunity
cost associated with commuting long distances daily to the container site. By inference, the
longer the distance, the more people are likely to abuse the system, thereby legitimizing the
principles enshrined in the distance-decay theory. The long distances and the fact that in
most instances the containers will be over-flowing on arrival, serve as deterrents to residents
who then use any available open space as an alternative dumping site. From the foregoing,
it can be deduced that, there is a maximum travel threshold within which residents will
voluntarily access the communal container. Once this is exceeded, utilization tends to fall
considerably. This negative relationship observed is reinforced empirically by the very little
littering in areas serviced by HH operators, where wastes are virtually collected at the
doorsteps of residents, as against the container system where residents have to travel long
distances and unsightly scenes have become the bane of the society, as is the case in Nima in
Accra, Ashaiman in Tema and Aboabo in Kumasi.
Source: Field Survey, 2010
Fig. 6. Distance-Decay in residents’ willingness to access the nearest refuse container
3.4.2 The role of the informal sector in waste collection
The study revealed the use of the services of Kaya Bola
1
in the waste collection system,
especially in Accra and Tema. In Accra, such activities are confined to the middle and high-
income areas while in Tema, it is predominantly in the low-income areas. The fact is that in
Tema, the middle and high-income areas are well planned and therefore facilitate the HH
operation, which is generally seen as quite efficient and acceptable. On the other hand, the
1
Kaya Bolas or Truck Boys are porters who carry solid waste from residences, markets and offices in
sacks, baskets, on trucks, etc to a container or dumping sites for a fee.
Governance Crisis or Attitudinal Challenges?
Generation, Collection, Storage and Transportation of Solid Waste in Ghana
15
middle-income areas in Accra and Kumasi did not have that advantage. Some residents are
thus compelled to complement their official “unsatisfactory” services with those of Kaya
bola.
The middle-income areas of Abossey Okai, Adabraka and Kaneshie in Accra, for example,
are officially supposed to be serviced under the container system. However, the study
revealed about 25% of respondents in each of these neighborhoods use the services of Kaya
Bola. This has been necessitated by the fact that these areas have essentially become part of
the commercial hub of Accra and presumably, contain some modestly rich residents.
Consequently, because of their commercial interests and wealth, they can afford the services
of Kaya Bola as a trade-off for the apparent inefficiency of the formal institutional
arrangements. The service was quite noticeable in the low-income areas where, due to its
peculiar infrastructural challenges, the official HH system is rendered technically
impossible. In such circumstances, the few affluent people rely on the services of the Kaya
bola to meet their environmental needs.
Be that as it may, the activities of the Kaya Bola cannot be a panacea to the solid waste
menace confronting the city authorities. Indeed, their present modus operandi actually
contribute to the creation of filth, especially around the container sites, the reason being that
their activities are unofficial and therefore are not properly integrated into the overall SWM
system.
They also do not have the mechanism to off-load their collected waste into the already over-
flowing containers. In the process, they litter the sites or find other means to dispose of the
collected refuse which, in most cases, is inimical to environmental and societal health. The
city authorities should therefore make attempts to incorporate these activities into other
CBO operations or harness them to formally provide HH services to the official operators of
the CCC. The idea should not be to roll them into the tax bracket but to structure their
activities and let them provide checks on their colleagues.
3.5 Technology for solid waste collection
All things being equal, the mode of waste storage and disposal influences the technology
used for collection (Obiri-Opareh, 2003). Generally, the result of this study confirms this
observation, though it also reveals that some service providers in all the cities use
unorthodox technology to execute their contracts. Among the reasons assigned for this
development is the authorities’ inability to adequately resource them (private contractors) or
make prompt payments for services provided. Under the current HH system, contractors
use multi-lift trucks, open trucks, three-wheeled tractors and power tillers. In the CCC
system, however, skip-loaders were very predominant because of the use of central
containers.
By inference, there is a correlation between the type of technology used and the material
wealth as well as the layout of an area. It was however observed that most of the available
trucks often showed signs of heavy wear with a limited useful economic life. Even the
number of these trucks in circulation vis-à-vis the job at hand was very limited. Most of the
trucks had also broken down and were stripped of spare parts due to the difficulty and cost
in buying new parts (see Figure 7).
Interactions with some private contractors, including Golden Falcon and ABC Waste,
revealed that most of the supposed faulty trucks only needed a part to be operational.
However, because of the irregular payment from the authorities and the fact that many of
the parts are not locally accessible, many of the companies overlooked them and put in