Environmental Management in Practice Part 3 pot
Bạn đang xem bản rút gọn của tài liệu. Xem và tải ngay bản đầy đủ của tài liệu tại đây (478.45 KB, 30 trang )
Community Ecology and Capacity: Advancing
Environmental Communication Strategies among Diverse Stakeholders
51
Management, Inc., of Houston, Texas owns Wheelabrator Technologies, Inc. which
operates several waste-to-energy facilities across the United States. Wheelabrator
operates two such municipal solid waste incinerators in Claremont, New Hampshire
(NH) and Concord, NH, respectively. The Claremont, NH facility began operation in 1987
and provides disposal of up to 200 tons of municipal solid waste daily for approximately
70,000 people. This facility can provide electricity to 5,600 homes. The Concord, NH
facility began operation in 1989 and provides disposal of up to 500 tons of municipal solid
waste daily for approximately 150,000 people. This facility can provide electricity to
17,000 homes (Wheelabrator, 2010).
These facilities use the same waste-to-energy method and are considered Title V operating
facilities by the New Hampshire Department of Environmental Services (NHDES). The
purpose of the Title V permitting process is to ensure that facilities will not emit hazardous
pollutants to a degree which could negatively affect human health. Specifically, facilities
which emit over 100 tons of any regulated pollutant, such as carbon monoxide and sulfur
oxides; emit over 50 tons of nitrous oxides; or emit 10 tons of any of the federally regulated
hazardous air pollutants need to apply to the state environmental agency for a Title V
permit (ARD, 2008).
As required by current NHDES permits, the Wheelabrator sites continuously monitor
carbon monoxide, sulfur dioxide, particulate matter, as well as other emission indicators
such as steam flow and temperature. All monitoring and operational information are
maintained in facility records, in accordance with state and federal requirements.
“[NH]DES oversees and witnesses the performance of annual relative accuracy tests and
audits facility records in order to ensure the accuracy of Wheelabrator’s continuous
emissions monitoring system. [NH]DES also conducts full Compliance Evaluations at least
every two years, witnesses annual compliance stack tests and reviews resultant stack test
reports for accuracy” (ATSDR, 2009).
6.1 Two communities: home to the same environmental policy
The demographics of the Claremont and Concord New Hampshire communities are similar
with respect to age and sex. Both communities are also classified as cities. However, the
demographic information for education, economic and housing characteristics are different.
Table 4 outlines selected demographic characteristics of these two communities.
Briefly, Claremont is a city in the western part of New Hampshire with a population of
12,968. It is situated along the Connecticut River in Sullivan County. It is the largest
incorporated community in Sullivan County and ranks 22
nd
in population size among cities
and towns in New Hampshire. The majority of the population (97.7%) is White and 78.7%
of the population 25 years of age and older have completed high school while 12.8% have a
Bachelor’s degree. The median household income in 1999 was $34,949 and the median value
of a single-family owner-occupied home was $79,800 (Census, 2010).
Concord is the state capital with a population of 42,255. It is situated along the Merrimack
River in Merrimack County and ranks 3
rd
in population size among cities and town in New
Hampshire. The majority of the population (95.5%) is White and 88.6% of the population 25
years of age and older have completed high school while 30.7% have a Bachelor’s degree.
The median household income in 1999 was $42,447 and the median value of a single-family
owner-occupied home was $112,300 (Census, 2010).
Environmental Management in Practice
52
6.2 Stakeholders in environmental communication
The stakeholders considered in this work include a state environmental agency, community
activists living near the facilities and the general public. Specifically, the New Hampshire
Department of Environmental Services, Air Resources Division (NHDES ARD) is
responsible for monitoring and regulating air quality that is protective of public health and
the natural environment in the State of New Hampshire (ARD, 2010). NHDES ARD
accomplishes this goal via numerous programs including a statewide permitting program to
assure compliance with the Title V federal mandate (ARD, 2008).
Citizens Leading for Environmental Action and Responsibility (CLEAR) is a community
activist group that is primarily comprised of Claremont, NH residents. The mission of
CLEAR is to “…respect and value the people, the environment, the public health, the
political process, and the economics of our community and region;…encourage public
participation in the decision-making process to promote the principles of environmental,
political, social, and economic health;…commit to an organizational framework that is non-
profit, open, democratic, and accountable” (CLEAR, 2010). The general public living or
spending time in the communities that house these Title V operating facilities represents the
final stakeholder group. Figure 7 represents photographs of the industry examined.
Claremont, NH Concord, NH
Total population
2
12,968 42,255
Race: White 97.7% 95.5%
High school graduate 78.7% 88.6%
Bachelor’s degree 12.8% 30.7%
Median household income
3
$34,949 $42,447
Median value of a single-
family owner-occupied home
$79,800 $112,300
Table 4. Demographic characteristics of two communities that host a waste-to-energy
facility
4
.
2
Population estimate for 2008, U.S. Census Bureau, Population Finder. (
3
Median household income for 1999, U.S. Census Bureau, Population Finder. (
Community Ecology and Capacity: Advancing
Environmental Communication Strategies among Diverse Stakeholders
53
Fig. 7. A and B. Wheelabrator Technologies, Inc. in Claremont and Concord, NH,
respectively.
Source: />plants/waste-to-energy-plants/wheelabrator-claremont-company-lp/
7. Methods
7.1 Survey instrument
Following Institutional Review Board approval from the University of New Hampshire, a
cross-sectional study design was utilized to examine the sources, believability and utility of
information and perceptions about environmental health issues among a relevant sample of
residents and visitors of the two study communities. Self-report questionnaires utilizing a
4-point Likert scale and multiple choice questions were administered over a five month
period at different times and locations (e.g., retail locations and churches of various
denominations) in each community. These anonymous surveys were immediately collected
from the participants upon completion. Alternatively, participants could choose to mail
their completed survey to the University of New Hampshire via self-addressed and
stamped envelopes.
All questionnaires had a cover letter attached that explained the purpose of the study and
emphasized the anonymity and confidentiality of the results. Participants were told to keep
this letter for their records. There were no incentives for participating in this study. Additional
open-ended comments from participants were recorded at the end of the survey.
The 19-item questionnaire was designed to determine demographic information, self-reported
knowledge about sources and believability of information and perceptions about
environmental health issues in the community. Revisions were made during the pilot testing
phase of the questionnaire. Ambiguities associated with the survey content were not
identified during test trials that were conducted prior to official questionnaire administration.
The survey questions were organized into four sections. First, respondents were asked for
demographic information (e.g., length of residence in the community, education level, annual
income) and questions pertaining to their interest and level of participation in community
issues. Respondents were then asked how often they think about their physical environment
4
Source: U.S. Census Bureau. Population Finder. (
Environmental Management in Practice
54
and to choose what environmental health issue in their community concerned them the most
from the following list: water quality, land conservation, air pollution, food security and
other. This question was followed by an inquiry regarding whether the respondents thought
they were well-informed about environmental health issues in their community. Next,
respondents were asked to indicate where they would rank their environmental issue of
interest relative to other issues (e.g., property taxes) affecting their local community.
In order to determine sources of environmental health information, respondents were asked
to choose from the following sources in the next section of the survey: federal agencies (e.g.,
Environmental Protection Agency, Agency of Toxic Substances and Disease Registry); state
agencies (e.g., New Hampshire Department of Environmental Services, New Hampshire
Department of Health and Human Services); local government (e.g., city councilor or
Mayor); environmental groups (e.g., Greenpeace); academia (university presentations,
studies, peer-reviewed literature); media sources (e.g., newspaper, television, radio,
Internet); other. Respondents were instructed to circle all that applied to them. Respondents
were then asked to rate their believability of the above-mentioned sources of information.
Next, in order to determine which media sources were the most useful, respondents were
asked to choose from the following sources: television programs, print resources (e.g.,
pamphlets), newspaper articles or editorials, community meetings, informational websites.
The third series of questions pertained to the respondent’s attitude about public meetings.
Respondents were asked if they had ever attended a public meeting and whether they
believed public meetings were an effective means to communicate environmental health
information. Next, respondents were asked if they believed whether their opinion, if voiced
at a public meeting, would be taken seriously by officials.
Finally, the last series of survey questions inquired whether or not the respondents believed
the status of their personal health is related to the condition of the environment.
Respondents were specifically asked if they were familiar with trash incineration and
whether or not they believed it to be an effective form of waste disposal.
All data were analyzed using the Statistical Package for Social Sciences. Descriptive analyses
were done for each of the participant responses by determining frequencies and
proportions. Comparisons of responses were made across both communities by utilizing
the chi-square statistic, cross tabulations and independent sample t-tests to assess the
statistical significance of these comparisons. For statistical tests, P-values less than 0.05 were
considered to be statistically significant. Unknowns were accounted for in all variables.
7.2 Structured interview instrument
Structured interviews were conducted, following Institutional Review Board approval from
the University of New Hampshire, with DES employees involved in Title V permitting and
environmental health investigations and community activists from CLEAR to examine the
experiences that shaped both parties’ perceptions of current environmental communication
methods.
Participants were asked semi-structured, open-ended questions about the public’s
perception of their work, whether the facilities’ operations were considered to be
contentious or non-contentious and the health and environmental concerns regarding the
facilities. Participants were asked if they had experience conducting and/or attending a
public hearing about the facility. Information pertaining to the type and number of
concerns communicated by the public was collected, as well as how these issues were
addressed. With respect to the environmental management of concerns, NHDES was
Community Ecology and Capacity: Advancing
Environmental Communication Strategies among Diverse Stakeholders
55
queried as to whether or not they believed they were proactive in involving the community
and if they employed a professional who was responsible for handling the public’s concerns.
CLEAR was queried as to their perception in regards of their inclusion, by NHDES, in health
investigations concerning the facility and communication efforts from NHDES. The last series
of questions posed to the participants inquired about whether they thought improving
environmental communication among all stakeholders would enhance working relationships;
the usefulness of having an appointed community liaison to assist with environmental
communication; and what specific recommendations they have to improve the environmental
communication among stakeholders. The interviews were transcribed and a content analysis,
using QSR NVivo (a computer-assisted qualitative data analysis program), was conducted of
the structured interview responses to extract and code recurring themes.
8. Results
8.1 Two communities: sources, believability and utility of information and perceptions
about environmental health issues
One hundred and nine of 250 surveys (44% response rate) were completed and returned by
community members and/or visitors to the Claremont and Concord, NH communities. Of
the completed 109 surveys, 54 were from the Claremont community and 55 were from the
Concord community.
As shown in Table 5, survey results indicate statistically significant differences between the
Claremont, NH and Concord, NH survey respondents with respect to demographic
Claremont,
NH
Concord,
NH
P-value
College education 53.0% 92.2% 0.000
Annual income $25,000 or greater 55.5% 98.2% 0.000
Lived in the community for ten years or more 51.9% 76.4% 0.008
Active in community issues 42.6% 65.5% 0.017
Ranked the priority of environmental issues higher than
other community issues (e.g., property taxes)
38.5% 64.2% 0.008
Familiar with trash incineration as
a waste disposal method
75.5% 92.6% 0.015
Table 5. Demographic characteristics of two communities and survey respondents’ interest
in environmental health issues in their community that hosts a waste-to-energy facility.
characteristics and involvement in environmental health issues. For example, Concord, NH
respondents reported higher annual incomes of $25,000 or more (98.2%) compared to
Claremont, NH respondents (55.5%). In terms of education level, more Concord, NH
respondents completed college education (92.2%) compared to Claremont, NH respondents
(53.0%). In addition, Concord, NH respondents were more likely to have lived in their
Environmental Management in Practice
56
community for more than ten years (76.4%) compared to Claremont, NH respondents
(51.9%). Concord, NH respondents were also identified as being more active in community
issues (65.5%) compared to Claremont, NH respondents (42.6%). Furthermore, 64.2% of
Concord, NH respondents ranked the priority of environmental health issues higher than
other community issues (e.g., property taxes) compared to 38.5% of Claremont, NH
respondents. Lastly, 92.6% of Concord, NH respondents and 75.5% of Claremont, NH
respondents were familiar with trash incineration as a waste disposal effort.
As shown in Table 6, survey results demonstrate statistically significant differences and
similarities between these two communities with respect to information sources,
believability and usefulness. For instance, Concord, NH respondents were more likely to
not only obtain information from state agencies (61.1%), but they were also more likely to
believe it (67.3%) compared to Claremont, NH respondents. Also, Concord, NH respondents
were more likely to obtain information from environmental groups (50.0%) compared to
Claremont, NH respondents (18.5%). Interestingly, both Concord, NH (92.6%) and
Claremont, NH (79.6%) respondents were very likely to obtain information from media
sources such as newspapers, television, radio and the Internet. However, Claremont, NH
respondents were more likely to believe media sources (46.0%) and use (56.6%) the
information from the television compared to Concord, NH respondents. Yet, respondents
from both the Concord, NH (55.6%) and the Claremont, NH (66.0%) communities reported
newspapers to be the most useful source of information.
In terms of having attended public meetings in the past and their effectiveness, both
communities were similar in their responses. For example, respondents in the Concord, NH
(70.9%) and Claremont, NH (56.6%) communities reported that they had attended a public
meeting in the past. Respondents from Concord, NH (52.7%) and Claremont, NH (64.3%)
reported that they found such a venue useful for communicating environmental health
information. However, respondents from Concord, NH (31.5%) and Claremont, NH (24.5%)
reported that if they voiced their opinion in a public meeting, they believed that their
comments would not be taken seriously by officials in attendance.
Furthermore, respondents from Concord, NH (63.6%) and Claremont, NH (58.5%) believed
that the condition of the environment plays a role in their personal health. Respondents
from Concord, NH (92.6%) and Claremont, NH (75.5%) reported that they were familiar
with trash incineration but these same respondents did not believe it was an effective means
of waste disposal (58.0% and 61.4%, respectively.)
Cross-tabulation analyses indicated several statistically significant relationships (Table 7).
For example, respondents with a college education were more likely to use environmental
groups (43.4%) and the Internet (43.4%) as a source of environmental health information
compared to respondents without a college education. Respondents who did not have a
college education reported television (70.8%) as a useful media source for communicating
environmental health information. In addition, respondents with a college education were
more likely to report ever having attended a public meeting (70.2%), as well as being
familiar with trash incineration as a disposal method (89.2%). Similarly, respondents who
reported being more active in community issues were also more likely to report ever having
attended a public meeting (81.0%), as well as being familiar with trash incineration as a
disposal method (91.4%). Lastly, there were also significant relationships identified between
living in the community for ten years or more and being well informed about community
issues (62.3%).
Community Ecology and Capacity: Advancing
Environmental Communication Strategies among Diverse Stakeholders
57
Claremont, NH Concord, NH P-value
Sources of
environmental health
information
State Agencies 24.1% 61.1% 0.000
Environmental
Groups
18.5% 50.0% 0.001
Media Sources 79.6% 92.6% 0.051
Believability of sources
of environmental health
information
State Agencies
42.3% 67.3% 0.030
Media Sources 46.0% 28.3% 0.042
Useful media sources
for obtaining
environmental health
information
Television 56.6% 18.5% 0.000
Newspapers 66.0% 55.6% 0.267
Table 6. Survey respondents’ sources, believability and usefulness of environmental health
information from two communities that host a waste-to-energy facility.
Environmental Management in Practice
58
Level of Education No College Education
College Education P-value
Environmental groups
as source of
environmental
information
4.0% 43.4% 0.000
Television as useful
media source for
obtainin
g
environmental
information
70.8% 27.7% 0.000
Internet as useful media
source for obtaining
environmental
information
20.8% 43.4% 0.045
Ever attended a public
meeting
41.7% 70.2% 0.010
Familiar with trash
incineration as a waste
disposal method
66.7% 89.2% 0.008
Involvement in
Community Issues
Less Active More Active P-value
Ever attended a public
meeting
44.0% 81.0% 0.000
Familiar with trash
incineration as a waste
disposal method
75.5% 91.4% 0.025
Length of time lived in
community
Less than Ten Years More than Ten Years
P-value
Active in community
issues
38.5% 62.9% 0.014
Well-informed about
environmental health
issues in the community
39.5% 62.3% 0.023
Table 7. Demographic characteristics and survey respondents’ practices about
environmental health information and issues from two communities that host a waste-to-
energy facility.
Community Ecology and Capacity: Advancing
Environmental Communication Strategies among Diverse Stakeholders
59
8.2 State agency and community activists as stakeholders: perception of
environmental communication
Twelve individual structured interviews with NHDES employees involved in Title V
permitting and environmental health investigations and community activists from CLEAR
were conducted to examine the experiences that shaped their perception of current
environmental communication methods.
Through structured interviews with NHDES and a review of publicly available documents
(e.g., phone records, e-mail and written correspondence and public hearing recordings)
housed at NHDES, it was determined that the public inquiries concerning the Wheelabrator
companies were mainly for the facility in Claremont, NH and not Concord, NH, even
though they have identical operations. The public inquiries were fielded by NHDES ARD
staff and/or the NHDES Complaint Manager. The concerns expressed ranged from health
issues (e.g., cancer, respiratory illness) to nuisance complaints (e.g., odor, noise) to
environmental issues (e.g., poor air and water quality), all of which were perceived to be
due to the operation of the incinerator. The actions most often requested by the public for
the Claremont, NH facility included air and water quality testing, compliance evaluations
with state and federal emission standards and communication from the facility with the
affected community. In some instances, the community members called for the closure of
the facility. Distrust of NHDES and/or the facility was expressed in the public documents.
Structured interviews with community activists (n=7) demonstrated that they “feel there is
more that should be done regarding this issue (waste-to-energy).” All interviewees
discussed this theme in their individual interviews. The activists recommended that state
government should further restrict trash incineration. Several interviewees discussed the
recent ban on construction and demolition material incineration and pointed out that if this
material is outlawed, everything should be banned.
Another theme that emerged was the activists’ perception that the state agency pays
inadequate attention to the issue of waste incineration in their communities. The activists
are also very distrustful of state and industry involvement because many believe the
company that owns the two municipal waste incinerators of interest, discusses with NHDES
when random emissions testing will occur in advance so the incinerator will burn “cleaner
trash” on the testing days. They believe that this skews the data so any emission report
released by NHDES is not accurate.
When asked about efforts to improve environmental communication, community activists
had mixed reactions. The majority of activists reported that the state agency did a decent
job at communicating environmental health information. Beyond typical communication
venues, such as newspapers, Internet, and public meetings, activists were hard pressed to
suggest anything new. Several community activists mentioned that there was discussion
about creating a community panel to review environmental community issues. Decisions
regarding the environment (and the incinerator) would go to this panel for review. This
idea was met with opposition by the local government and never came to fruition.
Community activists were asked about the effectiveness of having a community liaison
located in their community. This individual would gather concerns and questions from the
community, relay those concerns and questions to the appropriate state agency and then
disseminate information back to the community. Unanimous support among the activists
for such a position of this nature was expressed.
Interviews with NHDES regulators and investigators (n=5) revealed their belief that
community activists do not acknowledge the state’s effort to respond to their concerns. On
Environmental Management in Practice
60
multiple occasions, requests made by community activists were explored, such as the
concern that the Claremont, NH facility was responsible for excessive cancer in that
community. As a result, NHDES, in conjunction with the Agency for Toxic Substances and
Disease Registry, conducted a community health investigation and analyzed twenty-four
major cancer types from 1987-2001. It was determined, from the available data, the cancer
rates for the specific types of cancer analyzed were within the expected range (ATSDR,
2006). This was a time-consuming endeavor and utilized many staff and budgetary
resources. When results were presented to the community, activists were not pleased with
the findings and discredited the initiative. The activists argued that the community health
investigation was not done in a way that was inclusive of the community, and that the
analysis was unacceptable and the results were inaccurate. As a result, state regulators
believed that there was not much that could be done to remedy community activists
concerns short of closing the Claremont, NH facility.
Another major theme expressed by NHDES involved community activists’ communication
with their organization. Direct questions and concerns were reported to be more effective
than emotional propaganda from activists. An example expressed multiple times in
NHDES interviews was that there were “two types of community activists.” There are the
community activists that send emotional propaganda, such as hundreds of postcards with
dead fish on them to NHDES claiming that the mercury emitted from the Claremont, NH
facility is killing all the fish. Other types of emotional propaganda that have been used by
this reported “type” of activist include the mailing of pictures of residents who have died
from cancer with messages explaining that the negligence of NHDES to shut down the
facility was the direct cause of their death. In contrast, the “other type” of community
activist sends specific questions and concerns that NHDES can investigate and reply with
factual data. This type of communication was preferred and was believed to be more
effective.
NHDES regulators and investigators were asked if it would be effective to have a
community liaison position in New Hampshire communities where a contentious
relationship exists between a community and an industry within the community. The
responses were mixed about whether an appointed community liaison would help improve
environmental communication. NHDES stated “This depends on who they are affiliated
with…If there was a person in this position, it would be helpful if each stakeholder had trust
in this person. However, how this trust is built is unclear. It is quite possible that this
person could be another barrier in the communication process and act as another layer of
litigation.”
9. Managing perceived health risks from a single-owner waste-to-snergy
facility in two distinct communities: discussion
An ongoing, practical challenge for state agencies involved in investigating community
concerns related to an industrial process perceived to impact the environment and human
health is how to most effectively communicate with the community as a key stakeholder.
We propose that investigators and regulators need to be able to 1.) identify the
community’s ecology, that is the community’s social, cultural, economic and political
composition and 2.) understand the community’s ecology to engage in effective
environmental communication. State agencies frequently describe communities as groups
of people living within a certain area, while communities may describe themselves on a
Community Ecology and Capacity: Advancing
Environmental Communication Strategies among Diverse Stakeholders
61
more detailed level, such as by their socioeconomic status, religious beliefs, race/ethnicity,
etc. (Parkin, 2004). We present the relationships between the demographic characteristics of
two communities that host an identical waste-to-energy facility owned by the same parent
company, and various communicative structures, such as the sources, believability and
utility of environmental health information accessed by these populations, as well as their
level of knowledge about trash incineration, the industrial process of concern. We
demonstrate that disparate populations that host a similar industry access and believe
different sources of environmental health information rank the priority of environmental
health issues compared to community health issues differently and have different levels of
activity on community issues. Our work suggests that ecological and demographic
differences in communities need to be assessed, in order to identify the multidimensional
components of the communities’ risk perception and to be able to determine the most
effective means by which to communicate environmental information.
Interestingly, a review of publicly available documents and structured interviews with
community activists and agency stakeholders determined that although two NH
communities host an identical municipal waste incinerator, the Claremont community,
compared to the Concord community, was more vociferous in regards to their perception
that the facility was a risk to the health of the population and their environment. In
addition, the Claremont community was hesitant to believe the results of a health
consultation and public health assessment conducted by NHDES and the federal Agency of
Toxic Substances and Disease Registry that determined “…the Claremont area was in
compliance with all National Ambient Air Quality Standards…” for the following criteria
pollutants: sulfur dioxide, particulate matter less than 2.5 microns in diameter, ozone and
nitrogen dioxide; and that “…cancer rates for 24 major cancer types were all within their
expected ranges…” over the fifteen-year period studied (ATSDR, 2006; ATSDR, 2009). We
suggest that demographic differences may contribute to the dissimilarity in risk perception
of two communities for this industrial process, however, it is not the sole factor. We
propose that effective and proactive environmental communicative structures that take into
consideration the community’s ecology among all stakeholders in all types of communities with
a regulated industry is essential when addressing perceived health risks to the environment
and population. Such practices could result in improved relationships with communities
and public perception and expectations of community health investigations.
10. Recommendations for practitioners
Both case studies utilized the cultural-experiential model of risk, which requests information
regarding the experience and views of impacted populations and their assessment of risk
(Cox, 2006). We propose that part of effective environmental communication on the part of
practitioners involves not only understanding the community’s ecology but also the
importance of engaging the public sphere to help build the community’s capacity to address
the environmental health issue of concern. Cox (2006) defines the public sphere as “The
realm of influence created when individuals engage others in communication – through
conversation, argument, debate, questions and nonverbal acts – about subjects of shared
concern of topics that affect a wider community.” The public sphere needs to be the
common ground to communicate misunderstandings, knowledge deficits and
environmental education. We utilized the cultural-experiential model to better understand
Environmental Management in Practice
62
the public sphere experienced by dissimilar communities that host different regulated
industries, and in one instance, an identical industry.
Based on our systematic examination of the environmental communication preferences and
practices among a state environmental agency, Title V operating facilities, community
activists and the general public concerning environmental permitting decisions perceived to
impact human health, we developed the below recommendations to facilitate best practices
in environmental communication:
1. Initiate communication early with the community: Proactive communication to potentially
affected communities by state agencies and neighboring facilities could facilitate the
relationship among stakeholders and serve as the foundation for next steps. This
recommendation arose from the experiences of two facilities which were completely
different in their public outreach practices. One was not proactive in involving the
community during the environmental permitting process and waited until the public
hearing to address the community and explain the intent of their facility’s operations. In
this case, the relationship between the facility and public was strained from the beginning of
the permitting process and the situation became the facility versus the public, instead of the
facility working with the public. In contrast, the other facility was proactive in involving the
community and held public information sessions prior to the public hearing to address the
community’s concerns.
2. Provide seminars to educate facility managers about public engagement: The state agency could
offer seminars designed to educate facility managers on public outreach practices prior to
the Title V permitting process. These educational seminars would provide opportunities for
facilities to develop an understanding of the concerns typically raised by communities and
discuss how to be a “good neighbor” based on best practices.
3. Require the permit application be accompanied by a public outreach plan: In order to maintain
the neutrality of the official Title V permitting process, yet be proactive in communicating
with stakeholders, the state agency could require the facility to include several objective
public outreach activities that support public participation. An example could include
engaging the community prior to the public hearing, via non-regulatory communication,
which would ease the environmental permitting process by providing an opportunity for
concerns to be addressed.
4. Advocate representatives from state government public health and environmental health bureaus
be present at public hearings: The concerns expressed by the public are so varied that no one
agency could address them. The inability to answer questions during public hearings led to
the community’s frustration and increased stress on the communication among the
stakeholders. Therefore, representatives from each public health and environmental health
state bureau should be represented on the public hearing panel to address a broad array of
questions and reduce the feelings of distrust.
5. Establish citizen advisory committees: This action could provide an opportunity for citizens
to voice their concerns or ask questions about the facility operations on a regular basis. One
facility manager explained that this has been a great way for the public to have direct
communication with officials about the permitting process and their concerns.
6. Establishment of a community liaison position: The community liaison position is a neutral
party who would be located in the community and have an established relationship with the
community. He/she would gather concerns and questions from the community, relay those
Community Ecology and Capacity: Advancing
Environmental Communication Strategies among Diverse Stakeholders
63
concerns and questions to the appropriate state agency and then disseminate information
back to the community. Similar to the community panel mentioned by community activists
in Claremont, NH, this action could provide an opportunity for citizens to voice their
concerns, ask questions about the facility operations on a regular basis and allow for the
community to play a role in policy and program development.
7. Be accountable for communication among stakeholders: State agency(ies) and industry need to
understand the best way to communicate with the community. To accommodate the high
number of complaints the facility was receiving, one landfill utilized web-based technology
for the public to express their concerns. However, it is important that this communication
be “two-way.” For example, numerous entries stated that many inquiries had been filed
online, yet the problems complained about were still in existence and the facility failed to
respond to any concerns. Therefore, as part of the routine evaluation of their communication
with the public, facilities need to establish processes to assure a timely response to the
public’s comments. In addition, Claremont, NH respondents (56.6%) reported
environmental health information obtained from the television more useful compared to
Concord, NH respondents (18.5%). In addition, it is important that this communication be
“two-way.” Therefore, as part of the routine evaluation of their communication with the
public, state agencies and facilities need to establish processes to assure a timely response to
the public’s comments. A community liaison could be proactive in this practice.
8. Increase state agency awareness: In several instances, the public contacted the EPA because
they were unaware of who to contact at state government or the facility. Increasing
awareness of the state agency as a stakeholder in the environmental permitting process
would help the public understand who to contact concerning environmental issues and
facilitate relationship-building between the state and the public. This may be accomplished
through state agency and facility-sponsored community events or attendance at existing
community events to raise awareness.
9. Use of appropriate information and meeting logistics: Information complexity as a
communication barrier for the public was evident in the public hearing audiotapes and
interviews with facility managers. For example, the public requested clarification by
NHDES ARD concerning emissions and health effects and asked what “all the figures and
tables meant.” Furthermore, facility managers expressed concern that the information
presented by NHDES ARD to the public was too complex, thus leading the public to contact
the facility. Taking the time to understand the community’s ecology will help state agencies
develop appropriate information that is communicated in an effective forum for that
community. Hence, this practice will be community-specific.
In addition, the room for public hearings is traditionally organized in a polarized manner
where the state agency and the facility are at one end and the community is at the other end.
This creates an “us” versus “them” perception, which can inhibit positive communication
among stakeholders. It would be optimal for the room to be organized so the stakeholders
are interspersed at a roundtable. This format allows each participant to see each other and
not feel as though any one viewpoint is valued over another.
10. Provide routine updates to stakeholders: State agency and Title V facilities should provide
concerned community members updates about progress made to address their concerns.
These updates could be communicated via a list-serve; mass mailings of a newsletter; and
updates posted to NHDES’ and the facility’s web page. This practice would keep the public
informed about what the state agency and facilities are doing and can dissuade distrust or
contention from developing.
Environmental Management in Practice
64
Our recommendations provide a set of communicative structures to help advance effective
environmental communication among stakeholders when dealing with regulated industry
in different types of communities. Such practices may increase the community’s trust in
government, as well as their belief in the credibility of community health investigations and
their acceptance of the results (Charnley & Engelbert, 2005).
11. Future work
Our future work involves examining how creative partnerships, such as those between
academia and the community can further advance environmental communication strategies.
Although academic institutions are rich resources for improving the health of the public and
the environment, academic partnerships with community organizations can be challenging.
Yet, such partnerships have been shown to translate science and best practices into social
action and policy change at the local community level (Serrell et al., 2009).
12. Acknowledgments
The authors are grateful to the following: New Hampshire Department of Environmental
Services, Air Resources Division; facility managers from Turnkey Recycling and
Environmental Enterprises, Mt. Carberry Landfill, Four Hills Landfill, Indeck Energy
Services, Inc., Schiller Station, and Wheelabrator Technologies, Inc.; CLEAR NH and the
general public and businesses of Claremont, NH and Concord, NH for their participation in
this study. In addition, the authors thank Robert J. McGrath, Assistant Professor in the
Department of Health Management and Policy, University of New Hampshire for insightful
discussions about survey design and analysis; and Holly Tutko, Clinical Assistant Professor,
Department of Health Management and Policy, University of New Hampshire for her
critical review of this work.
13. References
Agency for Toxic Substances and Disease Registry (ATSDR). (2004). Communicating results
to community residents: Lessons from recent ATSDR health investigations. Journal
of Exposure Analysis and Environmental Epidemiology, 14, 484-491.
Agency for Toxic Substances and Disease Registry (ATSDR). (2006). Health Consultation for
Cancer Incidence: Residents of Claremont, Sullivan County, New Hampshire
(Wheelabrator – Claremont Site) Retrieved December 18, 2010, from:
/>ClaremontHC09.30.06.pdf
Agency for Toxic Substances and Disease Registry (ATSDR). (2009). Public Health
Assessments and Health Consultations. Retrieved December 18, 2010 from
Agency for Toxic Substances and Disease Registry (ATSDR). (2009). Public Health
Assessment for Ambient Air Quality in Claremont, Sullivan County, New Hampshire.
Retrieved December 18, 2010, from:
/>montInitial-PublicCommentPHA03-02-2009a.pdf
Community Ecology and Capacity: Advancing
Environmental Communication Strategies among Diverse Stakeholders
65
Air Resources Division (ARD), New Hampshire Department of Environmental Services.
(n.d.). Overview. Retrieved December 15, 2010, from
Air Resources Division (ARD), New Hampshire Department of Environmental Services.
(2008). Title V Operating Permit Reporting Guidance. Retrieved December 15, 2010,
from:
/>rting_guidance.pdf
Bennett, P. (1999). Understanding responses to risk: Some basic findings. In Bennett, P. &
Calman, K. (Eds.), Risk Communication and Public Health, (pp. 3-19). New York, New
York: University Press.
Brauer, M., Hakkinen, P.J., Gehan, B.M., Shirname-More, L. (2004). Communicating
exposure and health effects results to study subjects, the community and the public:
Strategies and challenges. Journal of Exposure Analysis and Environmental
Epidemiology, 14, 479-483.
Caron, R.M. & Serrell, N. (2009). Community ecology and capacity: Keys to progressing the
environmental communication of wicked problems. Applied Environmental
Education and Communication, 8(3-4), 195-203.
Charnley, S. & Engelbert, B. (2005). Evaluating public participation in environmental
decision-making: EPA’s superfund community involvement program. Journal of
Environmental Management, 77, 165-182.
Citizens Leading for Environmental Action and Responsibility (CLEAR), Claremont, NH
(n.d.). Overview. Retrieved December 18, 2010, from:
Cottrell, R.R. & McKenzie, J.F. (2005). Qualitative research methods. In Health Promotion &
Education Research Methods: Using the Five-Chapter Thesis/Dissertation Model, (pp. 217-
244). Massachusetts: Jones and Bartlett Publishers.
Covello, V. & Sandman, P. (2001). Risk communication: Evolution and revolution. In
Wolbarst, A. (Ed.), Solutions to an Environment in Peril, (pp.164-178). Baltimore:
Johns Hopkins University Press.
Cox, R. (2006). Risk communication: Nonexpert publics and acceptable risk. In Environmental
Communication and the Public Sphere, (pp.205-240). Thousand Oaks: Sage
Publications, Inc.
Hance B.J., Chess C., Sandman P.M. (1989). Setting a context for explaining risk. Risk
Analysis, 9,113-117.
McComas, K.A. (2003). Citizen Satisfaction with public meetings used for risk
communication. Journal of Applied Communication Research, 31(2), 164-184.
McKinney, M. & Harmon, W. (2002). Public participation in environmental decision making:
Is it working? National Civic Review, 91(2), 149-170.
Park, E., Scherer, C.W., Glynn, C.J. (2001). Community involvement and risk perception at
personal and societal levels. Health, Risk & Society, 3(3), 281-292.
Parkin, R.T. (2004). Communication with research participants and communities:
Foundations for best practices. Journal of Exposure Analysis and Environmental
Epidemiology, 14, 516-523.
Environmental Management in Practice
66
Sandman, P. (1989). Hazard versus outrage in the public perception of risk. In Covello V,
McCallum D, Pavlova M (Eds.), Effective risk communication (pp. 45-49). New York:
Plenum Press.
Serrell, N., Caron, R.M., Fleishman, B., Robbins, E.D. (2009). An academic-community
outreach partnership: Building relationships and capacity to address childhood
lead poisoning. Progress in Community Health Partnerships: Research, Education, and
Action, 3.1, 53-59.
Tinker, T.L., Zook, E., Chapel, T.J. (2001). Key challenges and concepts in health risk
communication: Perspectives of agency practitioners. Journal of Public Health
Management and Practice, 7, 67-75.
United States Census Bureau (Census). (n.d.). Population Finder. Retrieved December 18, 2010
from
Wehrly, R. (2006). Constructing the problem of lead poisoning. Senior thesis (unpublished).
Wheelabrator Technologies, Inc., A waste Management Company. (n.d.) Fact Sheet.
Retrieved December 18, 2010, from:
4
Regional Issues in Environmental Management
Hiroyuki Taguchi
Policy Research Institute, Ministry of Finance
1
Japan
1. Introduction
This chapter addresses regional issues in environment management. Economic integration
beyond national boundaries has recently made great progress in regional levels as well as in
global levels, with the formulations of Free Trade Agreement (FTA) and Economic
Partnership Agreement (EPA) as typical examples. This trend in regional economic
integration also refocuses attention on regional environmental issues including trans-
boundary pollutions, and makes us rethink of what regional cooperation should be in
environment management. Based on this context, we herein discuss regional environment
issues, with a focus on East Asian region, from the following two perspectives.
The first one is about which effects, i.e. technological spillovers or pollution haven damages,
the regional latecomers have dominantly received in environment management under a
growing trend in economic integration within East Asia. If the dominance of technological
spillovers effect is identified for latecomer’s economies, we may have rather optimistic
views on the future of environment quality as a whole region, because it implies that
latecomers are absorbing the skills and technologies enough to leapfrog the mistakes made
by developed economies in the past times. On the other hand, the dominance of pollution
haven damages implies the mere relocation of polluters from developed economies towards
latecomer’s economies, i.e. no decline in pollution as a whole region, thereby making us feel
uneasy on regional prospect of environment. Thus, knowing the effects for latecomers seems
to be linked with knowing the degree of demand for policy actions as a region. East Asia, in
recent decades, has strengthened intra-economic integration in terms of trade and
investment flows.
2
At the same time, East Asian economies are still composed of a variety of
countries with different stages of development: high-income countries like Japan and Korea,
middle-income ones like Malaysia and Thailand, low-income ones such as Cambodia and
Myanmar.
3
Since the integration and diversification characterized by East Asian economies
make East Asia a typical area with provability of technology spillovers or pollution haven
damages, targeting East Asia seems to be meaningful in our analysis.
The second perspective is about what the regional framework of environmental cooperation
should be in East Asia. There have been intensive debates on the regional frameworks from
1
The views expressed in this paper are those of the author and not those of the Ministry of Finance or
the Policy Research Institute.
2
Kawai (2009) indicates, for example, that the ratio of intra-regional trade relative to world trade in East
Asia has gone up from 35 percent in 1980 towards 54 percent in 2007, which is a little under 57 percent
in EU and exceeding 43 percent in NAFTA.
3
The classification of income classes depends on World Development Indicators of World Bank.
Environmental Management in Practice
68
the viewpoints of commitment and compliance, especially in the cases of such trans-
boundary issues as long-range air and water pollutions, freshwater resources in
international rivers, migratory birds. The frameworks differ in the modality of cooperation:
policy dialogue, cooperative environmental monitoring and assessment, implementation of
project-based activities, and legal treaties and protocols. There seem to be some contrasts in
the approaches towards regional cooperation between East Asia and Europe: Non-binding
approaches in East Asia versus binding ones in Europe. The typical example is seen in the
framework of the long-ranged trans-boundary air pollution control: East Asia is promoting
non-binding agreements on pollution monitoring and other project-based activities, whereas
Europe is controlling pollution based on binding agreement in terms of the Convention for
the Long-Range Transmission of Air Pollutant in Europe (the LRTAP). Each approach
appears to have advantages and disadvantages, and the choice of the approach seems to be
linked with the region-specific properties in economical, political, and historical terms. The
purpose of this section is, thus, to investigate the reason why East Asia has taken the non-
binding approach, and to examine the justification of its choice considering the region-
specific properties.
The rest of the paper is structured as follows. Section 2 examines the effects for latecomers in
East Asia: technological spillovers versus pollution haven, corresponding to the first
perspective above. Section 3 discusses the regional frameworks of environmental
cooperation in East Asia, corresponding to the second perspective above.
2. Effects for latecomers: technological spillovers versus pollution haven
The purpose of this section is to examine whether the latecomer’s economies in East Asia
enjoy technological spillover effects or suffer pollution haven damages in their environment
management: in other words, which of latecomer’s advantage or latecomer’s disadvantage
dominates for pollution control in East Asian economies. We focus on environmental indices
with data availability: carbon dioxide emissions, consumption of ozone-depleting
substances and industrial organic water pollutant (BOD) emissions. The analytical
framework of the Environmental Kuznets curve (EK curve) is used to arrive at a conclusion.
In the following subsections, we first review previous studies on the EK curve in brief and
clarify this article’s contribution (Subsection 2.1), present our own empirical study of the
effects for latecomers (Subsection 2.2), and end with brief summary (Subsection 2.3).
2.1 Previous studies and our contribution
The environmental Kuznets curve (EK curve) provides an analytical framework to examine
how economies deal with environmental issues. The EK curve postulates an inverted-U
relationship between pollution and economic development; at early stages of development,
environmental quality deteriorates with increases in per capita income, while at higher
levels of development, environmental degradation is seen to decrease with further increases
in per capita income. Kuznets's name was apparently attached to the curve by Grossman &
Krueger (1993), who noted its resemblance to Kuznets inverted-U relationship between
income inequality and development. Since the issue of the EK curve was first discussed in
the World Bank’s 1992 World Development Report, there have been numerous empirical
tests and theoretical debates on the EK curve. Until the mid of the 1990s, most of the
empirical studies concentrated on validating the EK curve hypothesis and its requirements,
using cross-sectional data. Some of evidences on specific pollutants supported the validity
Regional Issues in Environmental Management
69
of the EK curve (e.g. Grossman & Krueger; 1995, Selden & Song; 1994), while some argue
that the EK curve does not hold at all times and for all pollutants (e.g. Shafik; 1994).
Since the late 1990s, the EK curve studies have shifted from cross-sectional analyses to time-
series analyses, especially towards the analyses for comparing the EK curves of individual
economies in terms of the height and the timing of their peaks, their shapes, etc (e.g.
Panayotou; 1997, De Bruyn et al.; 1998).
4
One of the frontiers in this direction of the EK
curve studies is to put into empirical tests the two contrasting hypotheses presented by
Dasgupta et al. (2002). One is the technological spillover hypothesis that developing
societies, by utilizing progressive environmental management and the technologies of more
advanced countries, might be able to experience an EK curve that is lower and flatter than
what conventional wisdom would suggest. The other is the pollution haven hypothesis that
the relatively high environmental standards in high-income economies impose high costs on
polluters, and shareholders pressure firms to relocate to low-income countries. This
pollution haven scenario may not shift the latecomer’s EK curves downward; on the
contrary, it may even lift them up. Taguchi & Murofushi (2009), by using the EK curve
framework, examined whether developing countries enjoy the latecomer’s advantage or
suffer the latecomer’s disadvantage in the environment management, focusing on sulfur
emissions as local air pollutants and carbon emissions as global air pollutants, by using the
world-wide samples for the 188 economies from 1960 to 1990 in sulfur emissions and from
1970 to 2003 in carbon emissions. It found contrasting result between sulfur and carbon
emissions on the latecomer’s effects; sulfur emissions represent the dominance of the
latecomer’s advantage (the downward shift of latecomer’s EK curve), while carbon
emissions reveal that of the latecomer’s disadvantage (the upward shift of latecomer’s EK
curve). It interpreted this contrast as the difference of maturity level in the know-how and
technology to abate emissions: prevailing desulfurization technology and unrestricted
“carbon leakage” (a kind of pollution haven in carbon emissions).
This study aims at testing the two contrasting hypothesis above in East Asia, – the
dominance of the latecomer’s advantage (technological spillovers) or of the latecomer’s
disadvantage (pollution haven). The main contribution is to extend the existing literature,
mainly of Taguchi (2009), to the following directions. First, our study concentrates on East
Asian economies (18 economies). The intra-area of East Asia with the characteristic of
economic integration and diversification, as stated in Introduction, can be an experimental
area suitable enough to put the hypotheses of technological spillovers and pollution haven
into empirical tests. In addition, the evidence on the latecomer’s effects in East Asia has been
extremely limited in the existing literature. Second, our analysis uses the latest data of the
period for 1990-2007 on carbon dioxide emissions, consumption of ozone-depleting
substances and industrial organic water pollutant (BOD) emissions. The usage of the latest
data enables us to make the EK curve estimation reflect the recent trends of technological
progress and policy responses to address environmental issues as well as growing economic
interaction of East Asia. Third, our estimation for the EK curve adopts a dynamic panel
model by a system of Generalized Method of Moments (GMM). It appears to take some
periods for the current level of emissions to adjust toward their equilibrium level – a kind of
inertia in the emission level. Most of previous studies for the EK curve have adopted a static
4
Borghesi (1999) criticized the cross-sectional approach by arguing that since environmental
degradation is generally increasing in developing countries and decreasing in industrialized ones, the
EK curve within the cross-sectional framework might reflect the mere juxtaposition of two opposite
trends rather than describe the evolution of a single economy over time.
Environmental Management in Practice
70
panel model in terms of ordinary fixed or random estimations. When there is evidence of
dynamics in the data, however, the validity of applying a static model might be questioned
as being dynamically miss-specified. To our knowledge, it is only Halkos (2003) that
constructed a dynamic panel model for the EK curve estimation. This paper adopts the
method of Halkos (2003), which allows dynamic adjustments in the level of emissions.
2.2 Empirics
We now turn to the empirical studies using the analytical framework of the EK curve. Our
analysis consists of two steps. First, we simply overview the relationships between per
capita real income and environmental indices. We then move to a dynamic panel analysis
using cross-country panel data to examine the EK curve pattern and to see whether the
latecomer’s advantage or its disadvantage dominates in the environmental management in
East Asian economies.
2.2.1 Data
We collect the data for three environmental indices per capita –carbon dioxide emissions,
consumption of ozone-depleting substances and industrial organic water pollutant
emissions– and real GDP per capita. All the data come from the Annual Core indicators
online database developed by the Statistics Division of the United Nations Economic and
Social Commission for Asia and the Pacific (ESCAP).
5
The database covers data from 1990 to
2007, all of which we use as sample periods. The sample economies are the following 18
ones in East Asia: Brunei Darussalam, Cambodia, China, DPR Korea, Hong Kong,
Indonesia, Japan, Lao PDR, Macao, Malaysia, Mongolia, Myanmar, Republic of Korea,
Singapore, Thailand, the Philippines, Timor-Leste and Viet Nam.
The indicator of “carbon dioxide emissions per capita” that we can obtain from the online
database is defined as the quantity of estimated carbon dioxide emissions (tons of carbon
dioxide) divided by total population, whose data sources are the United Nations
Millennium Development Goals Indicators and the World Population Prospects: the 2006
Revision Population Database. The indicator of “consumption of ozone-depleting
substances per capita” is defined as the sum of the national annual consumption in
weighted tons of individual substances in the group of ozone-depleting substances
multiplied by their ozone-depleting potential (Ozone-depleting substances are any
substance containing chlorine or bromine that destroys the stratospheric ozone layer),
expressed as ODP kilograms per 1,000 population. Its data sources are the same as those of
carbon dioxide emissions per capita. The indicator of “industrial organic water pollutant
emissions” is defined as the biochemical oxygen demand, which refers to the amount of
oxygen that bacteria in water will consume in breaking down waste, expressed as kilograms
per day. Its data source is the United Nations Environment Program, Emission Database for
Global Atmospheric Research (EDGAR 3.2). This indicator shows total amount, thereby
being divided by population. We can find the other emissions indicators in the online
database: nitrous oxide emissions, sulfur dioxide emissions and PM10 concentration in
urban area, but do not adopt them for the dynamic estimation later since their data cover
only every five years. For the real GDP per capita, the indicator of “GDP per capita on 1990
US dollars base” is obtained from the online database.
5
See the website of
Regional Issues in Environmental Management
71
To sum up, for conducting the dynamic panel estimation later on, we constructed a panel
table of the annual data of the 18 economies from 1990 to 2007 on each of per capita
environmental indices of carbon dioxide emissions, consumption of ozone-depleting
substances and industrial organic water pollutant emissions, and on real GDP per capita.
2.2.2 Overview of the EK curves in sample economies in East Asia
Fiure 1 indicates the time-series relationships between per capita real GDP and three kinds
of environmental indices per capita in selected samples of East Asian economies. The rough
Carbon Dioxide Emissions (1990, 1995, 2000, and 2004)
0
2
4
6
8
10
100.00 1,000.00 10,000.00 100,000.00
GDP per capita: US dollar in 1990
emissions per capita: tons
Jap an China Republic of Korea Malaysia Thailand Philippines Indonesia Viet Nam
Consumption of Ozone-depleting Substances (1990, 1995, 2000, and 2006)
0
100
200
300
400
500
600
700
800
900
1000
100.00 1,000.00 10,000.00 100,000.00
GDP per capita: US dollar in 1990
consumption per capita: grams
Japan China Republic of Korea Malaysia Thailand Philippines Indonesia Viet Nam
Industrial Organic Water Pollutant Emissions (1990, 1995, and 2000)
2
4
6
8
10
12
14
100.00 1,000.00 10,000.00 100,000.00
GDP per capita: US dollar in 1990
emissions per capita: grams
Ja pan China Republic of Korea Malaysia Thailand Philippines Indonesia
Fig. 1. Overview of the EK curves in selected sample economies
Environmental Management in Practice
72
findings are as follows. First, there appears to be no cases where the assembly of the
economy’s trajectories clearly produces inverted-U shape patterns. The trajectories of carbon
dioxide emissions represent an increasing trend whereas their slope seems to be flattened with
higher real GDP per capita. The lines of consumption of ozone-depleting substances roughly
represent declining slope. The cases of industrial organic water pollutant emissions have no
clear trend of trajectories. We might speculate that the carbon dioxide emissions stay at the
positively-sloping part of the EK curve, while the consumption of ozone-depleting substances
stays at its negatively-sloping part. Second, the locations of the economy’s trajectories
represent a clear contrast; the upward shifts of trajectories for latecomer’s economies are
observed in the case of carbon dioxide emissions, while downward shifts are seen in the cases
of consumption of ozone-depleting substances. The cases of industrial organic water pollutant
emissions have no clear shift of trajectories. The GDP-emissions relationships described above
may produce different implications among environmental indices. This point will be
statistically tested through dynamic panel estimations in the following section.
2.2.3 Dynamic panel analysis
We’ll now move to a dynamic panel analysis using cross-country panel data to examine the
EK curve pattern and to see whether the latecomer’s advantage or its disadvantage
dominates in the environmental management in East Asian economies.
2.2.3.1 Methodology
We first clarify some methodological points related to our analysis. To study the
relationship between pollution and growth, there are two possible approaches to model
construction. One is to estimate a reduced-form equation that relates the level of pollution to
the level of income. The other is to model the structural equations relating environmental
regulations, technology, and industrial composition to GDP, and then to link the level of
pollution to the regulations, technology, and industrial composition. We here take the
reduced-form approach for the following reasons. First, the reduced-form estimates give us
the net effect of a nation’s income on pollution. If the structural equations were to be
estimated first, one would need to solve backward to find the net effect. Moreover,
confidence in the implied estimates would depend on the precision and potential biases of
the estimates at every stage. Second, the reduced-form approach spares us from having to
collect data on pollution regulations and the state of the existent technology, which are not
always available. Thus, we think that the reduced-form relationship between pollution and
income is an important first step.
We then specify the reduced-form equation by basically following the traditions of the
literatures like Grossman and Krueger (1995) and Selden and Son (1994), and adding
appropriate variables in accordance with our analytical interests. Our specific concern
regarding the EK curve for the sample economies in East Asia is to see whether the EK-
curve trajectories for the latecomer’s economies have shifted downward or upward,
depending on the dominance of either the latecomer’s advantage or its disadvantage
6
; in
6
As Dasgupta et al. (2002) showed the revised EK curve that is actually dropping and shifting to the left
as growth generates less pollution in the early stages of industrialization and pollution begins falling at
lower income levels, the latecomer’s effects may not always be tantamount to a simple up- and
downward shifts of the EK curve. However, we here simplify the analysis by focusing on up- and
downward shift of the EK curve.
Regional Issues in Environmental Management
73
other words, the levels of environmental pollution per capita have been affected not only by
the level of per capita income following the EK curve, but also by the later degree of
development among the economies. If a sample economy with later degree of development
among the samples enjoys the lower level of environmental pollution (traces the downward
course of the EK curve), we speculate that the economy, not repeating the EK-curve
trajectories already experienced by the developed economies, should enjoy the latecomer’s
advantage by absorbing the progress in environmental know-how, skills, and technology i.e.
technological spillover. On the contrary, if the later development in a sample economy is
linked with higher pollution, the economy may suffer from the latecomer’s disadvantage
caused by the “pollution haven” scenario (see Figure 2). Therefore, we will include a term
representing the later degree of development among the economies into the equation for the
EK curve. The later degree of development of a sample economy in a certain year is
specified as the ratio of the GDP per capita of that economy relative to the maximum GDP
per capita among sample economies (equivalent to the GDP per capita of Japan) in that year.
Another methodological innovation in this study is to adopt a dynamic panel model. Halkos
(2003), pointing out that a static model is justified either if adjustment processes are really
very fast or if the static equation represents an equilibrium relationship, argued that since
the assumption that the data are stationary is incorrect, and we are not expecting a very fast
adjustment for estimating the EK curve, a statistically sound approach requires estimating a
dynamic model. Following the argument of Halkos (2003), we construct a dynamic panel
model by inserting a lagged dependent variable as a regressor into the EK curve equation
for materializing a partial adjustment toward equilibrium emissions level.
Per Capita Emissions
Latecomer's Economy + Higher Pollution
= Latecomer's Disadvanta
g
e (
⇒
Pollution Haven)
Upward Shift
Higher Income Economies
Downward Shift
Latecomer's Economy + Lower Pollution
= Latecomer's Advanta
g
e (
⇒
Technolo
g
ical S
p
illover)
Real GDP Per Capita
Fig. 2. Latecomer’s advantage and disadvantage in the EK curves
Based on analytical interests mentioned above, we specify the modified EK curve model as
follows:
2
it 0 1 it 2 it 3 it 4 it 1 5 i it
EMS GDP GDP LAC EMS f e
(1)
Environmental Management in Practice
74
where i is the economy’s index (country), t is the time index, and e is the error term. The
dependent variables EMS is measure of the per capita emissions: carbon dioxide emissions
(CDE), consumption of ozone-depleting substances (ODS) and industrial organic water
pollutant emissions (BOD). As for the independent variables, GDP is the real GDP per
capita. LAC represents the later degree of development, specifically the ratio of the real GDP
per capita of a certain economy relative to the maximum real GDP per capita among
economies in a certain year (i.e. real GDP per capita of Japan) – the lower LAC means the
later development of the economy. The f
i
denotes exogenously economy-specific factors that
affect emissions; climate, geography, energy resources, etc. The equation does not include
period dummy, because its inclusion was rejected significantly by statistical tests in the
equation estimate.
To verify the inverted-U shapes of the EK curves, the signs and magnitudes of α
1
and α
2
should be examined. Environmental emissions per capita can be said to exhibit a meaningful
EK curve with the real GDP per capita, if α
1
>0 and α
2
<0, and if the turning point, –α
1
/2α
2
is
a reasonabe number. Of particular importance is the coefficient of LAC, α
3
, which is useful
for identifying the dominance of the latecomer’s advantage or its disadvantage. The positive
sign of α
3
, the lower pollution with the later development of the economy that creates the
downward shift of the latecomers’ trajectories, indicates that the latecomer’s advantage
surpasses its disadvantage. On the other hand, the negative sign of α
3
, the higher pollution
with the later development of the economy equivalent to the upward shift of the latecomers’
curve, reveals the dominance of the latecomer’s disadvantage.
Equation (1) contains the lagged dependent variable among the explanatory variables,
thereby the ordinary OLS estimator being inconsistent. Obtaining consistent estimates
requires the application of an instrumental variables estimator or Generalized Method of
Moments (GMM). We here adopt the system GMM estimator developed by Arellano and
Bond (1991) who argues that additional instruments can be obtained in a dynamic model
from panel data if we utilize the orthogonality conditions between lagged values of the
dependent and the disturbances. The GMM estimator eliminates country effects by first-
differencing as well as controls for possible endogeneity of explanatory variables. The first-
differenced endogenous variables of EMS with two lagged periods can be valid instruments
provided there is no second-order autocorrelation in the idiosyncratic error terms. We also
use the first differenced explanatory variables of GDP with one lagged period as an
instrumental variable since GDP can possibly be correlated with the error term in case that
environmental pollution might aggravates economic growth. We then conduct two step
GMM iterations with updating weights once, and adopt White period as GMM weighting
matrix. We present the tests for autocorrelations and the Sargan test of over-identifying
restrictions in the table that follow.
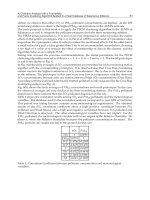
2.2.3.2 Estimation results and interpretations
Table 1 lists the results of the GMM estimation per capita on carbon dioxide emissions
(CDE), consumption of ozone-depleting substances (ODS) and industrial organic water
pollutant emissions (BOD). All the cases indicate that the inclusion of the lagged dependent
variable of the emissions per capita proved to be positively discernable, thus imply inertia in
the level of the emissions and justify forming the dynamic panel model. The Sargan tests do
not suggest rejection of the instrumental validity at conventional levels for any cases
estimated. As for the test results for autocorrelations, all the AR(2) test statistics reveal
absence of second-order serial correlation in the first-differenced errors and thus that the
instruments are valid.
Regional Issues in Environmental Management
75
We first verify the shape of the EK curve of each emission index. There are no cases that
reveal the meaningful EK curve with the inverted-U shape. The linear CDE estimation
indicates upward sloping with real GDP per capita at significant level. The quadratic CDE
estimation has the significant coefficients, α
1
and α
2
with correct signs of the inverted-U
shape. Its turning point of 26,800 US dollars is, however, falling into the edge of the samples,
i.e. only within the sample of Japan with the highest real GDP per capita. Almost all of the
trajectories are within the monotonic increasing trend, i.e. the positively-sloping part of the
EK curve. The ODS estimation indicates that the trajectories are in the monotonic decreasing
trend regardless of the linear or quadratic equation forms. Although the quadratic
estimation’s coefficients, α
1
and α
2
, suggest not inverted-U but U shape, the turning point of
116,000 US dollars is far higher from the range of the samples. The BOD represents only
monotonic downward sloping in its estimation, since the coefficient of the square of GDP,
α
2
, is insignificant. We speculate that it is due to the shortage of sample data backward from
1990 that the ODS and BOD do not prove to form the inverted-U shape curve in their
estimation.
We next see if the latecomer’s EK trajectories show a downward shift or an upward shift,
namely whether the latecomer’s advantage or its disadvantage dominate in the
environmental management of latecomer’s economies. The CDE estimate has significantly
negative α
3
, coefficient of LAC, thereby representing the upward shift of the latecomer’s
trajectories and the dominance of the latecomer’s disadvantage. On the other hand, the ODS
and BOD estimates have significantly positive α
3
, showing the downward shift of the
latecomer’s trajectories, the dominance of the latecomer’s advantage.
GDP
4.43*10
-4
*** 2.57*10
-3
*** -2.33*10
-2
*** -2.98*10
-2
*** -1.38*10
-4
*** -3.41*10
-4
**
(978.87) (33.96) (-68204.89) (-6078.09) (-6.97) (-2.25)
GDP
2
-4.78*10
-8
*** 1.28*10
-7
*** 3.53*10
-9
(-21.42) (1150.38) (1.25)
LAC -2.21*10 ***
-5.18*10
*** 1.56*10
2
*** 2.39*10
2
*** 1.22
*4.61
**
(-2980.99) (-291.37) (14700.19) (3125.34) (1.72) (2.12)
(EMS)
t-1
4.96*10
-1
*** 4.53*10
-1
*** 5.66*10
-1
*** 5.65*10
-1
*** 6.11*10
-1
*** 5.76*10
-1
***
(11958.02) (106.46) (517030.9) (171680.4) (19.48) (10.00)
Tuning Point
2.68*10
4
1.16*10
5
4.83*10
4
Sargan test 0.60 0.85 0.71 0.75 0.88 0.91
AR(1) 0.00 0.01 0.07 0.07 0.01 0.01
AR(2) 0.21 0.24 0.74 0.75 0.86 0.81
No. of obs. 222 222 192 192 93 93
(Notes)
i) The t-value are in parentheses. ***, **, and * indicate rejection at the 1 percent, 5 percent, and 10 percent
significance levels.
ii) "Sargan test" denotes the p-value of a Sargan-Hansen test of overidentifying restrictions.
iii) AR(k) is the p-value of a test that the average autocovariance in residuals of order k is zero.
CDE ODS BOD
Table 1. Results of dynamic panel estimation by GMM