Environmental Management in Practice Part 8 pdf
Bạn đang xem bản rút gọn của tài liệu. Xem và tải ngay bản đầy đủ của tài liệu tại đây (557.45 KB, 30 trang )
Indicators of Sustainable Business Practices
201
“corporate social” as (a) word(s) used in the titles of their performance reports; 20.9% (32
firms) used “environmental, health, and safety” as (a) word(s) for their performance reports;
and 13.7% (21 firms) used “environmental” as (a) word(s) for their performance titles. This
means that 65.4% of the 153 S&P 500 firms surveyed have reported the performance of
sustainable business indicators; 20.9% have disclosed the performance of environmental,
health, and safety indicators; and 13.7% have reported only environmental performance.
Fifty-three firms, 18.5% of the total 287 S&P 500 firms surveyed reported that their
environmental performance reports used the terms Environmental reports or environmental,
health and safety reports in the title of their performance reports. This result is quite different
from that of a previous study. In 1998, the Investor Responsibility Research Center (IRRC)
conducted a survey to identify how many S&P 500 firms reported their performance reports
to the public. They found that 61% of the 191 S&P 500 companies in 1998 used the term
Environmental as a keyword in the title of their performance reports (Gozali et al., 2002). This
indicates that 61% of the S&P 500 companies surveyed in 1998 focused on the performance
of environmental indicators. The use of the term Environmental in the title of the
performance reports swiftly dropped from 61% in 1998 to18.5% of the total 287 S&P 500
firms (53 firms) in 2006. On the other hand, the IRRC did not find firms that used the term
Sustainability in the titles of their samples. However, we found 34.8% (100 firms) of 287 S&P
500 companies surveyed in 2006 used the term Sustainability as a keyword in the title of their
performance reports. Changing the keywords used in the title of a firm’s performance
reports means that the main strategies of the performance reports have likely changed and
that the firm has informed the readers of what they have implemented and evaluated.
4.2.1 Distribution of industries
As of 2006, of the 287 S&P 500 companies surveyed, 19 firms were in the mining industry.
63.2% of these 19 firms (12 firms) provided their performance reports. Of the 12 firms, seven
firms (58.3% of 12 firms) used the term, Sustainability and five firms (41.7% of 12 firms) used
the term Environmental and EHS. In other words, 58.3% of firms described their performance
in accordance with the concept of sustainable development. It could be said that firms in the
mining industry have begun to progressively apply sustainable business strategies.
Thirty-two firms in the utilities industry provided their performance reports. Among them,
48.0% of the firms used the term Sustainability, and 52% of the firms used the term
Environmental and EHS in the title. Based on these numbers, it appears that many firms had
still focused more on environmental management systems than on sustainable business
even though international organizations had proposed guidelines, such as the Electric
Utilities project proposed by the WBCSD in 2000, to help firms in the utilities industry
implement sustainable business practices.
Seventy-five firms (72.8% of 103 firms) in the manufacturing industry used the term
Sustainability; 8 firms (7.8% of them) used the term Environmental; and 20 firms (19.4% of
them) used the term EHS. It appears that firms in the manufacturing industry have
proactively applied sustainable business practices or labels for such practices. Firms in the
manufacturing industry have changed from environmental management strategies to
sustainable business strategies. This shift was made possible in part because manufacturing
firms could easily apply and implement sustainable business aided by the fact that most had
already established and implemented several environmental management systems, such as
ISO 14001.
Environmental Management in Practice
202
The construction industry is a sector where sustainable business practices should be
implemented as a business practice for two reasons: it is faced with indispensable challenges
posed by “Sustainability”; and the construction industry is generally one of the largest
industries in both developed and developing countries in terms of economic, social, and
environmental impacts (Zhang, Shen, Love, & Treloar, 2000; Cole, 1998; Spence & Mulligan,
1995). However, we could not find many construction firms among S&P 500 companies in
2006 that reported their environmental or sustainable business performance. Of the seven
S&P 500 companies in the construction industry, only one firm published its performance
reports with a title that used the term Sustainability.
Several international organizations, such as the WBCSD and the Institute of Sustainable
Forestry (ISF), have encouraged firms in the agriculture, forestry, fishing, and hunting
industry to apply sustainable development by proposing special programs, such as the
Sustainable Forest Products Industry project and the Sustainable Forestry Initiatives. This is
influenced by the fact that they deal with natural capital stocks. We found only two firms in
the S&P 500, as of 2006, in Agriculture, Forestry, Fishing and Hunting. These two firms
reported their performance reports and used the terms Sustainability and Environmental in
the title of their performance reports. It is difficult to say whether firms in this industry have
applied sustainable business practices because of the small sample.
There are seven firms in the transportation and warehousing industry that published their
performance reports. Of the seven firms, two firms (28.6%) used the term Sustainability and
five firms (71.4%) used the term Environmental or EHS in their performance titles. It does not
seem that firms in the transportation and warehousing industry have implemented
sustainable business practices based on the key words used in the title of their performance
reports. Of the seven firms, the main products of four firms are the transfer of water and
gases through pipelines to their customers. Since transferring water and gases through
pipelines has the potential for causing environmental accidents, such as spills and explosion
incidents, the focus for these firms may be on the concept of environmental management
strategies.
Three firms in the accommodation and food service industry disclosed environmental or
sustainability performance reports even though this industry does not produce
environmental impact directly. Of the three firms, two firms (66.7% of the 3 firms) used the
term Sustainability and one report used Environmental. This implies that some firms in the
accommodation and food service industry have begun to consider the concept of sustainable
business.
5. Conclusions
The objective of this research is to identify whether or not firms are applying sustainable
business practice based on the Triple Bottom Line (Environmental, economic, and social
areas). We found that more companies in the manufacturing industries have measured and
disclosed diverse sustainable business indicators based on the Triple Bottom Line so that
they have implemented sustainable business practices since 2003. In other words, firms in
the manufacturing industries have integrated the concepts of sustainable business practices
into their decision-making process and that some firms in other industries have begun
incorporating the concepts of sustainable business practices into their business strategies
since 2003. We conclude that since 2003 many companies have changed their strategies
from environmental management to sustainable business. Although many firms have
Indicators of Sustainable Business Practices
203
increasingly disclosed their performance reports to the public as one of their sustainable
business practices, in many cases, they have not proactively announced the disclosure of
their performance reports to the public through Internet mass media or newspapers.
The results of this research, the distribution and types of sustainable business indicators,
could contribute to the existing literature of firms’ sustainable business practices and
activities. By providing empirical indicators that will be presented to the public, this
research can help stakeholders, including “green” investors, “green” consumers, corporate
firms, and others, recognize how the surveyed firms have implemented sustainable business
practices. This research can also encourage scholars to actively study not only the theoretical
methods for evaluating sustainable business practices, but also the theories or methods for
the development of sustainable business strategies.
The samples used in this research were not randomly collected, but purposefully sampled.
Since the sample for this study is announcements that firms voluntarily disclosed their
performance reports, it is not easy to randomly collect samples. Future researchers could
conduct case studies to identify the changes in corporate culture and evaluate the benefits of
those changes in corporate culture.
6. References
Adams, R., Houldin, M. and Slomp, S. (1999). Toward a Generally Accepted Framework for
Environmental Reporting, In: Sustainable Measures, Bennett, M. and James, P. (Ed.),
314-321, Greenleaf Publishing Limited, Sheffield, UK
Anton, W. R. Q., Deltas, G. and Khanna, M. (2004). Incentives for environmental self-
regulation and implications for environmental performance. Journal of
Environmental Economics and Management, Vol. 48, pp. 632-654
Azapagic, A. and Perdan, S. (2000). Indicators of sustainable development for industry: A
general framework. Trans IChemE, Vol. 78, No.B, pp. 243-261
Azapagic, A. (2003). Systems approach to corporate sustainability: A general management
framework. Trans IChemE, Vol. 81, No.B, pp. 303-316
Azapagic, A. and Perdan, S. (2005). An integrated sustainability decision-support
framework part I: Problem structuring. International Journal of Sustainable
Development and World Ecology, Vol. 12, No. 2, pp. 98-111
Azar, C., Holmberg, J. and Lindgren, K. (1996). Socio-ecological indicators for sustainability.
Ecological Economics, Vol. 18, No. 2, pp. 89-112
Bennett, M. and James, P. (1999), Sustainable Measures, Greenleaf Publishing, Sheffield, UK.
British Standard 7750 (BS7750). (n.d.), 20.09.2008, Available from
htm
Bruemmer, P. J. (2000). Choose Your Words With Care. 10.01.2008, Available from
Chemical Industries Association. (2002). Responsible Care (RC) program. 01.03.2008,
Available from
Cole, R. (1998). Emerging trends in building environmental assessment methods. Building
Research and Information, Vol. 26, No.1, pp.3-16
Corporate Risk Management Company. (2000). The number of ISO 14001/EMAS
registration of the world. 01.07.2009, Available from
Environmental Management in Practice
204
/>d/english/analy14k.htm
Corporate Risk Management Company. (2007).The number of ISO 14001/EMAS registration
of the world. 01.07.2009, Available from
Council on Economic Priorities Accreditation Agency. (1998). Social accountability 8000.
20.05.2007, Available from
Daly, H. E. (1990). Sustainable development: From concept and theory to operational
principles. Population and Development Review, Vol. 16, pp. 25-43
Desimone, L. D. and Popoff, F. (1998). Eco-efficiency: The business link to sustainable
development, MIT Press, Cambridge, MA, USA
Evergreen Group. (2008). What is a sustainable business. 10.10.2008, Available from
http://ww w.theevergreengroup.com/sustainable-business.htm
European Commission. (2002). Corporate social responsibility: A business contribution to
sustainable development. 20.06.2008, Available from
Etzioni, A. (2003). Toward a new socio-economic paradigm. Socio-Economic Review, Vol. 1,
pp. 105-134
Feldman, S. J., Soyka, P. A., and Ameer, P. (1996). Does improving a firm's environmental
management system and environmental performance result in a higher stock price. ICF
Kaiser Consulting Group. Fairfax, VA, USA
Global Reporting Initiative (GRI). (2002). Sustainability reporting guidelines 2002.
10.06.2007, Available from
Global Reporting Initiative (GRI). (2004). An abridged version of the 2002 Sustainability
Reporting Guidelines. Integrated with the draft Mining and Metals Sector
Supplement. 20.01.2008, Available from
Gozali, N. O., How, J. C. Y. and Verhoevern, P. (2002). The economic consequences of
voluntary environmental information disclosure. The International Environmental
Modelling and Software Society, Lugano, Switzerland, 2002, Vol. 2, pp. 484-489
Hamilton, J. T. (1995). Pollution as news: Media and stock market reactions to the Toxic
Release Inventory data. Journal of Environmental Economics and Management, Vol. 28,
pp. 98-113.
International Institute for Sustainable Development (IISD), Deloitte and Touche, and the
World Business Council for Sustainable Development. (1992). Business Strategy for
Sustainable Development: Leadership and Accountability for the 90s, International
Institute for Sustainable Development, Winnipeg, Canada
International Organization for Standardization (ISO). (1999), ISO 14031:1999 (E).
Environmental Management - Environmental evaluation – Guidelines. ISO,
Geneva, Switzerland
Internet Archive Organization (n.d.). 10.06.2008, Available from
Kuhndt, M. and Geibler, J. V. (2002). Developing a sectoral sustainability Indicators system
using the COMPASS methodology. Futura, Vol. 2 No. 2, pp. 29-44
Indicators of Sustainable Business Practices
205
Lin, L. and Wang, L. (2004). Making sustainability accountable: A valuation model for
corporate performance, Proceedings of the 12th IEEE international Symposium on
Electronics and the Environment (ISEE) and the 5th Electronics Recycling Summit, 2004,
pp. 7-12, Scottsdale. AZ, USA, May 10-13,2004
Moxen, J. and Strachan, P. A. (1998). Managing Green teams, Greenleaf Publishing, Sheffield,
UK.
Muller, K. and Sturm, A. (2001). Standardized eco-efficiency indicators, Ellipson AG., Basel,
Switzerland
Parris, T. M. and Kates, R. W. (2003). Characterizing and measuring sustainable
development. Annual Review of Environmental and Resources, Vol. 28, pp. 559-586
Pearce, D. W., Barbier, E. and Markandya, A. (1990). Sustainable development: Economics and
environment in the Third World, Edward Elgar Publishing, London, UK
Redefining Progress, Sustainable Seattle, and Tyler Norris Associates. (1997). The Community
indicators Handbook: Measuring progress toward healthy and sustainable communities,
Redefining Progress, CA, USA
Sasseville, D. R., Willson, G. W. and Lawson, R. W. (1997). ISO 14001 Answer book:
Environmental management for the world market, John Wiley & Sons, Inc, New York,
USA
Scott, R.W. (2001). Institutions and Organizations, Sage, Thousand Oaks, CA, USA
Spence, R., & Mulligan, H. (1995). Sustainable development and construction industry.
Habitat International, Vol.19, No.3, pp. 279-292
SustainableBusiness.com. (n.d.). Progressive investor. 10.06.2008, Available from
/>CFID=19300401&CFTOKEN=27983115
Thompson, D. (2002). Tools for Environmental Management: A practical Introduction and Guide
New Society, BC VOR, Canada
Verfaillie, H. A. and Bidwell, R.(2000). Measuring eco-efficiency: A guide to reporting
company performance. World Business Council for Sustainable Development,
Washington, D.C,USA
Welford, R. (1995). Environmental strategy and sustainable development: The corporate challenge
for the 21
st
century, Routledge, New York, USA
Welford, R. (2000). Corporate environmental management 3: Toward sustainable development,
Earthscan Publications Lt, London, UK
Wharton Research Data Service. (n.d), 13.06.2008, Available from
World Business Council for Sustainable Development (WBCSD). (2000). Sustainability
report. 10.08.2008, Available from
World Business Council for Sustainable Development (WBCSD). (2005).Eco-efficiency:
Creating more value with less impact. 01.05.2007, Available from
Young, C .W. (2000). Towards sustainable production and consumption: From products to
services, In: Corporate Environmental Management 3 Toward Sustainable Development,
Welford, R, 79-108, Earthscan Publications Lt, London, UK
Environmental Management in Practice
206
Zhang, Z. H., Shen, L.Y., Love, P. E. D., & Treloar, G. (2000). A framework for implementing
ISO 14001 in construction. Environmental Management and Health, Vol.11, No.2,
pp.139-149
10
Assessment of Industrial Pollution Load in
Lagos, Nigeria by Industrial Pollution Projection
System (IPPS) versus Effluent Analysis
Adebola Oketola and Oladele Osibanjo
Department of Chemistry, University of Ibadan, Ibadan
Nigeria
1. Introduction
Lagos is the economic capital of Nigeria with over 70% of industries in the country located
there. It is also the fastest growing city in Nigeria in terms of development and industrial
infrastructure, forecast to be one of the three megacities in the world with population of
over 20 million by the year 2025. The rapid growth and haphazard urbanization have led to
an increase in waste generation and environmental pollution. The industrial pollution
problems faced by Lagos with over 7,000 medium and large scale manufacturing facilities
are directly related to the rapid industrial growth and the haphazard industrialization
without environmental consideration (Oketola and Osibanjo, 2009a). Pollution abatement
technologies are largely absent and the consequence is a gross pollution of natural resources
and environmental media. Since effective environmental protection cannot take place in a
data vacuum, Industrial Pollution Projection System (IPPS), which is a rapid environmental
management tool for pollution load assessment, has been employed in this study to estimate
industrial pollution loads and to ascertain the agreement between IPPS models and
conventional effluent analysis.
It has been recognized that the developing countries lack the necessary information to set
priorities, strategies, and action plans on environmental issues. Plant-level monitoring of air,
water and toxic emissions is at best imperfect, monitoring equipment is not available and
where available is obsolete; data collection and measurement methodology are questionable,
and there is usually lack of trained personnel on industrial sites (Oketola and Osibanjo,
2009b; Hettige et al., 1994). In the absence of reliable pollution monitoring data, the World
Bank has created a series of datasets that have given the research community the
opportunity to better understand levels of pollution in developing countries, and therefore
issue policy advice with more clarity (Aguayo et al., 2001). Hence, the World Bank
developed the Industrial Pollution Projection System (IPPS), which is a rapid assessment
tool for pollution load estimation towards the development of appropriate policy
formulation for industrial pollution control in the developing countries, where insufficient
data on industrial pollution proved to be an impediment to setting-up pollution control
strategies and prioritization of activities (Faisal, 1991; Arpad et al, 1995).
IPPS is a modeling system, which has been developed to exploit the fact that industrial
pollution is heavily affected by the scale of industrial activity, by its sectoral composition,
and by the type of process technology used in production. IPPS combines data from
Environmental Management in Practice
208
industrial activities (such as production and employment) with data on pollution emissions
to calculate the pollution intensity factors based on the International Standard Industrial
Classification (ISIC) (Hettige et al., 1994). The IPPS has been estimated from massive USA
database. This database was created by merging manufacturing census data with USEPA
data on air, water, and solid waste emissions. It draws on environmental, economic, and
geographic information from about 200,000 US factories. The IPPS covers about 1,500
product categories, all operating technologies, and hundreds of pollutants. It can project air,
water, or solid waste emissions, and it incorporates a range of risk factors for human toxic
and ecotoxic effects (Hettige et al., 1995).
There are wide ranges of industries and the pollutants introduced largely depends on the
type of industry, raw material characteristics, specific process methods, efficacy of facilities,
operating techniques, product grades and climatic conditions (Onianwa, 1985). The
industrial sectors in Lagos based on the Manufacturer’s Association of Nigeria (M.A.N)
grouping are food, beverage and tobacco; textile, wearing apparel; pulp and paper products;
chemical and pharmaceutical; wood and wood products; nonmetallic mineral products;
basic metal; electrical and electronic; motor vehicle and miscellaneous; and domestic and
industrial plastics (M.A.N., 1991).The Chemical and pharmaceutical sector is the most
polluting industrial sector out of the ten major sectors based on the final ranking of IPPS
pollution loads estimated with respect to employment and total value of output while basic
metal, domestic and industrial plastics and textile wearing apparel sectors followed suit
(Oketola and Osibanjo, 2009a). The chemical manufacturing facilities in the sector range
from paint manufacturing industries, soap and detergents, pharmaceuticals, domestic
insecticides and aerosol, petroleum products, toiletries and cosmetics, basic industrial
chemicals while the basic metal manufacturing facilities are steel manufacturing, metal
fabrication, aluminium extrusion etc.
The magnitude of environmental pollution problem is related to the types and quantity of
waste generated by industries and the methods of management of the waste. As indicated
earlier, there are over 7,000 industries in Lagos state with less than 10% having installed
treatment facilities (Onyekwelu et al., 2003). Majority of these industries discharge their
partially treated or untreated effluents into the environment and the Lagos Lagoon has
gradually become a sink for pollutants from these industries. Industries utilize water for
many purposes; these include processing, washing, cooling, boiler use, flushing
sanitary/sewage use and general cleaning. Very large amount of water is required for these
activities.
Within a given industrial sector, water use correlates with the size of the industry, and also
for predicting the rate of generation of wastewater. Water supply requirements of an
industry vary from one sector to another. While some industries may only require smaller
volumes for cooling and cleaning (as in metal fabrication, cement bagging, etc), some others
due to the nature of their processes may require very large volumes of water. Among such
industries are breweries, distilleries and soft drinks manufacturing industries where water
forms the bulk of the products themselves as a solution. Total consumption is about 205,000
m
3
/day, with major users being Breweries, 22%; Textile, 18%; and Industrial chemicals,
16.6% (M.A.N., 2003). Industries utilize a vast array of input in the process of production of
goods and services, and generate different forms of waste to varying degrees, which
depends on the types and quantity of raw materials inputs, and the process technology
employed (Ogungbuyi and Osho, 2005).
This study estimated pollution loads of some industries among the top most polluting
sectors in Lagos (i.e., chemical, basic metal, plastics and textile). The selection of the
Assessment of Industrial Pollution Load in Lagos, Nigeria
by Industrial Pollution Projection System (IPPS) versus Effluent Analysis
209
industries was based on data availability and level of cooperation by industries studied. The
industries selected are paint manufacturing, industrial gas manufacturing and lubricating
oil production under the chemical and pharmaceutical sector while aluminium extrusion,
steel manufacturing and glass bottle cap production industries were selected under the basic
metal sector. Tyre manufacturing, foam and plastic production; and textile fabric and yarn
production industries were selected under the domestic and industrial plastics and textile
and wearing apparel sectors, respectively. IPPS pollution loads were estimated with respect
to employment and total output, and the results of effluent pollution loads were compared
statistically with IPPS pollution loads.
2. Experimental
2.1 Description of the study area
Lagos state has the largest population density of the four most industrialized states in
Nigeria (Lagos, Rivers, Kano and Kaduna). It is also the state with the greatest concentration
of industries, with well over seven thousand medium and large-scale industrial
establishments. It is claimed that about 70-80% of the manufacturing facilities operating
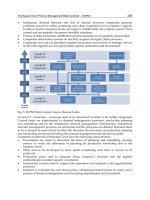
within the medium and large-scale industries are located there in. The major industrial
estates in Lagos are: Ikeja, Agidingbi, Amuwo Odofin (industrial), Apapa, Gbagada,
Iganmu, Ijora, Ilupeju, Matori, Ogba, Oregun, Oshodi/Isolo/Ilasamaja, Surulere (light
industrial) and Yaba (Arikawe, 2002; Akinsanya, 2003; Ogungbuyi and Osho, 2005) as
shown in Fig. 1.
OGUN
STATE
AGBARA
IBA
OJO
MOBA
166
AMUWO
ISOLO
(Proposed)
12
SURULERE
46
IGANMU
44
MATORI
56 ILUPEJU
25 OY INGBO
YA BA
46
AGIDINGBI
OWORONSHOKI
OJOTA
10 GBAGADA
OREGUN
OGBA
IFAKO
56 I KE JA
IJAIYE
AKITAN
55
OTTA
(Proposed)
446
IKORODU
LAGOS
LAGOS
LAGOON
OGUN STATE
AKOW ONJO
IKOYI
MAROKO
SANGO-OTTA
APAPA
700 PLOTS
40 0 P LOTS
300
200
100
ABESAN/IPAJA
665
(Proposed)
Lagoon
Fig. 1. Map of Industrial Estates in Lagos
2.2 Pollution data estimation methodology
Economic considerations and lack of cooperation from the industries limited the selection of
number of industries considered in this study and the number of samples analysed. Hence,
two paint manufacturing industries represented as CAP and BGR, domestic insecticides and
Environmental Management in Practice
210
aerosol production (DIA), and basic industrial gas manufacturing (IGM) were considered
under the chemical and pharmaceutical sector; steel manufacturing (UST), aluminium
extrusion (AET), aluminium windows and doors production (AWD) and glass bottle cap
production (CCP) were selected under the basic metal sector. Industries selected under the
domestic and industrial plastics and textile and wearing apparels were tyre, foam and
plastic manufacturing industries; and textile and yarn manufacturing industries,
respectively.
The total number of employees and average total output in CAP, BGR, LOP, UST, CCM,
AWD, AET, FMI, TTP, CLP, WSY, RLT and APT were 225 and 3, 900 ton/yr; 250 and 8,000
ton/yr; 200 and 16.1 ton/yr; 120 and 1,170 ton/yr; 1,025 and 63,200 ton/yr; 370 while total
output data was not available; 36 and 222 ton/yr; 200 and 1,800 ton/yr; 710 and 6,650
ton/yr; 1,000 and 9,560 ton/yr; 200 and 960,000 ton/yr; 350 and 12,000 ton/yr; 800 and 3,600
ton/yr; and 375 and 3,750 ton/yr, respectively. Lower Bound (LB) pollution intensities by
medium with respect to total value of output and employment were obtained from the
literature (Hettige, et al., 1994). The pollution intensities were used to estimate the pollution
loads of these manufacturing industries based on the International Standard Industrial
Classification (ISIC) code as found in the literature using the formulae:
With respect to total output;
Pollution intensity factor x Unit of Output
Pollution load
2204.6
(1)
With respect to employment;
PI X TEM
PL
1000 x 2204.6
(2)
Where,
PL = Pollution load of a sector in ton/year
PI = Pollution intensity per thousand employees per year
TEM = Total number of employees in that sector
2204.6 = Conversion factor from pounds to tonnes
2.3 Effluent sample analysis
Treated and untreated effluent samples were collected from the industries at the point of
discharge to the environment and production line, respectively. Effluent samples were
analyzed for physico-chemical parameters and heavy metals using standard methods
(APHA, 1992; Miroslav and Viadimir, 1999; Taras, 1950). The parameters determined were:
temperature, pH, turbidity, conductivity, total suspended solids (TSS), total hardness,
acidity, alkalinity, chloride, sulphate, nitrate, chemical oxygen demand (COD), biological
oxygen demand (BOD), dissolved oxygen (DO), sodium chloride, calcium, magnesium, and
heavy metals (e.g., Fe, Pb, Zn, Cd, Cr, Mn, Ni, Cu, and Co).
2.4 Statistical analysis
The data were validated statistically using t - test at 95% confidence interval (2- tailed) and
analysis of variance (ANOVA) to ascertain if there is any significant difference between IPPS
pollution loads with respect to employment and total output; and pollution loads from
conventional effluent analysis at p > 0.05.
Assessment of Industrial Pollution Load in Lagos, Nigeria
by Industrial Pollution Projection System (IPPS) versus Effluent Analysis
211
Industrial
Sector
Four
ISIC
Code
Product
Produced
Major Raw
Materials
Types of
Waste
Generated
Mode of
Disposal
Effluent
Treatment Plant
(ETP)/Constrain
General Remarks
CPH
3521
(CAP)
Paints
Pigment, resin,
solvent and
additives
Effluent
Waste
solvent
Dischar
g
e in
drain
By contractor
of
f
-site
Operational
Discharge treated
effluent into the
environment
3521
(BGR)
Paints,
wood
preservative
s, allied
products
Dyes, pigment,
solvent,
extender
Effluent
Sludge
Discharge in
drain
By contractor
off-site
Operational
Discharge treated
effluent into the
environment
3511
(IGM)
Industrial
gases e.g.
O
2
, CO
2,
acetylene
Caustic soda,
soda ash,
calcium carbide,
ammonium
nitrate.
Effluent,
Sludge
Dischar
g
e in
drain,
Sludge is
disposed by
contractor off-
site
Not available,
installing ETP
Discharge effluent
to the environment
3540
(LOP)
Lubricants,
aerosol
insecticide
etc
Petroleum
products
Effluent
Solid waste
Sludge
Used oil
generated is
discharged to
cement kiln and
solid/slud
g
e b
y
contractor off
site
Operational
Treat effluent before
discharge
DIP
3551
(TTP)
Tyres for
cars, trucks
and light
trucks
Natural and
synthetic
rubber, ZnO,
cobalt stearate,
carbon black,
mineral oil
Effluent
Solid waste
Discharge in
drain,
By contractor
off-site
Not available
Uses effluent as
cooling water
3513
(FMI)
Flexible and
ri
g
id foams,
adhesives
Polyol, toluene-
di-isocyanate
(IDI), silicone
oil, methylene
chloride
Solid waste
Recycled
Not available
Emitting volatile
or
g
anic compounds
into the atmosphere
3560(CL
P)
Plastics
Pigments and
mastic batches
Solid waste
Waste oil
discharged by
contractor off-
site
Not Applicable
Do not generate
effluent at the
production line
TWA
3211
(RLT)
Gre
y
fabrics
e.g. suiting,
ankara
Yarn, chemicals
and dyes
Effluent
Solid waste
In drain after
treatment
By contractor
of
f
-site
Operational
Discharge treated
effluent into the
environment
3211
(WSY)
Textiles
Dyes, pigment,
caustic soda,
acetic acid
Effluent
Solid waste
Dischar
g
e in
drain, by
contractor off-
site
Operational
Discharge treated
effluent into the
environment
3219
(APT)
Yarn
Cotton
Solid waste
By contractor
off-site
Not applicable
Do not generate
effluent.
BML
3720
(AET)
Aluminium
profiles
Aluminium
billets, H
2
SO
4,
NaOH,Tin (II)
Sulphate,
Chromic acid
Effluent,
solid and
sludge
Effluent
discharged in
drain after
treatment and
sludge by
contractor off-
site.
ETP operational
Do not discharge
effluent that
contains hazardous
substances into the
environment.
3720
(AWD)
Aluminium
windows
Aluminium
profile from
Solid waste
Recycle waste
Not applicable
Do not generate
effluent at all.
Environmental Management in Practice
212
and doors
aluminium
ingot
3710
(UST)
Steel bars,
refractory
bricks and
enamelware
Steel scrap,
ferrous alloys
(Fe-Mn, Fe-Si),
NaOH, clay,
silica.
Effluent,
Slag and
Sludge
Discharge in
drain
By contractor
off-site
Not available,
installing ETP
Reuse effluent as
cooling water
3720
(CCM)
Paint cans,
crown caps
and
beverage
cans
Tin plate,
copper wire etc
Solid waste
Molded
together and
sold off
Not available
Do not generate
effluent during
production
Table 1. Major raw materials and types of waste generated by the selected industries in
Lagos
3. Results and discussion
Emission to air was determined based on emission of total suspended particulate (TSP), fine
particulate (FP, PM10), sulphur dioxide (SO
2
), nitrogen dioxide (NO
2
), carbon monoxide
(CO), and volatile organic compounds (VOCs). Emission to water was estimated in terms of
biological oxygen demand (BOD) and total suspended solid (TSS) while emission of toxic
pollutants was estimated in terms of toxic chemicals and metals released into air, water and
land, whose pollution intensities were available in the literature (Hettige, et al., 1994). The
major raw materials and the type of waste generated by the selected industries are
presented in Table 1 while the total number of employees and total value of output as well
as the pollution loads are shown in Tables 2 and 3, respectively. UST have the highest
number of employees and second highest total value of output while AWD have the lowest
number of employees and LOP the lowest value of output.
3.1 IPPS pollution load assessment
3.1.1 Air pollution load
Air pollution loads for all the selected industries are shown in Tables 2 and 3, respectively
for pollution load estimated with respect to employment and total value of output. UST
with 1025 employees and 63, 200 ton/yr of total output have the highest emission of all
pollutants into environmental media (i.e., air, water, and land). The air pollution load with
respect to employment and total value of output are 4,810 tons/yr and 1,860,000 tons/yr,
respectively. This was followed by FMI,CCM, LOP, AET, TTP, IGM, RLT, APT, AWD, WSY,
BGR, CAP, and CLP, respectively in decreasing order.
In most cases, the higher the number of employees and total output, the higher the air
pollution loads. Basic metal, and domestic and industrial plastic (DIP) sectors are the most
polluting sector in terms of air pollutant emission. UST ranked first while FMI and CCM
ranked second and third, respectively. Total air pollution loads with respect to employment
are 2,660 tons/yr and 2050 tons/yr in FMI and CCM, respectively. With respect to total
output, air pollution loads are 94,500 ton/yr in FMI. Output data from CCM was not
available thus; air pollution load with respect to total output cannot be estimated. Emission
of CO and NO
2
was the highest in UST and FMI when pollution load was estimated with
respect to the two variables (i.e., employment and total output) while SO
2
emission was the
highest in CCM when pollution load was estimated with respect to employment. The trend
in air pollution load by pollutant types in these industries are
UST: CO > SO
2
> NO
2
> FP > TSP > VOC
Assessment of Industrial Pollution Load in Lagos, Nigeria
by Industrial Pollution Projection System (IPPS) versus Effluent Analysis
213
FMI: NO
2
> VOC > SO
2 >
CO > TSP > FP
CCM: SO
2
> CO > TSP > VOC > NO
2
> FP
Pollution loads estimated with respect to employment and total output revealed that the
most emitted air pollutant from UST was CO. This could be attributed to the fact that in
steel making, oxygen reacts with several components in the bath, including Al, Si, Mn, P, C,
and Fe, to produce metallic oxides which end up in the slag. It also generates carbon
monoxide boil, a phenomenon common to all steel making processes and very important for
mixing of the slag. Mixing enhances chemical reaction, purges hydrogen and nitrogen, and
improves heat transfer. The CO supplies a less expensive form of energy to the bath, and
performs several important refining reactions (Jeremy, 2003; and Bruce and Joseph, 2003). It
is also important for foaming and help to bury the arc.
INDUSTRIAL
SECTOR/
SECTOR CODE
CHEMICAL & PHARMACEUTICALS
(CPH)
BASIC METALS (BML)
ISIC CODE 3521
(CAP)
3521
(BGR)
3540
(LOP)
3511
(IGM)
3710
(UST)
3720
(CCM)
3720
(AWD)
3720
(AET)
EFFLUENT VOL.
(L/day)
1,500 2,000 NA NA 1MILLON
NA* NA 10
EFFLUENT
TREATMENT PLANT
(ETP)
Operational
Operational
Operational
NA NA NA* NA
Operational
NO OF EMPLOYEE 225 (M) 250 (M) 200 (M) 120 (M) 1025 (L) 370 (M) 36 (M) 200 (M)
AIR POLLUTANTS
SO
2
5.88 6.53 565 200 1320 1,260 122 680
NO
2
5.19 5.77 352 148 575 41.0 3.99 22.2
CO 0.73 0.81 266 115 2060 586 57.0 317
VOC 43.5 48.4 88.3 116 177 45.8 4.46 24.8
FP 1.78 1.98 17.4 6.77 366 11.6 1.13 6.25
TSP 3.49 3.88 217 32.1 307 106 10.3 57.2
TOTAL
60.6 67.3 1,510 617 4810 2,050 199 1,110
WATER
POLLUTANTS
BOD 0.01 0.07 0.59 68.3 0.89 96.5 9.39 52.2
TSS 0.03 0.03 0.73 105.6 14,400 1,400 136 754
TOTAL
0.04 0.10 1.32 174 14,400 1,490 145 806
TOXIC CHEMICALS
TO AIR 38.8 43.1 10.8 101 73.0 97.3 9.47 52.6
TO LAND 93.1 103 3.17 353 418 258 25.1 140
TO WATER 0.10 0.11 0.32 51.3 25.9 3.78 0.38 2.04
TOTAL
132 147 14.7 505 517 359 35.0 194
TOXIC METALS
TO AIR 0.33 0.37 0.02 0.50 12.5 6.73 0.66 3.64
TO LAND 2.54 2.82 0.30 15.9 276 223 21.7 121
TO WATER 0.002 0.002 0.01 0.47 1.89 0.13 0.01 0.07
TOTAL
2.89 3.18 0.33 16.9 291 230 22.4 124
NOTE: L = large scale, M = medium scale, S = small scale, NA = not available, NA* = not applicable
Table 2. Pollution loads (ton/yr) with respect to employment
Environmental Management in Practice
214
INDUSTRIAL
SECTOR/SECTOR CODE
DOMESTIC AND INDUSTRIAL
PLASTICS
(DIP)
TEXTILE, WEARING APPAREL (TWA)
ISIC CODE 3560 (CLP) 3513 (FMI)
3551 (TTP)
3219
(APT)
3211 (RLT)
EFFLUENT VOL. (L/day) NA* NA* 484,000 160 NA* 720
EFFLUENT TREATMENT
PLANT (ETP)
NA NA NA Operatio
nal
NA Operationa
l
NO OF EMPLOYEE 200 (M) 710 (L) 1,000 (L) 350 (M) 375 (M) 800 (L)
AIR POLLUTANTS
SO2 0.54 441 275 36.0 21.0 82.3
NO2 0.12 1,150 95.1 49.7 8.67 114
CO 0.04 169 11.7 6.67 1.58 15.3
VOC 6.48 838 278 13.6 166 31.2
FP 0.11 0.36 3.93 0.96 0.00 2.20
TSP 0.16 67.3 30.4 6.45 12.5 14.7
TOTAL
7.45 2,660 695 113 210 259
WATER POLLUTANTS
BOD 4.97 1.89 0.002 1.46 0.00 3.34
TSS 0.11 58.2 0.68 2.27 0.09 5.18
TOTAL
5.08 60.0 0.68 3.73 0.09 8.52
TOXIC CHEMICALS
TO AIR 18.2 484 9.98 5.22 147 11.9
TO LAND 5.38 401 17.2 4.85 33.2 11.1
TO WATER 0.04 35.4 0.21 2.66 0.01 6.08
TOTAL
23.6 920 27.4 12.7 180 29.1
TOXIC METALS
TO AIR 0.004 0.13 0.39 0.04 0.03 0.10
TO LAND 0.16 20.9 15.1 0.09 0.01 0.20
TO WATER 0.01 0.44 0.02 0.003 - 0.01
TOTAL 0.18 21.5 15.5 0.13 0.04 0.31
NOTE: L = large scale, M = medium scale, S = small scale, NA = not available, NA* = not applicable
Table 2. Contd. Pollution loads (ton/yr) with respect to employment
Assessment of Industrial Pollution Load in Lagos, Nigeria
by Industrial Pollution Projection System (IPPS) versus Effluent Analysis
215
INDUSTRIAL
SECTOR/
SECTOR CODE
CHEMICAL & PHARMACEUTICALS
(CPH)
BASIC METALS (BML)
ISIC CODE 3521 (CAP)
3521 (BGR)
3540 (LOP)
3511 (IGM)
3710 (UST)
3720(CCM)
3720 (AWD)
3720 (AET)
EFFLUENT VOL.
(L/day)
1,500 2,000 NA NA 1MILLION
NA* NA 10
EFFLUENT
TREATMENT
PLANT (ETP)
Operational
Operational
Operational
NA NA NA* NA
Operational
TOTAL VALUE OF
OUTPUT (ton/yr)
3,900 8,000 16.1 1,170 63,200 NA 222 1,800
AIR POLLUTANTS
SO
2
435 893 152 6,180 512,000 NA 3,890 31,600
NO
2
384 787 94.7 4,590 222,000 NA 127 1,030
CO 54.8 112 71.7 3,550 798,000 NA 1,800 14,700
VOC 3,220 6,600 23.8 3,590 68,600 NA 141 1,150
FP 131 269 4.68 210 142,000 NA 35.7 290
TSP 258 530 58.4 994 119,000 NA 326 2,650
TOTAL
4,480 9,190 405 19,100 1,860,000 NA 6,320 51,300
WATER
POLLUTANTS
BOD 0.46 0.94 0.16 2,120 379 NA 298 2,410
TSS 1.91 0.26 0.20 3,270 5,580,000 NA 4,300 35,000
TOTAL
2.37 1.20 0.36 5,390 5,580,000 NA 4,600 37,400
TOXIC CHEMICALS
NA
TO AIR 2,870 5,880 2.90 3,140 28,000 NA 300 2,440
TO LAND 6,880 14,100 0.85 10,900 162,000 NA 796 6,470
TO WATER 7.47 15.3 0.09 1,590 10,000 NA 11.7 94.8
TOTAL
9,760 20,000 3.84 15,600 200,000 NA 1,110 9,000
TOXIC METALS
TO AIR 24.3 49.9 0.01 15.6 4,850 NA 20.8 169
TO LAND 187 385 0.17 493 107,000 NA 689 5,590
TO WATER 0.15 0.32 0.002 14.5 732 NA 0.41 3.36
TOTAL
212 435 0.18 523 112,000 NA 710 5,760
NOTE: NA = not available, NA* = not applicable
Table 3. Pollution loads (ton/yr) with respect to total value of output
Environmental Management in Practice
216
INDUSTRIAL SECTOR/
SECTOR CODE
DOMESTIC AND INDUSTRIAL
PLASTICS (DIP)
TEXTILE, WEARING APPAREL (TWA)
ISIC CODE 3560 (CLP)
3513 (FMI) 3551
(TTP)
3211 (WSY)
3211 (RLT) 3219 (APT)
EFFLUENT VOL. (L/day) NA* NA* 484,000 160 720 NA*
EFFLUENT TREATMENT
PLANT (ETP)
NA NA NA Operational
Operational
NA
TOTAL VALUE OF OUTPUT
(ton/yr)
960,000 6,650 9,560 12,000 3,600 3,750
AIR POLLUTANTS
SO
2
24,400 15,600 16,500 13,200 3,950 1,270
NO
2
5,230 40,600 5,690 18,300 5,460 526
CO 0.001 6,010 698 2,450 731 95.3
VOC 294,00 30,000 16,700 5,010 1,500 10,100
FP 5,230 12.1 234 355 106 0.00
TSP 7,400 2,390 1,820 2,360 707 757
TOTAL
337,000 94,400 41,600 41,700 12,400 12,800
WATER POLLUTANTS
BOD 226,000 638 0.09 536 160 0.00
TSS 4,880 2,060 40.9 833 249 5.44
TOTAL
231,000 2,700 41.0 1,370 409 5.44
TOXIC CHEMICALS
TO AIR 826,000 17.2 598 1,920 573 8,940
TO LAND 245,000 14.2 1,030 1,780 532 2,010
TO WATER 2,020 1.25 12.4 977 292 0.08
TOTAL
1,070,000 32.6 1,640 4,670 1,400 10,900
TOXIC METALS
TO AIR 192 4.76 23.2 15.8 4.72 1.83
TO LAND 7,400 741.1 903 320 95.5 37.7
TO WATER 416 15.5 1.16 1.07 0.32 0.35
TOTAL
8,010 761 928 336 100.6 39.9
NOTE: NA = not available, NA* = not applicable
Table 3. Contd. Pollution loads (ton/yr) with respect to total value of output
Assessment of Industrial Pollution Load in Lagos, Nigeria
by Industrial Pollution Projection System (IPPS) versus Effluent Analysis
217
3.1.2 Water pollution load
Of all the industries, UST ranked first in terms of total water pollution load while CCM and
AET ranked second and third, respectively. This was due to the fact that emission of TSS
from the two industries was more than BOD. Estimated TSS pollution load from these
industries are 14,400 and 1,400 ton/yr, respectively while BOD pollution load are 0.89 and
96.5 ton/yr, respectively. The steel industry with the highest number of employees
generated the highest water pollution load. Thus, the higher the number of employees, the
higher the water pollution loads. Pollution load estimated with respect to total output
showed that 5.6 million ton/yr of TSS was generated by UST. Water pollution load
estimated with respect to employment and total output revealed that emission of TSS was
more than BOD in all the manufacturing facilities under the basic metal sector with UST
having the highest water pollution load with respect to the two variables (i.e., employment
and total output). This is shown in Tables 2 and 3, respectively. APT and CAP have the
lowest water pollution load thus, their contribution to water pollution is insignificant.
3.1.3 Toxic pollution load
Toxic chemical and metal pollution load with respect to employment and total output are
presented in Tables 2 and 3, respectively. Total chemical pollution load with respect to
employment and total output is more than total metal pollution load in all the facilities. This
may be attributed to the nature of the raw materials used by these facilities. Thus, raw
material characteristics and product grades are some of the factors affecting pollution load
(Oketola and Osibanjo, 2009b).
3.2 Pollution load assessment by effluent analysis
The results of the composite untreated effluent samples collected from the production line of
the facilities are presented in Tables 4 and 5, respectively. The result of effluents analysis
showed varying concentration of some of the parameters such as heavy metals, COD etc.,
which are above the permissible limits of Federal Ministry of Environment, (FEPA, 1998)
for effluent discharge thus indicating gross pollution. The values of some of the parameters
obtained could be attributed to the production processes, raw material characteristics etc.
Industrial Code
/Parameters
BGR CAP UST
1
TTP
1
WSY LOP IGM AET
Sampling time
(n)
4 5 2 2 3 2 2 5
Parameters
Temp0C 30.3±1.7 29.2±1.8 45 33±1.4 46.3±7.8 36±1.4 29.5±0.7 30.5±0.7
pH 7.62±0.5 6.32±0.5 6.75±0.1 5.75±0.1 9.6±1.0 6.85±0.6 11.3±0.0 10.8±0.9
Turbidity
(NTU)
4.15±0.3 3.53±0.5 ND ND 0.31±0.04 1,230±360 ND 0.72±0.1
Conductivity
(µs/cm)
2210±410
810±85 104±5.7 260±14 0.31±0.04 305±78
2,700±28
0
3550±780
TSS (mg/L)* 9.65±2.8 1.40±0.8 0.28±0.3 0.05±0.01
0.14±0.1 301±66 1.55±1.3 2.33±1.4
Environmental Management in Practice
218
Oil & Grease
(mg/L)
3.42±8.8 6.30±1.5 104±5.7 260±14 2,400±400 91.2±30 0.34±0.4 34.3±30
Total Alkalinity
(pH 4.3) (mg/L)
863±570 650±270 0.37±0.4 ND 1.0±0.4 32.6±46 505±710 3,730±2,400
Total Acidity
(pH 8.3) (mg/L)
813±97 602±120 41.1±6.7 67.9±10 7931.0±61 40.5±31 ND 2,070±1,300
Methyl Orange
Acidity (pH 3.7)
(mg/L)
293±590 ND 34.9±32 ND 147±120 ND ND -
Total Hardness
(mg/L)
78.7±28 58.8±20 222.6±300
6.27±1.0 376±530 80.5±63 35.9±43 246±350
Cl
-
(mg/L) 82.2±38 33.6±10 8.57±4.1 1.79±0.1 36.7±18 9.06±0.5 2.44±1.0 21.1±38
SO
4
2
- (mg/L) 106±53 855±780 46.1±2.7 1.19±0.1 1,180±680 37.4±49 199±120 717±520
PO
4
3
- (mg/L) 94.5±20 46.2±17 ND ND 7 7.0±6.1
10.5±9.6 12.0±17 47.5±14
NO
3
-
(mg/L) 2.12±1.4 ND ND ND 0.8±0.7 0.11±0.1 ND ND
DO (mg/L) ND ND 7.50±1.4 6.80±0.1 ND ND ND 80±1.8
COD (mg/L) 1700±630
642±390 130±6.4 621±43 783±86 22,160±95 897±7.1 159±130
BOD
5
(mg/L) * 23.4±2.9 20.3±7.7 10.5±3.0 0.48±0.04
4.56±0.4 54.5±18 ND 3.95±1.9
Ca (mg/L) 15.3±5.9 15.6±15 0.34±0.2 1.04±0.02
14.6±15 53.8±65 38.2±19 0.02±0.04
Mg (mg/L) 9.85±9.2 5.77±7.1 53.8±73 0.78±0.1 82.3±140 14.6±15 0.73±1.0 60.0±85
Pb (mg/L) 2.01±4.0 12.4±15 3.07±4.3 ND 9.07±16 0.22±0.3 ND 19.0±23
Ni (mg/L) 0.73±0.5 0.52±0.8 0.10±0.1 0.35±0.1 ND 0.1±0.1 0.6±0.8 0.48±0.8
Cd (mg/L) 0.78±1.1 1.77±1.3 0.11±0.2 ND 0.09±0.2 ND ND 0.44±0.6
Cr (mg/L) 0.53±0.4 0.41±0.3 0.18±0.2 0.05±0.01
0.18±0.1 ND 0.2±0.3 0.19±0.3
Fe (mg/L) 8.80±6.4 4.56±6.4 7.3±10 ND 8.27±7.2 1.40±2.0 4.9±6.9 8.96±12
Mn (mg/L) 2.71±2.2 1.02±0.9 ND 0.23±0.3 ND 0.06±0.1 0.27±0.4 0.98±1.5
Zn (mg/L) 0.15±0.1 0.02±0.04
1.00±1.4 ND 0.01±0.02 0.01±0.01 ND 0.06±0.1
Cu (mg/L) 20.7±14 8.48±7.0 2.70±2.2 0.30±0.1 2.54±0.6 7.8±7.8 4.98±7.0 14.3±6.5
Co (mg/L) 0.29±0.1 0.14±0.1 0.04±0.1 0.02±0.01
0.23±0.2 ND 0.14±0.2 0.25±0.1
TOTAL (mg/L) * 36.7 20.8 14.5 0.95 20.4 9.59 11.1 44.6
Note: * Parameters compared with IPPS pollution load
1
cooling water
Table 4. Mean concentration and standard deviation of physico-chemical parameters of
untreated effluent from the selected industries
Assessment of Industrial Pollution Load in Lagos, Nigeria
by Industrial Pollution Projection System (IPPS) versus Effluent Analysis
219
Industrial
Code/Parameters
BGR
(n = 2)
CAP
(n = 2)
WSY
(n = 2)
LOP
(n = 2)
IGM
(n = 3)
AET
(n = 2)
FMENV
LIMIT
Parameters
Temp
0
C 30±2.8 28.8±3.2 47.8±1.8 30.8±0.4 35±2 29.5±0.7
pH 7.3±0.3 8.2±0.0 9.85±0.2 8.45±1.1 9.03±0.3 10.3±0.9 6.5 – 9.0
Turbidity (NTU) 0.05±0.01 0.06±0.01 0.44±0.2 137±52 ND 0.41±0.03
Conductivity (µs/cm) 545±92 2,300±140 4,500±710 289±150 5,670±610
3,400±57
0
TSS (mg/L) * 0.23±0.02 0.32±0.1 0.37±0.2 32.0±9.9 0.44±0.1 1.91±1.3
Oil & Grease (mg/L) 0.30±0.03 0.03±0.01 19.2±3.8 4.79±1.0 9.19±6.8 3.16±0.4
Total Alkalinity (pH 4.3)
(mg/L)
293±57 572±97 1,350±440 131±56 2,880±170
1,720±1,1
00
Total Acidity (pH 8.3)
(mg/L)
136±130 60±85 220±75 9.16±1.8 76.1±16 ND
Total Hardness (mg/L) 118±67 44.5±20 32.1±25 22.0±8.5 207±330 1.57±2.2
Cl
-
(mg/L) 31.9±0.2 7.62±8.8 46.4±66 9.34±6.4 127±31 55.1±68 600
SO
4
2-
(mg/L) 103±16 471±83 303±84 36.4±36 111±32
1,100±89
0
PO
4
3-
(mg/L) 8. 85±5.2
ND 25.5±21 3.14±1.0 8.93±7.7 43.5±30
DO (mg/L) 3.75±3.5 ND ND 0.75±1.5 6.5±1.3 1.75±2.5
COD (mg/L) 1450±92 1,030±250 1,140±510 97.4±6.6 363±260 909±9.9 80.0
BOD
5
(mg/L) * 27.0±1.1 16.1±2.7 60.1±11 21.8±8.5 10.2±11 6.55±1.0 30.0
Ca (mg/L) 16.3±16 2.34±0.1 5.31±6.5 10.9±13 2.4±0.4 ND
Mg (mg/L) 18.7±6.6 9.38±4.8 4.55±2.1 5.38±3.7 48.8±79 0.38±0.5
Pb (mg/L) 3.27±4.6 4.7±6.7 6.35±9.0 7.0±9.9 0.28±0.4 ND < 1.0
Ni (mg/L) 2.8±0.6 1.20±0.3 0.90±0.1 ND 0.67±1.2 0.8±1.1 < 1.0
Cd (mg/L) 0.47±0.7 ND 0.97±1.4 ND 1.64±1.6 0.15±0.1 < 1.0
Environmental Management in Practice
220
Cr (mg/L) 0.23±0.3 0.14±0.1 0.46±0.1 0.23±0.3 0.1±0.2 0.29±0.4 < 1.0
Fe (mg/L) 10.9±3.3 0.6±0.9 6.5±9.2 4.18±5.7 60.5±66 61.1±61 20.0
Mn (mg/L) ND ND 0.08±0.1 0.06±0.1 13±6.7 ND 5.0
Zn (mg/L) 0.11±0.6 0.20±0.3 0.01±0.01 0.12±0.2 0.1±0.1 0.07±0.1 < 1.0
Cu (mg/L) 9.21±7.4 8.03±4.6 3.18±4.5 1.81±2.4 11.5±10 6.85±2.0 < 1.0
Co (mg/L) 0.32±0.4 0.15±0.2 0.16±0.1 ND 0.11±0.2 0.14±0.03
< 1.0
TOTAL (mg/L)*
28.7 16.7 19.3 6.68 87.6 72.7
Note: * Parameters compared with IPPS pollution load
Table 5. Mean concentration and standard deviation of physico-chemical parameters of
effluent discharged to the environment in the selected industries in Lagos
3.3 Results of statistical analysis
IPPS estimated pollution loads with respect to employment and total output in these
industries were statistically analysed to ascertain the level of agreement between them.
There is no significant difference between the pollution load estimated with respect to the
two variables (i.e. employment and total output) at p > 0.05 in all the industries except in
IGM, WSY, RLT, AWD, and AET. At the 0.05 level, the means are significantly different.
IPPS pollution load was also compared with pollution load from conventional effluent
analysis. There is no significant difference between them at p > 0.05 in CAP, BGR, UST, TTP
and AET while there is significant different between IPPS pollution load and pollution load
from conventional effluent analysis in WSY. Hence, IPPS compared favourably with effluent
analysis in most of the industries.
4. Conclusion
This study estimated pollution loads of some industries in Lagos using IPPS pollution
intensities with respect to employment and total output. In most cases, the higher the total
number of employees and total output, the higher the estimated pollution loads. There is no
significant difference between the pollution loads estimated with respect to the two
variables in all the industries except IGM where the two means are significantly different.
IPPS pollution loads were also compared with pollution loads from conventional effluent
analysis at p > 0.05. The two pollution loads compared favourably at this limit.
Application of IPPS in Lagos and most developing countries will no doubt enable the
regulatory and monitoring agencies in such countries to focus on the most polluting
industries. This will on the long run increase the level of enforcement since more time can be
spent on the few polluting industries. This will also enable the policy makers in the
developing countries to tackle industrial pollution since IPPS is a cheap means of assessing
industrial pollution when compared to running scientific monitoring data gathering,
analysis and assessment which is time consuming, expensive and resource intensive.
Assessment of Industrial Pollution Load in Lagos, Nigeria
by Industrial Pollution Projection System (IPPS) versus Effluent Analysis
221
Detailed information on employment and total output obtained from the fourteen industries
studied revealed that in most cases, the higher the total number of employees and output,
the higher the pollution loads by pollutant types except in TTP where the higher the total
number of employees and total output, the lower the estimated pollution loads. This
variation can be attributed to other factors which affect pollution loads. These are types and
quantity of raw materials, process technology, product grade, efficacy of facility, and source
type etc. Also, pollution load of the fourteen industries estimated with respect to
employment and total output were compared statistically using t-test at 95% confidence
interval and analysis of variance (ANOVA). At this level, the two means are not
significantly different in CAP, BGR, TTP, FMI, UST, LOP, CLP, and APT while there was
significant different in AWD, WSY, RLT, IGM, and AET. These can be attributed to the
information and data supplied by these industries including process efficiency and efficacy
of installed pollution control technology if any. For example, IGM with only 120 employees
produced 1,170 ton/yr of total output while LOP with 200 employees have a total
production capacity of 16.1 tons/yr which is significantly less than that of IGM.
The results of untreated effluent samples collected from these industries also revealed that
most of the industries discharged untreated or partially treated effluent into the
environment. Out of the 14 industries which data were available for this study, only 29%
have effluent treatment plant which is operational, 36% have no effluent treatment plant
while the remaining 36% operate dry process in which Effluent Treatment Plant (ETP) is not
applicable. Unavailability of ETP in these industries could be attributed to the high cost of
installing and maintaining an ETP, air pollution control devices, and weak enforcement of
extant environmental regulations in Lagos.
Pollution load from conventional effluent analysis were compared with IPPS pollution load
in these industries. There is no significant difference between them at p > 0.05. IPPS
pollution load of the selected industries compared favourably with pollution load from
conventional effluent analysis in CAP, BGR, UST, TTP and AET. Enough data was not
available from IGM and LOP. The exception was in WSY where there is significant
difference between IPPS pollution load with respect to output and pollution load from
conventional effluent analysis from effluent collected at the production line. Consequently,
there was an agreement between effluent analysis or scientific monitoring and assessment
and IPPS. Since IPPS compares favourably with scientific monitoring and analysis in these
industries, IPPS therefore offers a cheap management tool for pollution load assessment in
these industries; and directional basis for rapid policy intervention by government
regulatory agencies in Lagos and other developing countries where pollution abatement
technology is absent and level of enforcement is very low. It will enhance industrial
pollution control in the developing countries where funding for environmental protection is
lacking or grossly inadequate. The effectiveness of the intervening measures would
significantly reduce the overall industrial pollution.
5. References
Akinsanya, C.K. (2003). Recent trends in the pollution load on the Lagos Lagoon. – Lagos
state perspective. (A paper presented on ecological sustainable industrial
development workshop organized by UNIDO).
Aguayo, F., Gallagher, P., and Gohzalez, A. (2001). Dirt is in the eye of the beholder: The
World Bank air pollution intensities for Mexico. Global development and
environment institute working paper, No. 01-07.
Environmental Management in Practice
222
APHA, 1992. Standard methods for the examination of water and wastewater. American
Public Health Association, New York. 18
th
ed.
Arikawe-Akintola. J.O. (2002). The rise of industrialism in the Lagos area. In: Adefuye, A.,
Agiri, B., and Osuntokun, J. (Eds.).History of the peoples of Lagos state. Literamed
publications limited, Lagos, Nigeria, pp. 102-116.
Arpad Horvath, Christ T. Hendrickson, Lester B. Lave, Francis C. McMichael, and Tse –
Sung Wu (1995). Toxic emissions indices for green design and inventory. Environ.
Sci. Technol. 29, (2), 8 – 90A.
Bruce Kozak and Joseph Dzierzawski. (2003). Continuous casting of steel: basic principles.
American iron and steel institute
Dasgupta, S., Lucas, E.B., and Wheeler, D., 2000. Small plants, pollution and poverty: new
evidence from Brazil and Mexico. Policy research working paper, No. 2029.
Faisal, Islam, Rumi Shammiu, and Juhaina Junaid (1991). Industrial pollution in Bangladesh.
Retrieved on July 24, 2003, from
Federal Ministry of Environment, Housing and Urban Development (FMENV) (1998).
Industrial pollution inventory study.
Hettige, H., Martin, P., Singh, M., and Wheeler, D. (1994). The Industrial Pollution Projection
System (IPPS) policy research working paper, No. 1431, part 1 and 2.
Hettige, H., Martin, P., Singh, M., and Wheeler, D. (1995). The Industrial Pollution
Projection System (IPPS) policy research working paper, No. 1431, Part 3.
Jeremy A.T. Jones (2003). Electric arc furnace steelmaking. American Iron and Steel Institute.
Nupro Corporation
Manufacturer’s Association of Nigeria (M.A.N.) (1991). Yearly economic review.
Miroslav Radojevic and Viadimir N. Bashkin. (1999). Practical environmental analysis. Royal
Society of Chemistry.
Ogungbuyi, O.M. and Osho, Y.B. (2005). Study on Industrial Discharges to the Lagos
Lagoon. Report Submitted by United Nations Industrial Development
Organization (UNIDO), Country Service Framework Programme under the
Ecological Sustainable Industrial Development Programme.
Onianwa, P. C. (1985). Accumulation, exchange and retention of trace heavy metal in mosses
from southwest Nigeria. Ph. D. thesis, University of Ibadan, Ibadan, Nigeria.
Onyekwelu, I.U., Junaid, K.A., and Ogungbuyi, O.M. 2003. Recent trends in the pollution load
on the Lagos Lagoon – A National perspective. Presented by Federal Ministryof
Environment at the Ecological Sustainable Industrial Development Workshop. 2 - 20.
Oketola, A.A., and Osibanjo, O. (2009a). Estimating sectoral pollution load in Lagos by
Industrial Pollution Projection System (IPPS): Employment versus Output.
Toxicological & Environmental Chemistry. 91, (5), 799-818.
Oketola, A.A., and Osibanjo, O. (2009b). Industrial pollution load assessment by Industrial
Pollution Projection System (IPPS). Toxicological & Environmental Chemistry. 91, (5),
989-997.
Taras J. Michael. (1950). Phenoldisulphonic acid method of determining nitrate in water.
Anal Chem., 22, (8), 1020-102
11
Pollution Prevention in the Pulp and
Paper Industries
Bahar K. Ince
1
, Zeynep Cetecioglu
2
and Orhan Ince
2
1
Bogazici University, Institute of Environmental Science, Istanbul,
2
Istanbul Technical University, Environmental Engineering Department, Istanbul,
Turkey
1. Introduction
Pulp and paper industry is considered as one of the most polluter industry in the world
(Thompson et al., 2001; Sumathi & Hung, 2006). The production process consists two main
steps: pulping and bleaching. Pulping is the initial stage and the source of the most
pollutant of this industry. In this process, wood chips as raw material are treated to remove
lignin and improve fibers for papermaking. Bleaching is the last step of the process, which
aims to whiten and brighten the pulp. Whole processes of this industry are very energy and
water intensive in terms of the fresh water utilization (Pokhrel & Viraraghavan, 2004). Water
consumption changes depending on the production process and it can get as high as 60
m
3
/ton paper produced in spite of the most modern and best available technologies
(Thompson et al., 2001).
The wastewaters generated from production processes of this industry include high
concentration of chemicals such as sodium hydroxide, sodium carbonate, sodium sulfide,
bisulfites, elemental chlorine or chlorine dioxide, calcium oxide, hydrochloric acid, etc
(Sumathi & Hung, 2006). The major problems of the wastewaters are high organic content
(20-110 kg COD/air dried ton paper), dark brown coloration, adsorbable organic halide
(AOX), toxic pollutants, etc.
The environmental problems of pulp and paper industry are not limited by the high water
consumption. Wastewater generation, solid wastes including sludge generating from
wastewater treatment plants and air emissions are other problems and effective disposal
and treatment approaches are essential. The significant solid wastes such as lime mud, lime
slaker grits, green liquor dregs, boiler and furnace ash, scrubber sludges, wood processing
residuals and wastewater treatment sludges are generated from different mills. Disposal of
these solid wastes cause environmental problems because of high organic content,
partitioning of chlorinated organics, pathogens, ash and trace amount of heavy metal
content (Monte et al., 2009).
The major air emissions of the industry come from sulfite mills as recovery gurnaces and
burnes, sulfur oxides (SOx), from Kraft operation as reduced sulfur gases and odor
problems, from wood-chips digestion, spent liquor evaporation and bleaching as volatile
organic carbons (VOCs), and from combustion process as nitrogen oxidies (NOx) and SOx.
VOCs also include ketone, alcohol and solvents such as carbon disulfide methanol, acetone
and chlorofom (Smook, 1992).
Environmental Management in Practice
224
Many kinds of the wastes as summarized above are generated from different processes. The
amount, type and characteristics of these wastes are important to provide the best treatment
technology. Physicochemical and biological treatment technologies are used extensively for
the pulp and paper mills. The lab-scale and full-scale studies about sedimentation/floatation,
coagulation and precipitation, adsorption, chemical oxidation and membrane filtration were
carried out in the literature to examine physico-chemical approach (Pokhrel & Viraraghavan,
2004). Biological treatment both aerobic and anaerobic technologies are preferred for treatment
of pulp and paper mills because of wastewater composition consisting of high organic
compounds and economical aspects. Additionally, some fungi species are used to remove
color and AOX from the effluents (Taseli and Gokcay, 1999). In some countries, tertiary
treatment is applied to obtain discharge limits of regulations (Thompson et al., 2001). Finally,
the wide application in the full-scale plants for treatment pulp and paper mills is hybrid
systems, which is combined physico-chemical and biological treatment alternatives (Pokhrel &
Viraraghavan, 2004).
Disposal strategy of solid wastes generated from pulp and paper industry is varied depends
on the country and the regulations obeyed. After sorting and handling, dewatering, thermal
application such as combustion and anaerobic digestion to obtain energy and deposit in
landfills are general applications. However, the solid wastes should be monitored after
landfill deposition because of toxic characteristics of the compounds (Monte et al., 2009).
Also gaseous pollutants are other environmental problems generated from pulp and paper
industry. To minimize these pollutants, physico-chemical methods such as adsorption to
activated coal filters absorption, thermal oxidation, catalytic oxidation and condensation
have been widely used (Eweis et al., 1998). In the last decade, low cost and effective trends
have been developed to prevent the limitation of physico-chemical applications such as
energy cost and generating secondary pollutants (Sumathi & Hung, 2006).
Waste minimization, recycle, reuse, and innovative approaches developed in last 10 years
become more than an issue. In this chapter, waste characterization of this industry in terms
of type and source with management approaches was discussed. Exemplary applications
were presented. Finally ‘state of the art’ approaches for the environmental problems of this
industry were argued.
2. Waste characterization and source
Pulp and paper industry is one of the most water and energy consuming industry in the
world. This industry uses the fifth largest energy consumer processes; approximately 4% of
total energy is used worldwide. Also during pulp and paper process, the important amount
of waste is produced. It has been estimated that 500 million tons of paper and etc. per year
will be produced in 2020. Three different raw materials are used in the pulp and paper
industry as nonwood fibers and wood materials; soft and hard woods. Waste and
wastewaters are generated from both of pulp and bleaching processes. Additionally, 100
million kg of toxic pollutants are released every year from this industry (Cheremisinoff &
Rosenfeld, 2010).
2.1 Manufacturing technologies and process description
Pulping process is the first step of the production. The main steps of this part are debarking,
wood chipping, chip washing, chip digestion, pulp screening, thickening, and washing.
Mechanical and chemical operation processes in pulping are used in the worldwide. While
Pollution Prevention in the Pulp and Paper Industries
225
mechanical processes involve mechanical pressure, disc refiners, heating, and light chemical
processes to increase pulping yield; wood chips are cooked in pulping liquors at high
temperature and under pressure in the chemical pulping processes. (Sumathi & Hung, 2006).
Additionally, mechanical and chemical processes can be combined in some applications. The
yield of mechanical processes is higher (90-95%) compared to chemical processes (40-50%).
However quality of the pulp obtained from mechanical processes is lower and also the pulp is
highly coloured and includes short fibers (Pokhrel & Viraraghavan, 2004). Therefore, chemical
pulping carrying out in alkaline or acidic media is mostly preferred. In alkaline media
generally referred as Kraft Process, the woodchips are cooked in liquor including sodium
hydroxide (NaOH) and sodium sulfide (NaS
2
). Mixture of sulphurous acid (H
2
SO
3
) and
bisulfide ions (HSO
3
-
) is used in acidic media named as sulfide process.
During the pulp processing, approximately 5-10% of the lignin comes from the raw
materials cannot be removed and these are responsible from the dark colour of the end
product. The production of white paper (pulp bleaching) includes five or optional six
treatment steps with sequentially elemental chlorine (C1), alkali (E1), optional hypochlorite
(H) stage, chlorine dioxide (D1), alkali (E2), and chlorine dioxide (D2). The general process
steps are given in Figure 1.
2.2 Wastewater
Different pulping processes utilize different amount of water and all of these processes are
water intensive. The quality of wastewater generated from pulping and bleaching is
significantly distinctive because of the process and chemical types (Billings and Dehaas, 1971).
Approximately 200 m
3
water are used for per ton of produced pulp and most of them are
highly polluted, especially wastewater generated from chemical pulping process (Cecen et
al., 1992). Wood preparation, pulping, pulp washing, screening, washing, bleaching, paper
machine and coating operations are the most important pollution sources among various
process stages. Wastewaters generated from pulping stage include mostly wood debris,
soluble wood materials, and also some chemicals from chemical pulping process. Bleaching
process wastewater has a different quality. These wastewaters are not higher strength than
pulping process wastewater, however they include toxic components.
Process steps and the generated wastewaters from these steps are given in Figure 2.
The wastewater characteristics and their strengths changed depending upon the pulping
processing. Kraft process is widely used worldwide approximately 60% within all pulp
production includes both mechanical and chemical pulping (Holmberg & Gustavsson, 2007).
The regional or geographical distribution of the pulping processes is given in Table 1.
Region Process Type
Pulp Production (million tons)
2004 2005 2006 2007 2008 2009
North America
Chemical wood pulp 59.6 59.1 57.3 55.6 54.8 48.6
Mechanical wood pulp 16.3 16.2 15.3 14.4 13.6 11.7
Total Production 75.9 75.3 72.6 70.0 68.4 60.3
Europe
Chemical wood pulp 26.8 25.9 27.5 27.3 32.4 29.5
Mechanical wood pulp 11.5 11.2 12.4 12.1 14.3 11.9
Total Production 38.3 37.1 39.9 39.4 46.7 41.4
Table 1. Pulp production in North America and Europe (Food and Agriculture Organization
(FAO) Database, 2011)