New Perspectives in Biosensors Technology and Applications Part 15 pptx
Bạn đang xem bản rút gọn của tài liệu. Xem và tải ngay bản đầy đủ của tài liệu tại đây (3.49 MB, 30 trang )
New Perspectives in Biosensors Technology and Applications
412
electrode, whereupon the enzyme becomes embedded into the polymer matrix. The
incorporation of the enzyme into the matrix is often promoted through electrostatic
interactions. Numerous enzymes have been incorporated into electropolymerized
films(Bartlett and Cooper, 1993). In many cases conductive polypyrrole (PPy) has been used
as a polymer matrix. This choice relates to the fact that pyrrole can be electropolymerized at
low oxidation potentials in aqueous solutions at neutral pH, which is compatible with a
wide range of biological molecules. Polypyrrole has proven effective at electrically wiring
the enzymes and CNTs to the underlying electrode. During the fabrication of such
biosensors, CNTs bearing carboxylic groups are often used due to their ability to function as
an anionic dopant in the matrix.
Recently, a simple method to immobilize AChE on PPy and polyaniline (PAn) copolymer
doped with multi-walled carbon nanotubes (MWCNTs) was proposed(Du et al, 2010). The
synthesized PAn-PPy-MWCNTs copolymer presented a porous and homogeneous
morphology which provided an ideal size to entrap enzyme molecules. The surface
hydrophilicity was improved greatly after forming a complex structure instead of a separate
layer. It provided an excellent environmental and chemical stability around the enzyme
molecule to stabilize its biological activity to a large extent, resulting in a stable AChE
biosensor for screening of organophosphates exposure. MWCNTs promoted electron-
transfer reactions at a lower potential and catalyzed the electro-oxidation of thiocholine,
thus increasing detection sensitivity. Based on the inhibition of OPs on the AChE activity,
using malathion as a model compound, the inhibition of malathion was proportional to its
concentration ranging from 0.01 to 0.5 μg/mL and from 1 to 25 μg/mL, with a detection
limit of 1.0 ng/mL. Advantages of the electropolymerization approach include the good
control over the film thickness and the ability to selectively attach biomaterials onto
nanoscale electrode surfaces. The developed biosensor exhibited good reproducibility and
acceptable stability.
5.5 Encapsulation
The sol-gel and hydrogel have been widely used in recent years to immobilize biomolecules
(e.g., enzymes) for constructing electrochemical biosensors because of their easy fabrication,
chemical inertness, thermal stability and good biocompatibility. It was reported that the
immobilization of ChE by encapsulation in sol-gel prepared by tetramethoxysilane (TMSO)
and methyltrimethoxysilane (MTMSOS) showed in both cases a storage stability of several
months (Anitha et al, 2004). However, the lack of electrochemical reactivity and the poor
conductivity of these materials greatly hinder their promising applications. Therefore,
carbon nanotube has been widely incorporated into the sol-gel or hydrogel matrix. A typical
procedure for preparing CNT-based hydrogel or sol-gel consists of the dispersion of CNTs
in solvents, the mixing of the CNT suspensions with the hydrogel or the sol-gel and finally
the casting of the resultant matrix containing the immobilized enzyme on the electrode
surfaces. CNT acted as both nanometer conducting wires and catalysts, which can
effectively promote electron transfer between enzymes and the electrode surface. The main
advantage of the encapsulation process is that the entrapped species often preserves its
intrinsic bioactivity. Additionally, such sensors exhibit enhanced sensor response, due to an
increase in the surface area as well as an improvement in the electrical communication
between the redox centers of the hydrogel or the sol-gel-derived matrix and the electrode.
Apart from hydrogels and sol-gels, Nafion has also been found to be useful when
Carbon Nanotube-based Cholinesterase Biosensors for the Detection of Pesticides
413
fabricating composite electrodes. A broad range of enzymes has been successfully
immobilized onto CNT-incorporated redox hydrogels to yield sensitive biosensors (Joshi,
2005). These CNT-based sol-gel electrochemical biosensing platforms were demonstrated to
possess both the electrochemical characteristics of CNTs and the role of sol-gel for
eliminating byproducts. In contrast to the conventional sol-gel or CNT-based
electrochemical sensors, the electrochemical response of these electrodes can be
conveniently tuned from that of conventional scale electrodes to that of microelectrodes by
just varying the content of MWNTs in the composites. A sensitive and stable amperometric
sensor has been devised for rapid determination of triazophos based on efficient
immobilization of AChE on silica sol-gel film assembling MWNTs (Du et al, 2007). Under
optimum conditions, the inhibition of triazophos was proportional to its concentration from
0.02 μM to 1 μM and from 5 μM to 30 μM, with a detection limit of 0.005 μM.
6. Practical concerns
The detection of pesticides is essential for the protection of water resources and food
supplies. The designed biosensor should be sensitive enough to decrease the threshold
detection as low as possible (Villatte et al., 1998 and Sotiropoulou et al., 2005). In addition, it
should be selective towards the target analyte or class analytes. Before the benefits of
enzymatic methods can be transferred from the laboratory to the field, it is important to
stress that in the case of real samples the ChE biosensor is not a selective system because
organophosphorus and carbamic insecticides and some other compounds have an inhibition
effect on ChE. It has been demonstrated that an enzyme such as AChE is inhibited by
organophosphate and carbamate pesticides by a similar mechanism of action but with
different inhibition degree (Fukuto, 1990). This makes ChE biosensors unable to correctly
differentiate and identify particular analytes, so the selectivity for measuring ChE inhibitors
is very poor (Schulze et al., 2003 and Luque de Castro and Herrera, 2003). Therefore, ChE
biosensors are mainly attractive for measuring the total toxicity of the sample, rather than a
specific inhibitor. In fact, this behavior can be a disadvantage because other techniques are
required in order to evaluate which inhibitor is present. Therefore, little success has been
realized through real practical applications and commercialization of these devices for
solving real world problems despite a significant amount of scientific research dedicated to
ChE biosensors. Nontheless, this aspect can be also an advantage taking in consideration
that this system is a screening method. Biosensors can be very useful tool to understand the
presence of possible toxic compounds able to inhibit the ChEs, and only the samples in
which the inhibition is observed will be measured by the reference method with a relevant
saving in terms of time and cost of analysis (Dzydevych et al, 2002).
Further improvement in sensitivity and selectivity can be obtained with the use of sensitive
multienzymes which allow discrimination between the insecticides and other interferences.
Enzymes extracted from different sources have different sensitivities and selectivities
toward pesticides. For instance, the AChE extracted from the Drosophila melanogaster is 8-
fold more sensitive than the AChE from the Electric eel (Tsai and Doog, 2005). Moreover,
advances in molecular biology have made possible engineering of more sensitive and
selective ChE with individual sensitivity patterns towards a target inhibitor. Recombinant
AChEs have been undertaken to increase the sensitivity of AChE to specific
organophosphates and carbamates using site-directed mutagenesis and employing the
New Perspectives in Biosensors Technology and Applications
414
enzyme in different assay formats (Schulze et al, 2003). It was reported that an array of
multienzyme biosensors constructed with four immobilized AChEs (wild type and three
recombinant mutants) allowed discrimination of malaoxon and parathion in a binary
composite mixture and enabled detection of 11 out of 14 organophosphate and carbamate
pesticides (Bachmann et al., 2000 and Schulze et al., 2005).
ChE biosensors have great application potentials in environmental and food matrices, public
safety and military/antiterrorism. Most ChE biosensors designed for practical applications
use immobilized enzyme. However, as applied to inhibitor determination, the practical
application of immobilized ChE has a significant limitation. The inhibition results in a
decrease of the ChE activity so that repetitive use of the same biosensor without enzyme
reloading or reactivation is limited. The solution to this problem is to employ single use
disposable electrodes. These are usually prepared by screen-printed technology which
allows mass production with significant reduction in the price per electrode.
The most studied pesticides are paraoxon, dichlorvos, diazinon, aldicarb and carbofuran.
Paraoxon is commonly used as a model example for ChE inhibition. Some pesticides have
nearly no or little inhibitory effect on ChE in their pure form. In this case, detection is still
possible by oxidizing them to oxon forms, which are much more toxic. The typical example
is the case of parathion, and its corresponding oxon form, paraoxon. In some cases,
oxidation and detection of these pesticides has been improved with the use of a genetically
modified mutant ChE enzyme (Schulze et al., 2004). Anatoxin-a(s) is a natural
organophosphate which irreversibly inhibits AChE, similar to organophosphorus and
carbamate pesticides. Due to the difficulty to detect this compound using classical analytical
chemistry methodologies, research efforts have been directed toward the use of ChE
biosensors, which allow detection of anatoxin-a(s) at very low concentrations (detection
limit of 5×10
−10
M) (Vilatte et al., 2002).
The superior electrocatalytic activity of CNT-based electrodes has sparked an explosive
amount of research directed at using CNTs for electrochemical biosensing. In fact, a range of
molecules can be easily oxidized at low potentials at CNT-based electrodes. Even if such
electrodes are equipped with analyte-specific recognition units such as enzymes, they are
still vulnerable to other electroactive compounds that can also be oxidized at these low
potentials. Thus, for the assessment of a CNT-based biosensor, it is of utmost importance to
carefully consider the interferents involved in the sample under consideration. The optimal
composition of the biosensor is a trade-off between the various device parameters. A low
amount of immobilized enzyme provides only a limited concentration range where the
response is linear, whereas a large amount of enzyme could reduce the electrochemical
activity of the CNTs. While direct immobilization of the enzyme without a matrix would be
ideal for obtaining sensitive responses, such electrodes are prone to leaching of the enzyme.
This loss and the subsequent reduction in sensitivity and reproducibility can be largely
avoided by electropolymerized matrices.
In enzymatic detection methods, an initial concentrating step of the target analyte by liquid–
liquid or solid-phase extraction methods has not been commonly used for further
improvement of the sensitivity of detection. Yet, Marchesini et al. (2005) reported an
increase in the limit of detection of 40 times where solid-phase extraction was used,
although in this case the biorecognition element was not an enzyme but an antibody. It is
expected that such methods could be applied to enzymatic detection to improve sensitivity,
but may affect the portability of the method.
Carbon Nanotube-based Cholinesterase Biosensors for the Detection of Pesticides
415
7. Conclusion
The most important challenge in the development of ChE biosensors for practical
applications is the transfer of these devices from pristine research laboratory conditions to
real-life and commercial applications. In this direction, some critical parameters such as
enzyme stability, reliability and selectivity still have to be improved. This review
highlighted the analytical parameters that should be investigated in order to increase the
assay sensitivity using inhibition biosensors. The knowledge of the type of inhibition allows
thus to optimize in a fast way the biosensor in order to increase the performance of the
system and also to reduce the interferences. CNTs have been demonstrated to be an
excellent material for the development of electrochemical biosensors. The incorporation of
CNTs within composites offers the advantages of an easy and fast preparation, and
represents a very convenient alternative as a platform for further design of biosensors with
the improved performance. Considerable progress in genetic engineering allows for the
production of more selective and sensitive ChEs. The design of each sensor containing a
different immobilized enzyme (wild type and mutants ChEs extracted from different
sources) could allow sensitive detection and differentiation of multianalyte mixtures. In
addition, automated and continuous systems have been developed for measuring ChE
inhibitors in flow conditions by a computer controlled-programmable valve system which
allows reproducible pumping of different reagents including buffers, substrate and inhibitor
solutions, reactivating agents and real samples. The combination of the unique properties of
CNTs with the powerful recognition properties of sensitive multienzymes and the known
advantages of the automated and continuous systems represents a very good alternative for
the development of compact and portable devices able to address future biosensing
challenges in environmental monitoring and security control, among others.
8. Acknowledgment
This research was financially supported by the National Natural Science Foundation of
China (No.20977021), Natural Science Foundation of Heilongjiang Province (E-2007-12), Key
Project of Science and Technology of Heilongjiang (GC07C104) and the State Key Lab of
Urban Water Resource and Environment (2010TS07).
9. References
Abatemarco, T.; Stickel, J.; Belfort, J.; Frank, B. P.; Ajayan, P. M. & Belfort, G. (1999).
Fractionation of multiwalled carbon nanotubes by cascade membrane
microfiltration. Journal of Physical Chemistry B, Vol.103, No.18, pp. 3534–3538.
Andreescu, S. & Marty, J L. (2006). Twenty years research in cholinesterase biosensors:
From basic research to practical applications. Biomolecular Engineering, Vol.23, No.1,
pp. 1–15.
Anitha, K.; Venkata Mohan, S. & Jayarama Reddy, S. (2004). Development of
acetylcholinesterase silica sol-gel immobilised biosensor-an application towards
oxydemeton methyl detection. Biosensors and Bioelectronics, Vol.20, No.4, pp. 848–
856.
Arduini, F.; Ricci, F.; Tuta, C.S.; Moscone, D.; Amine, A. & Palleschi, G. (2006). Detection of
carbammic and organophosphorus pesticides in water samples using
New Perspectives in Biosensors Technology and Applications
416
cholinesterase biosensor based on Prussian Blue modified screen printed electrode.
Analytica Chimica Acta, Vol.580, No.2, pp. 155–162.
Arduini, F.; Amine, A.; Moscone, D.; Ricci, F. & Palleschi, G. (2007). Fast, sensitive and cost-
effective detection of nerve agents in the gas phase using a portable instrument and
an electrochemical biosensor. Analytical and Bioanalytical Chemistry, Vol.388, No.5-6,
pp. 1049–1057.
Arduini, F.; Amine, A.; Moscone, D. & Palleschi, G.(2010). Biosensors based on
cholinesterase inhibition for insecticides, nerve agents and aflatoxin B1 detection.
Microchimica Acta, Vol.170, No.3-4, pp. 193–214.
Arkhypova, V.N.; Dzyadevych, S.V.; Soldatkin, A.P.; El’skaya, A.V.; Martelet, C. & Jaffrezic-
Renault, N. (2003). Development and optimisation of biosensors based on pH-
sensitive field effect transistor an cholinesterases for sensitive detection solaneceous
glycoalkaloids. Biosensors and Bioelectronics, Vol.18, No.8, pp. 1047–1053.
Arkhypova, V.N.; Dzyadevych, S.V.; Jaffrezic-Renault, N.; Martelet, C. & Soldatkin, A.P.
(2008). Biosensor for assay of glycoalkaloids in potato tubers. Applied Biochemistry
and Microbiology, Vol.44, No.3, pp. 314–318.
Balasubramanian, K. & Burghard, M. (2006). Biosensors based on carbon nanotubes.
Analytical and Bioanalytical Chemistry, Vol.385, No.3, pp. 452–468.
Bartlett, P.N. & Cooper, J.M. (1993). A review of the immobilization of enzymes in
electropolymerized films. Journal of Electroanalytical Chemistry, Vol. 362, No.1-2, pp.
1–12.
Bonnet, C.; Andreescu, S. & Marty, J L. (2003). Adsorption: an easy and efficient
immobilisation of acetylcholinesterase on screen-printed electrodes. Analytica
Chimica Acta, Vol.481, No.2, pp. 209–211.
Britto, P.J.; Santhanam, K.S.V.; Rubio, A.; Alonso, J.A. & Ajayan, P.M. (1999). Improved
charge transfer at carbon nanotube electrodes. Advanced Materials, Vol.11, No.2, pp.
154-157.
Cai, C. & Chen, J. (2004). Direct electron transfer and bioelectrocatalysis of hemoglobin at a
carbon nanotube electrode. Analytical Biochemistry, Vol.325, No.2, pp. 285–292.
Chen, J.; Dyer, M. J. & Yu, M F. (2001). Cyclodextrin-mediated soft cutting of single-walled
carbon nanotubes. Journal of the American Chemical Society, Vol.123, No.25, pp. 6201–
6202.
Choi, H.C.; Shim, M.; Bangsaruntip, S. & Dai, H.J. (2002). Spontaneous reduction of metal
ions on the sidewalls of carbon nanotubes. Journal of the American Chemical Society,
Vol.124, No.31, pp. 9058–9059.
Curulli, A.; Drugulescu, S.; Cremisini, C. & Palleschi, G. (2001). Bienzyme amperometric
probes for choline and choline esters assembled with nonconducting
electrosynthesized polymers. Electroanalysis, Vol.13, No.3, pp. 236–242.
Day, T.M.; Unwin, P.R.; Wilson, N.R. & Macpherson, J.V. (2005). Electrochemical templating
of metal nanoparticles and nanowires on single-walled carbon nanotube networks.
Journal of the American Chemical Society, Vol.127, No.30, pp. 10639–10647.
Du, D.; Cai, J.; Song, D.; Zhang, A. D. (2007). Rapid determination of triazophos using
acetylcholinesterase biosensor based on sol-gel interface assembling multiwall
carbon nanotubes. Journal of Applied Electrochemistry, Vol. 37, No. 8, pp.893-898.
Du, D.; Wang, M.; Cai, J.; Qin, Y. & Zhang, A. (2010). One-step synthesis of multiwalled
carbon nanotubes-gold nanocomposites for fabricating amperometric
Carbon Nanotube-based Cholinesterase Biosensors for the Detection of Pesticides
417
acetylcholinesterase biosensor. Sensors and Actuators B: Chemical, Vol.143, No.2, pp.
524-529.
Du D.; Ye, X. X., Cai, J.; Liu, J. & Zhang, A. (2010). Acetylcholinesterase biosensor design
based on carbon nanotube-encapsulated polypyrrole and polyaniline copolymer for
amperometric detection of organophosphates, Biosensors and Bioelectronics, Vol. 25,
pp.2503–2508.
Dzydevych, S.V. & Chovelon, J M. (2002). A comparative photodegradation studies of
methyl parathion by using Lumistox and conductometric biosensor technique.
Materials Science and Engineering: C, Vol.21, No.1-2, pp. 55–60.
Dzyadevych, S.V.; Arkhypova, V.N.; Martelet, C.; Jaffrezic-Renault, N.; Chovelon, J M.,
El’skaya, A.V. & Soldatkin, A.P. (2004). Potentiometric biosensor based on ISFETs
and immobilised cholinesterases. Electroanalysis, Vol.16, No.22, pp. 1873–1882.
Dzyadevych, S.V.; Soldatkin, A.P.; Arkhypova, V.N.; El’skaya, A.V.; Chovelon, J M.;
Georgiu, C.A.; Martelet, C. & Jaffrezic-Renault, N. (2005). Early-warning
electrochemical biosensor system for environmental monitoring based enzyme
inhibition. Sensors and Actuators B: Chemical, Vol.105, No.1, pp. 81–87.
Fan, Z. & Harrison, D. J. (1992). Permeability of glucose and other neutral species through
recast perfluorosulfonated ionomer films. Analytical Chemistry, Vol.64, No.11, pp.
1304–1311.
Firdoz, S.; Ma, F.; Yue, X. L.; Dai, Z. F.; Kumar, A. & Jiang, B. (2010). A novel amperometric
biosensor based on single walled carbon nanotubes with acetylcholine esterase for
the detection of carbaryl pesticide in water. Talanta, Vol. 83, pp. 269–273.
Fortier, G.; Vaillancourt, M. & Bélanger, D. (1992). Evaluation of nafion as media for glucose
oxidase immobilization for the development of an amperometric glucose biosensor.
Electroanalysis, Vol.4, No.3, pp. 275–283.
Fukuto, T.R. (1990). Mechanism of action of organophosphorus and carbamate insecticides.
Environmental Health Perspectives, Vol.87, pp. 245–254.
Gordon, M.A.; Chan, S.L. & Trevor, A.J. (1976). Active-site determinations on forms of
mammalian brain and eel acetylcholinesterase. Biochemistry Journal, Vol.157, No.1,
pp. 69–76.
Guo, M.; Chen, J.; Li, J.; Tao, B. & Yao, S. (2005). Fabrication of polyaniline/carbon nanotube
composite modified electrode and its electrocatalytic property to the reduction of
nitrite. Analytica Chimica Acta, Vol.532, No.1, pp. 71–77.
Hu, X.; Wang, T.; Qu, X. & Dong, S. (2006). In situ synthesis and characterization of
multiwalled carbon nanotube/Au nanoparticle composite materials. The Journal of
Physical Chemistry B, Vol.110, No.2, pp. 853–857.
Hu, X.; Wang, T.; Wang, L.; Guo, S. & Dong, S. (2007). A general route to prepare one- and
three-dimensional carbon nanotube/metal nanoparticle composite nanostructures.
Langmuir, Vol.23, No.11, pp. 6352–6357.
Ivanov, A.; Evtugyn, G.; Budnikov, H.; Ricci, F.; Moscone, D. & Palleschi, G. (2003).
Cholinesterase sensors based on screen-printed electrodes for detection of
organophosphorus and carbamic pesticides. Analytical and Bioanalytical Chemistry,
Vol.377, No.4, pp. 624–631.
Jiang, L.; Liu, C.; Jiang, L.; Peng, Z. & Lu, G. (2004). A chitosan-multiwall carbon nanotube
modified electrode for simultaneous detection of dopamine and ascorbic acid.
Analytical Sciences, Vol.20, No.7, pp. 1055–1059.
New Perspectives in Biosensors Technology and Applications
418
Joshi, K.A.; Tang, J.; Haddon, R.; Wang, J.; Chen, W. & Mulchandani, A. (2005). A disposaple
biosensor for organophosphorus nerve agents based on carbon nanotubes modified
thick film strip electrode, Electroanalysis, Vol.17, No.1, pp. 54–58.
Joshi, P.P.; Merchant, S.A.; Wang, Y. & Schmidtke, D.W. (2005). Amperometric Biosensors
Based on Redox Polymer−Carbon Nanotube−Enzyme Composites. Analytical
Chemistry, Vol.77, No.10, pp. 3183–3188.
Kok, F.N.; Bozoglu, F. & Hasirci, V. (2002). Construction of an acethylcholinesterase-choline
oxidase biosensopr for aldicarb determination. Biosensors and Bioelectronics, Vol.17,
No.6-7, pp. 531–539.
Kok, F.N. & Hasirci, V. (2004). Determination of binary pesticides mixture by an
acetylcholinesterase-choline oxidase biosensor. Biosensors and Bioelectronics, Vol.19,
No.7, pp. 661–665.
Laschi, S.; Ogończyk, D.; Palchetti, I. & Mascini, M. (2007). Evaluation of pesticides-induced
acetylcholinesterase inhibition by means of disposable carbon-modified
electrochemical biosensors. Enzyme and Microbial Technology, Vol.40, No.3, pp. 485–
489.
Lee, H S.; Kim, Y.A.; Cho, Y.A. & Lee, Y.T. (2002). Oxidation of organophosphorus
pesticides for the sensitive detection by a cholinesterase-based biosensor.
Chemosphere, Vol.46, No.4, pp. 571–576.
Lefrant, S.; Baibarac, M.; Baltog, I.; Mevellec, J. Y.; Mihut, L. & Chauvet, O. (2004). SERS
spectroscopy studies on the electrochemical oxidation of single-walled carbon
nanotubes in sulfuric acid solutions. Synthetic Metals, Vol.144, No.2, pp. 133–142.
Lintellman, J.; Katayama, A.; Kurihara, N.; Shore, L. & Wenzel, A. (2003). Endocrine
disruptors in the environment (IUPAC Technical Report). Pure and Applied
Chemistry, Vol.75, No.5, pp. 631–681.
Liu, G. & Lin, Y. (2006). Biosensor based on self-assembling acetylcholinesterase on carbon
nanotubes for flow injection/amperometric detection of organophosphate
pesticides and nerve agents. Analytical Chemistry, Vol.78, No.3, pp. 835–843.
Lin, Y.; Allard, L. F. & Sun, Y P. (2004). Protein-affinity of single-walled carbon nanotubes
in water. The Journal of Physical Chemistry B, Vol.108, No.12, pp. 3760–3764.
Liu, Z.; Shen, Z.; Zhu, T.; Hou, S. & Ying, L. (2000). Organizing single-walled carbon
nanotubes on gold using a wet chemical self-assembling technique. Langmuir,
Vol.16, No.8, pp. 3569–3573.
Luque de Castro, M.D. & Herrera, M.C. (2003). Enzyme inhibition biosensors and biosensing
systems: questionable analytical devices. Biosensors and Bioelectronics, Vol.18, No.2-
3, pp. 279–294.
Mamedov, A. A.; Kotov, N. A.; Prato, M.; Guldi, D. M.; Wicksted, J. P. & Hirsch, A. (2002).
Molecular design of strong single-wall carbon nanotube/polyelectrolyte multilayer
composites. Nature Materials, Vol.1, No.3, pp. 190–194.
Montesinos, T.; Pérez-Munguia, S.; Valdez, F. & Marty, J L. (2001). Disposable
cholinesterase biosensor for the detection of pesticides in water-miscible organic
solvents. Analytica Chimica Acta, Vol.431, No.2, pp. 231–237.
Qu, J.; Shen, Y.; Qu, X. & Dong, S. (2004). Preparation of hybrid thin film modified carbon
nanotubes on glassy carbon electrode and its electrocatalysis for oxygen reduction.
Chemical Communications, No.1, pp. 34–35.
Carbon Nanotube-based Cholinesterase Biosensors for the Detection of Pesticides
419
Rivas, G. A.; Rubianes, M. D.; Rodríguez, M. C.; Ferreyra, N. F.; Luque, G. L.; Pedano, M.L.;
Miscoria, S.A. & Parrado, C. (2007). Carbon nanotubes for electrochemical
biosensing. Talanta, Vol.74, No.3, pp. 291–307.
Schulze, H.; Vorlová, S.; Villatte, F.; Bachmann, T.T. & Schmid, R.D. (2003). Design of
acetylcholinesterases for biosensors applications. Biosensors and Bioelectronics,
Vol.18, No.2-3, pp. 201–209.
Schulze, H.; Schmid, R.D. & Bachmann, T.T. (2004). Activation of phosphorothionate
pesticides based on a cytochrome P450 BM-3 (CYP102 A1) mutant for expanded
neurotoxin detection in food using acetylcholinesterase biosensors. Analytical
Chemistry, Vol.76, No.6, pp. 1720–1725.
Shan, Y. & Gao, L. (2006). In situ coating carbon nanotubes with wurtzite ZnS nanocrystals.
Journal of the American Ceramic Society, Vol.89, No.2, pp. 759–762.
Smith, A.G. & Gangolli, S.D. (2002). Organochlorine chemicals in seafood: occurence and
health concerns. Food and Chemical Toxicology, Vol.40, No.6, pp. 767–779.
Sotiropoulou, S. & Chaniotakis, N.A. (2005). Lowering the detection limit of the
acethylcholinesterase biosensor using a nanoporous carbon matrix. Analytica
Chimica Acta, Vol.530, No.2, pp. 199–204.
Sotiropoulou, S.; Fournier, D. & Chaniotakis, N.A. (2005). Genetically engineered
acetylcholinesterase-based biosensor for attomolar detectrion of dichlorvos.
Biosensors and Bioelectronics, Vol.20, No.11, pp. 2347–2352.
Stenersen, J. (2004). Chemical Pesticides. Mode of Action and Toxicology, CRC Press, Boca
Raton.
Stoytcheva, M. (2002). Electrochemical evaluation of the kinetic parameters of a
heterogeneous enzyme reaction in presence of metal ions. Electroanalysis, Vol.14,
No.13, pp. 923–927.
Suprun, E.V.; Budnikov H.C.; Evtugyn, G.A. & Brainina, Kh.Z. (2004). Bi-enzyme sensor
based on thick-film carbon electrode modified with electropolymerized tyramine.
Bioelectrochemistry, Vol.63, No.1-2, pp. 281–284.
Suprun, E.; Evtugyn, G.; Budnikov, H.; Ricci, F.; Moscone, D. & Palleschi, G. (2005).
Acetylcholinesterase sensor based on screenprinted carbon electrode modified with
prussian blue. Analytical and Bioanalytical Chemistry, Vol.383, No.4, pp. 597–604.
Susan Van Dyk, J. & Pletschke, B. (2011). Review on the use of enzymes for the detection of
organochlorine, organophosphate and carbamate pesticides in the environment.
Chemosphere, Vol.82, No.3, pp. 291–307.
Tsai, H. & Doog, R. (2005). Simultaneous determination of pH, urea, acetylcholine and
heavy metal using array-based enzymatic optical biosensor. Biosensors and
Bioelectronics, Vol.20, No.9, pp. 1796–1804.
Vakurov, A.; Simpson, C.E.; Daly, C.L.; Gibson, T.D. & Millner, P.A. (2004).
Acetylcholinesterase-based biosensor electrodes for organophosphate pesticides
detection: 1.Modification of carbon surface for immobilization of
acetylcholinesterase. Biosensors and Bioelectronics, Vol.20, No.6, pp. 1118–1125.
Vilatte, F.; Schulze, H.; Schmid, R.D. & Bachmann, T.T. (2002). A disposable
acetylcholinesterase-based electrode biosensor to detect anatoxin-a(s) in water.
Analytical and Bioanalytical Chemistry, Vol.372, No.2, pp. 322–326.
New Perspectives in Biosensors Technology and Applications
420
Villatte, F.; Marcel, V.; Estrada-Mondaca, S. & Fournier, D. (1998). Engineering sensitive
acetylcholinesterase for detection of organophosphate and carbamate insecticides.
Biosensors and Bioelectronics, Vol.13, No.2, pp. 157–164.
Wang, F.; Fei, J. & Hu, S. (2004). The influence of cetyltrimethyl ammonium bromide on
electrochemical properties of thyroxine reduction at carbon nanotubes modified
electrode. Colloids and Surfaces B, Vol.39, No.1-2, pp. 95–101.
Wang, J.; Musameh, M. & Lin, Y. (2003). Solubilization of Carbon Nanotubes by Nafion
toward the Preparation of Amperometric Biosensors. Journal of the American
Chemical Society, Vol.125, No.9, pp. 2408–2409.
Wu, F.H.; Zhao, G.C. & Wei, X.W. (2002). Electrocatalytic oxidation of nitric oxide at multi-
walled carbon nanotubes modified electrode. Electrochemistry Communications,
Vol.4, No.9, pp. 690–694.
Wu, K.; Sun, Y. & Hu, S. (2003). Development of an amperometric indole-3-acetic acid sensor
based on carbon nanotubes film coated glassy carbon electrode. Sensors and
Actuators B, Vol.96, No.3, pp. 658–662.
Wu, K. & Hu, S. (2004). Deposition of a thin film of carbon nanotubes onto a glassy carbon
electrode by electropolymerization. Carbon, Vol.42, No.15, pp. 3237–3242.
Wu, K.; Ji, X.; Fei, J. & Hu, S. (2004). The fabrication of a carbon nanotube film on a glassy
carbon electrode and its application to determining thyroxine. Nanotechnology,
Vol.15, No.3, pp. 287–291.
Xiao, L.; Wildgoose, G.G. & Compton, R.G. (2008). Sensitive electrochemical detection of
arsenic (III) using gold nanoparticle modified carbon nanotubes via anodic
stripping voltammetry. Analytica Chimica Acta, Vol.620, No.1-2, pp. 44–49.
Xu, Z.; Chen, X.; Qu, X.; Jia, J. & Dong, S. (2004). Single-wall carbon nanotube-based
voltammetric sensor and biosensor. Biosensors and Bioelectronics, Vol.20, No.3, pp.
579–584.
20
Sensor Enhancement Using
Nanomaterials to Detect Pharmaceutical
Residue: Nanointegration Using
Phenol as Environmental Pollutant
Chandra S. Padidem
1
, Sajid Bashir
2
and Jingbo Liu
1,3
1
Nanotech and Cleantech Group, Texas A&M University-Kingsville,
2
Chemical Biological Group, Texas A&M University-Kingsville
3
Department of Chemistry, Texas A&M University
United States of America
1. Introduction
Phenol is an aromatic compound, with a wide variety of uses both medical and industrial.
During its production, emissions of even low amounts have been demonstrated to be toxic
at submicrogram/liter levels. Phenol is also a good model compound to assess
environmental impact of its emission particularly in wastewater. However, the current
approach, methodologies and application described herein can also be applied to other
organic environmental / pharmaceutical pollutants. Phenol has been removed from
wastewater through a number of different approaches and monitored using spectroscopy
and chromatography. In the field the most common method is detection through
electrochemical or colorimetric sensors, which are described in this study.
1.1 Source and properties of phenol
Phenol is an organic compound, which can be generated from petroleum by-products like
tar (reviewed by Gerberding, 2002) or from the metabolism of benzene or organic matter
containing appropriate motifs (Martus et al., 2003). Phenol also occurs in thyme oil, oil of
wintergreen and methyl salicylate and has been generated as a by-product in various
industrial processes, such as coke production, in the manufacturer of wood preservatives,
fungicides and as a synthetic precursor in the synthesis of organic compounds used in
pesticide, dye and pharmaceutical synthesis (Akai et al., 1998) and in disinfection (Chick,
1908). In the production of epoxy resins and nylon, phenol is required for synthesis of
caprolactam and bisphenol A, which are carcinogenic intermediate molecules (Jones, 1981).
The disinfectant properties of phenol have applications in over-the-counter medicines such
as mouthwash, disinfectants, or fungicides, which have traces of phenol, and in throat
lozenges. The approximate usage of phenol varies by industry, but is in the millions of
kilograms per year range (Gilman et al., 1988). Phenols (or phenolic resins) if directly
released into environment (air, soil or water) are toxic (reviewed by Gogate, 2008). The
release is not common but can occur as a result of its widespread use, for example in the
New Perspectives in Biosensors Technology and Applications
422
automotive, construction, plywood, and appliance industries (Zhang et al., 2006) and in the
manufacture of plastics as a plasticizer or antioxidant (reviewed by Xanthos, 1969). The type
and degree of substitution would dictate the stability and reactivity of the phenol derivative
(reviewed by Babich & Davis, 1981; Salkinoja-Salone, 1981).
The ease of removing hydrogen ion at the hydroxy-position can give information on
acidity/basicity, as a general rule more electronegative groups such as nitro led to stronger
acids than the parent alone (reviewed by Kozak et al., 1979). Once phenol is synthesized, it
can be converted to the end-product through the appropriate synthetic routes, for example if
chlorophenol or trichlorophenol isomers are required, they can be synthesized through the
Boehringer Process with iron salt as the catalyst, under low, similarly for the synthesis of
pentachlorobenzene, or chlorobenzene, or hexachlorobenzene isomers, the appropriate
precursor is hydrolyzed under alkaline conditions (reviewed by Buehler & Pearson, 1970;
McKillop et al., 1974), noting that phenol can also be readily oxidized.
1.2 Toxicological effects of phenol
Phenol can induce skin cancer as documented in dermal studies of cutaneous application of
phenol and can act as a tumor promoter or a weak skin carcinogen in mice (USDA, 1980a;
Kreijl & Slooff, 1983). Teratogenic effects of phenol have also been reported in animal
studies. With nasal and cutaneous exposure, the results are irritation of the skin, eyes and
mucus membranes. Cutaneous application of phenol results in dermal inflammation and
necrosis. Dermatological disorders including discoloration of the skin (Deichmann &
Keplinger, 1962; reviewed by Bruce et al., 1987). Different derivatives have different
toxicities (with the toxicity being related to acidity and persistence being related to degree of
solubility in fats and lipids), with nitrophenol being the most toxic followed by
chlorophenols which in turn are more toxic than phenol alone, however, chlorophenols are
more difficult to biodegrade, therefore pose more of a problem than phenol in terms of
toxicity and persistence (reviewed by Crosby, 1982; Folke, 1985).
1.3 Sampling and cleanup
Procedures have been developed to monitor the different species of phenol generated such
that they are below toxic levels in a variety of matrices (Fichnolz et al., 1965; West et al., 1966;
Chau & Coburn, 1974). Generally, the sample which is thought to contain phenol has its pH
changed to non-neutral pH values to minimize microbial degradation and stored in brown
glass vials to decrease the loss to adsorption and photodecomposition, respectively (Afghan
et al., 1974). The extraction of phenol from the matrices as varied as water, fish, air, soil or
plants has relied on organic solvents such as petroleum ether, benzene, or chloroform for
polysubstituted phenols and butyl acetate or isomayl acetate for (monosubstituted) phenol
(Taras et al., 1971; Afghan et al., 1974; Greminger et al., 1982). Liquid-liquid partitioning can
be used to separate phenol from other organic compounds found in the matrices, or column
chromatography, silica gel chromatography have been used to achieve separation (reviewed
by Rao et al., 1978; EPA 1980; USDA 1980b; Renberg & Björseth, 1983; reviewed by Busca et
al., 2008).
1.4 Sensor overview
With the advancement of science and technology sensor can change the data into a digital
reading or some other form for easy perception of results (reviewed by Karube et al., 1995
Sensor Enhancement Using Nanomaterials to Detect
Pharmaceutical Residue: Nanointegration Using Phenol as Environmental Pollutant
423
and Rogers, 1995). Actual sensor design and manufacturing for environmental (reviewed by
Hart & Wring, 1997) monitoring or sensor architecture (reviewed by Lynch & Loh, 2006) for
monitoring ands reporting are beyond the scope of this chapter. The generic approaches and
applications will be discussed with emphasis on environmental monitoring or chemical
detection particularly for phenol. Since the development of a blood sugar monitoring sensor,
the miniaturization of sensors has been advanced dramatically in detection of other
molecules of interest (Kadish & Hall, 1965). In environmental and medical applications
sensors have been used in the monitoring of phenol, the widespread use of sensors is due to
their small size, operational suitability (e.g. good linear range, selectivity and sensitivity for
the target molecule), robustness, ease of operation and the ability for micro-fabrication and
auto-control (reviewed by Wang, 1997; Yu et al., 2003).
Sensors can be fabricated under ambient conditions with excellent pressure and temperature
stability coupled to negligible expansion or swelling in protic /aprotic solutions (i.e. chemical
inertness, Yu et al., 2003). These favourable operation parameters have led to their widespread
adaptability for various applications. Most methods of analysis require site identification,
collection, storage and shipment of the samples for further processing at the laboratory
equipped to do the chemical / biological analysis. Poor handling during this sample
acquisition process can led to high statistical variability of the measured values (Chau &
Coburn, 1974; Klein, 1988; Shammala, 1999). Due to their size and portability, sensors have
been evaluated more in instant field testing of analytes as opposed to lengthy laboratory
testing of analytes (reviewed by Rodriguez-Mozaz et al., 2005) where a quick determination
is required. Sensors may be in the form of microchips, electrodes or thin films. The most
common methods for sensor fabrication are sensors with amperometric detection (Hanrahan
et al., 2004), although gas-chromatography and colorimetric sensors have also been used
(Saby et al., 1997). The colorimetric method relies on the formation of a colored complex
either as the final product or as stable intermediate (Martin, 1949). Common colorimetric
tests include use of tretracyanoethylene or tetracyanoethylene ((NC)
2
C=C(CN)
2
, Smith et al.,
1963a), diamine ((C
2
H
5
)
2
NC
6
H
4
NH
2
, Houghton & Pelly, 1937; Eksperiandova et al, 1999)
leading to the formation of indophenol (Ettinger & Ruchhoft, 1948; Smith et al., 1963b;
Gupta, 2006), which is measured through titration extracted with carbon tetrachloride as
summarised by Hill (Hill & Herndon, 1952; Benvenue & Beckman, 1967; Regnier & Watson,
1971; NRCC-18578, 1982). In addition, derivatization with 4-aminoantipyrine (C
11
H
13
N
3
O)
followed by ultraviolet (UV) spectrophotometric / spectrofluorometric detection, usually at
254 (or 280) nm can be used with a limit of detection (LOD) in the sub microgram / liter
range (Lykken et al., 1946; Dannis , 1951; Afghan et al., 1974; Norwitz et al, 1979; Realini,
1980; Farino et al, 1981). Other methods utilize gas chromatography (Renberg, 1981; Giger &
Schaffner, 1983) coupled with flame ionization detection (FID) for derivatized phenol (e.g.
acetylated, or heptafluorobutyl, or pentafluorobenzyl ether phenol) to increase volatility of
phenol to enable GC-based analysis, (Corcia, 1973; Renberg, 1982, 1983) or liquid
chromatography (LC) methods such as reverse phase (RP) with UV or electrochemical (EC)
detection (ECD, Bhatia, 1973; Churatek & Houpek, 1975; Bidlingmeyer, 1980; Ogan & Katz,
1980). The RPLC method can give ultrahigh sensitivity in the parts-per-billion (ppb) range
(Hoffsommer et al., 1980; Wegman & Wammes, 1983; Lee et al., 1984a, 1984b). Other
chromatographic methods (Armentrout et al., 1979) include ion-pair chromatography
(Tomlinson et al., 1978) followed by RP separation have been reported with a LOD in the (<
0.1 – 30) microgram / liter range (Goulden et al., 1973; Chau & Coburn, 1974; Kuehl &
Dougherty, 1980; Mathew & Elzerman, 1981; Ribick et al., 1981; Lindinger et al., 1998).
New Perspectives in Biosensors Technology and Applications
424
Lastly, chemical / electron ionization and fast atom bombardment in positive-ion mode,
have been applied in the analysis of phenol (reviewed by Lisk, 1970; and C. Staples et al.,
1998; Santana et al., 2009). Over the last decade, there has been a shift from analysis by
analytical biochemists to analysis by technicians. This has necessitated a re-design of sensors
to be portable, rugged, with low manufacturing costs, the desired selectivity and sensitivity,
and ease of interpretation of results. Colorimetric-based readouts (Folin & Denis, 1915;
Rakestraw, 1923; Box, 1983) have inherent advantages over other EC sensors, in terms of
cost, robustness and ease of operation. The sensor must consist of a : (i) trapping element in
which the target molecule is selectively bound and held in place; and (ii) sensing or
detecting element, which interacts with the target molecule leading to a quantified chemical
reaction, as the output parameter for detection and quantification. In this regards, a
colorimetric sensor based on Gibbs reagent as the sensing element and cyclodextrin and / or
gold nanoparticles as the trapping elements were designed with the aim of detecting organic
pollutants exemplified by phenol.
1.4.1 Gibbs-based sensor
Dihalogen-substituted quinonechloroimides (such as 2,6-dichloroquinone-4-chloroimide
and 2,6-dibromoquinone-4-chloroimide, also known as Gibbs reagent ) give the most stable
indophenols. The test employing the 2,6-dichloroquinone-4-chloroimide, has a sensitivity of
at least 1 part of phenol in 20x10
6
. The indophenol formation can be measured quantitatively
by means of the spectrophotometer. The maximum absorption for 2,6-dichloroquinoneimine
was 280.5 nm with a change at 275 nm (at pH 8.5, Svobodová et al, 1977a) where indophenol
formation was measured at 610 nm in the spectrophotometer. Subsequently, it was
proposed to use 2,6-dichloroquinone-4-chloroimide as the standard Gibbs’ reagent for the
detection and determination of uric acid (Raybin, 1945). The quinonechloroimides do not
react with all phenols and the primary requisite is that the position para to the hydroxyl
must be unsubstituted (Gibbs, 1927a, 1927b). Different indophenol formations require
different pH, but all are formed in the alkaline region (Gibbs, 1927a). Phenols substituted in
the 2- and 6-positions (2,6-di-tertbutyl- and 2-tert-butyl-6-methyl-4-methoxyphenol) tended
to give a typical magenta color (absorption region 565-575 nm, Dacrel, 1971). For
photometric purposes, acetone, dioxan, methanol and ethanol are required for preparation
of stock solutions. Sensitivity is hampered by reagent instability, which can be minimised
through careful preparation against changes in temperature, light and moisture (Svobodová
& Gasparič, 1971; Svobodová et al., 1977a, 1977b).
1.4.2 Gold modified Gibbs sensor
Nanoparticles (NPs) as the sensing element can be synthesized in solution and operated at
ambient temperature. Gold NPs (Au-NPs) provide facile route toward synthesis, precise
control of formulation and low cost of synthesis and application (Kim et al., 2005). Noble
metals have desirable properties for use in sensors such as chemical resistance to oxidation,
chemical inertness in the bulk form, which is lost in the nanoform, leading to enhanced
catalytically. These properties are due to the nanosurfaces intrinsic properties, and ultrahigh
surface area, leading to excellent electrical response of the sensor at the nanoscale (Kim et al.;
2005).
An additional advantage in consideration of Au is its optical properties, for example, surface
plasmon resonance (SPR) of Au-NPs has widely been used in sensing bio-molecules (Nath &
Sensor Enhancement Using Nanomaterials to Detect
Pharmaceutical Residue: Nanointegration Using Phenol as Environmental Pollutant
425
Chilkoti, 2002; reviewed by Aslan et al., 2004). Au-NPs display wide variation in optical
properties including variation in the dielectric in part due to the nanoscale size and in part
due to the microenvironment (e.g. solvent) via surface plasmon resonance (SPR, Liz-
Marzan, 2004; Hornyak et al., 1997; reviewed by Link & El-Sayed, 2003) effects. This
property can enable the fabrication of tuneable colorimetric sensor for detection of different
environment pollutants, such as phenol which was used in our study. These fabricated Au-
NPs /Au-NRs can therefore have wavelengths which vary at least by an order of magnitude
from infra-red to visible spectrum of light. Likewise, Au nanoclusters can be fabricated with
precise size and absorption / emission properties (‘tunability’) through formulation of
surfaces of defined size (Aslan et al., 2004). This tunability can be achieved in the fabrication
process through judicious use of solvents, dispersing agents and synthesis parameters to
finely control surface size, layering and dimensionality. One application of Au-NP-based
sensors is detection of alterations in SPR, due to changes in the local environment (via
changes in the dielectric constant). The measured changes may be due to Au-NP-analyte
(e.g. phenol) interactions due to surface adsorption, or nanocluster formation or aggregation
due to analyte effects (J. Liu & Lu, 2004). The most common approach to tap into SPR
changes is through functionalization of the Au-NPs, for example, through incorporation of
gum Arabic (GA) or other long chain macromolecules, which have detergent-like properties
aiding in Au-NP size selection (Bashir & Liu, 2009) in aqueous-based devices Au-NPs
increase the specificity of sensor by binding of the sensing element to the sol-gel and
increasing electron tunneling to Gibbs reagent (as detecting agent) for detection of phenol.
1.4.3 Cyclodextrin as trapping agent
Cyclodextrins (CDs) are oligomers of D-glucose, which are linked through the 1→4 position.
The oligomers can have from six (-CD) to eight (-CD) residues linked end-to-end in cyclic
fashion. In this manner, CDs can form 3D like ‘bucket’ structures, which can facilitate CD
(host) and analyte (guest) interactions, including formation of non-covalent complexes,
particularly with alkali metal cations (Kutner & Doblhofer, 1992; Bashir et al, 2003). These
host-guest interactions can be exploited towards construction of trapping elements with in-
built selectivity (due to ring size) for certain sensor applications, with the most common CD
being -CD. CDs exhibit two distinct ‘faces’ including an ‘inner’ and ‘outer’ face. The
primarily face has a narrower entrance than the secondary face with the narrower/wider
sides being associated with primary/secondary hydroxyl groups, respectively. This size
difference can thus be exploited in group modification or decoration.
Decoration and end-capping of CDs, particularly -CDs has led to their application as
selective agents in chromatography, as tagging agents in pharmaceutics and also as host-
guest probes (reviewed by Gattuso et al., 1998, and Khan et al., 1998, and Engeldinger et al.,
2003) in biomedicine. The degree of bonding or interaction between the host-guest is
determined by hydrophobicity and van der Waals forces. CDs bind to the Gibbs reagent by
intermolecular forces, such as dipole–dipole forces. Other factors include expulsion of water
molecules from the core, hydrophobic interactions, van der Waals forces and hydrogen
bonding (Salústio et al., 2009). As such CDs have been used as separation surfaces or
chromatography media for the separation of drugs, or as encapsulation matrices for
enzymes or drugs (Sahoo et al., 2008) for drug interaction, catalytic reactions to occur under
normal or photoactive conditions (reviewed by Mallick et al., 2007) in addition to
enhancement of transport of molecules such as phenol in animal models.
New Perspectives in Biosensors Technology and Applications
426
1.5 Evaluation of sensor performance
Sensors should be a part of the environmental monitoring system and can provide early-
warning about build-up or release of pollutants or molecules of interest. Colorimetric
sensors meet the pre-requisites (of reliability and dynamic response), in addition to
appropriate operational parameters and as such have been utilised in studies for evaluation
of xenobiotic / environmental pollutants or chemicals of interest (Smyth et al., 2008) in
which a change in color upon interaction with the target substrate allow for substrate
determination, either quantitative or qualitative. In our study, indophenol, (the colored
complex), is formed from phenol reacting with 2,6-dichloro-p-quinone-4-chloroimide or 2,6-
dibromo-p-quinone-4-chloroimide. The sensor is evaluated for its performance, the detection
of phenol, reproducibility and stability at different known concentrations of this analyte.
1.6 Nanotechnology: definition, fabrication and characterization techniques
The design of an optimal sensor necessitates material characterization at the nanoscale level,
using nantechniological tools and resources. Nanotechnology revolves around fabrication of
materials of dimensions of less than 100 nm which are used in designing, constructing and
utilizing functional structures. Nanomaterials are synthesized or fabricated by top-down
and bottom-up processes. Common top-down processes of operation are to grind materials
into extremely fine powder, or via ball milling and lithographic processes. Bottom-up
methods of fabricating nanomaterials commonly employed include epitaxial deposition of
thin films and sol-gel fabrication. In this study, a bottom-up approach was used to prepare
the sensing element.
Most commonly used instruments for characterization of nanomaterials are ‘nano’ microscopy
related techniques, such as scanning electron microscopy (SEM), transmission electron
microscopy (TEM), atomic force microscopy (AFM) or spectroscopy based techniques, such
as X-ray powered diffraction (XRD), single-crystal X-ray diffraction (SCD), or energy
dispersive spectroscopy (EDX). With the advancement of technology, electron microscopy
has become primary tool for characterization of nanomaterials. In this study, all of the above
except SCD were used for nanostructural analyses of the phenol sensor.
Another important feature to evaluate the sensing element stability is measurement of the
electrokinetic potential (also known as zetapotential, ). is the difference in potential
between the fluid in the stationary and continuous phase respectively attached to the
dispersion phase. arises due to dissociation of atoms capable of producing ions, such as an
electrolyte on the surface of the nanoparticle and solvent ions at the surface. The net change
in charge on the nanoparticle will influence the distribution of ions in the local
microenvironment, for examples by either increasing the concentration of anions (if the
surface is positive) near the nanoparticle surface.
As a consequence of this counter charge (between the ions) an electrical double layer is
created near the nanoparticle surface micro-environment or interface. exists for colloidal
systems and indicates the stability of the colloidal suspension. Lower values, indicate that
the attractive cohesive forces dominate, leading to aggregation, whereas higher (±) values
indicate the contrary, leading to dispersion and nanoparticle stabilization. Colloid
suspensions with values from ±30 to ±40 (mV) are moderately stable with values of ±40 to
±60 (mV) exhibiting good stability. Electrophoretic mobility is often used as a starting
pointing in theoretical calculations to compare with values, which in turn are based upon
electroacoustics (Lyklema, 1995) measurements. Au-NPs (of diameter of 30-40 nm) are
suspended as a dispersion phase and the measurement of
is a valuable method of
determ
ining the stability of sol for the preparation of sensor.
Sensor Enhancement Using Nanomaterials to Detect
Pharmaceutical Residue: Nanointegration Using Phenol as Environmental Pollutant
427
2. Experimental approach
In this chapter, we are designing a nanoscaled sensor to overcome the shortcomings of
phenol sensor designs, limited detection resolution, and slow response time. The overall
experiments are carried out for the construction of phenol film sensor derived by sol method.
The structural characterization of the phenol sensor is by optical and nanomicroscopy and
colorimetric evaluation of sensor performance. Importantly, as previously indicated in the
introduction, this approach can also be applied to the detection of other organic environmental
/ pharmaceutical pollutants, along the same principles as described in the following sections.
All chemicals used are of analytical grade and were obtained from various vendors as listed.
2,6-dichloroquinomine-4-chlorimide (Fluka, St Louis, MO), gold (III) chloride trihydrate
(Sigma–Aldrich, St Louis, MO), -cyclodextrin hydrate (Alfa Aesar, Ward Hill, MA),
L-ascorbic acid (Fisher, Thermo scientific, Pittsburgh, PA), gum Arabica (M.P. Biomedicals,
Morgan Irvine, CA) were used without modification.
-CD interacts with the Gibbs reagents as the trapping element through a color change. This
color change is due to transfer of electrons from the Gibbs molecule to the phenol molecules.
In this research, the Gibbs reagent (also known as the ‘detecting/sensing agent’) and CD (as
the ‘trapping agent’) are used to detect for phenol. The detecting agent coupled to the
trapping agent, which is embedded in a sol-type matrix. Other biological sensing elements
(such as gold with trapping element such as: cyclodextrins (Janshoff et al., 2000), laccase,
(Y. Liu et al., 2006), dendrimers, (Manna et al., 2001) gold-nanotubes-chitosan, (Y. Liu et al.,
2006) or C
60
–sugar composites (reviewed by Pumera et al., 2007) with gold nanoparticles for
building a biosensor can also be utilized. In our case, we utilized cyclodextrin-Gibbs as the
trapping/detecting elements with Au-NPs. Separately, Au-NPs and Gibbs (with Arabica
Gum as the dispersing agent to minimise aggregation of the Au-NPs) towards enhanced
detection of phenol was also used in our specific case, although other general approaches
(e.g. Au-laccase-Gibbs) summarized above could have also been used.
2.1 Experimental procedure
Colorimetric studies have been implemented toward study of agents (Lante et al., 2000), as
potential detecting or sensing elements related to alterations in color upon interaction with
the target molecule. In our study, indophenol complex was formed from phenol reacting
with Gibbs reagent. The sensor was involved in a number of fabrication parameters
(described in § 2.2), which were extensively characterized using microscopy to determine
the nanostructure of the catalytic surface (described in § 2.3) and dynamic light scattering to
determine electrokinetic behavior of the colloidal suspensions (described in § 2.4). Once the
sensor was optimized in terms of limit of detection (LOD) of phenol through a trial-and-
error approach, its performance was evaluated through colorimetric measurement of
relative optical densities (described in § 2.5). The workflow of the nanofabrication and
performance evaluation of phenol sensor is summarized in Figure 1A.
2.2 Fabrication of sensor
The experimental workflow for construction of phenol sensor is shown in Figure 1B. Briefly,
the phenol sensor was created by dissolving different concentrations of Gibbs reagent in the
mixture of water and methanol (1:1 volume ratio, solution A). Solution A was mixed
continuously with a magnetic stirrer for 30 min. Gum Arabica (GA, as a surfactant) was
added (2 % by mass) to solution A to improve the uniformity of the resulting film and to
New Perspectives in Biosensors Technology and Applications
428
control the particle size of the sensing elements. To solution A, an aqueous solution of gold
(III) chloride trihydrate (HAuCl
4
·3H
2
O) and seperately an aqueous solution of ascorbic acid
(C
6
H
8
O
6
) at different concentrations were simutaneuously injected. The molar ratio of Au
3+
to ascorbic acid in solution A was controlled at 1:2 to produce 16 formulations with Gibbs
concentration ranging from 0.025-0.25 µM, phenol concentration from 6-50 Vol %, Au-NPs
concentration from 0.01-0.04 M to form the gold modified Gibbs hybrid (GGH) composite to
extend the detection range of the sensor (cf. Table 1, § 3.6). The precursor sols were heated
between 60 and 80 (C for 2 hrs to increase the sol viscosity, through evaporation of
methanol.
Fig. 1. The workflow employed in the fabrication and characterization of the sensor (A) and
schematic of the synthesis procedure and likely nanostructure (B).
2.3 Structural characterization
Advanced instrumentation techniques provide higher magnification for analyzing elemental
composition and particle size distribution of the sensing elements and structural changes
with addition of phenol. A phase contrast optical microscope (M 021, Olympus, Olympus
America Incorporation, Irving, TX) was used to determine the texture of the GGH sensor
and textural changes on interactions of the phenol substrate onto the surface of the sensor.
A field emission SEM (JSM-6701F, JEOL Ltd, Peabody, MA) was used to determine the
thickness and surface morphology of the sensor surface sol-derived phenol sensor. An
accelerating voltage of 10 kV, current of 5 µA and a high vacuum of 10
-5
Pa for specimen
chamber were employed to obtain the optimal resolution. An air-dried GGH phenol sensor
films were mechanically fractured using a diamond blade before mounting to the aluminum
(Al) stubs. A thin layer of Au was sputtered using Denton Vacuum LLC Desk IV Sputter,
(Moorestown, NJ) operating at a vacuum of 50 mTorr. Au coating was applied to improve
surface conductivity and prevent charging by the electron beam with high energy.
A TEM (Tecnai G
2
F20, FEI Company, Hillsboro, OH) was used to determine the fine
structure of the sol-derived GGH phenol sensor. Tungsten (W) crystal field emission gun
with extraction voltage of 4 kV was the source of electrons and electrons were accelerated in
the vacuum chamber to 200 kV and a high vacuum of 0.39 mbar was employed to obtain
optimal resolution. Samples were diluted and sonicated for 10 minutes for uniform
distribution of the particles and deposited onto carbon coated copper (Cu) grids. The crystal
Sensor Enhancement Using Nanomaterials to Detect
Pharmaceutical Residue: Nanointegration Using Phenol as Environmental Pollutant
429
structure was studied with electron diffraction resulting from either single crystal units or
polycrystals of the sensing elements. As a complementary approach of crystalline phase
identification, an Ultima III XRD with Cu diffractometer and visual XRD Jade 7 software
(Rigaku Americas Incorporation, Houston, TX) was used to determine the phase structure.
The operating voltage and current were controlled at 40 kV and 44 mA, respectively.
An AFM (Nanoscope III, Veeco Cooperation, Santa Barbara, CA) was used to determine the
topography, surface uniformity and three-dimension (3D) surface image of the GGH sensor.
Samples for analysis were greatly diluted diluted and loaded on to the surface of the mica
film. Point probe cantilevers (monolithic silicon AFM probe) were used for analysis in
tapping mode of operation. A drive frequency of 362.99 kHz and drive amplitude of 144.1
mV was applied for topographic analysis of the sensor surface.
2.4 Electrokinetic behavior of GGH colloidal suspension
ZetaPALS™ (Brookhaven Instrument Corporation, (BIC), New York City, NY) was utilized
for particle size analysis and colloidal stability of sol prepared. Diluted samples of the GGH
were analyzed for particle distribution and zetapotential measurement. The instrument was
operated at room temperature and the samples were analyzed for 8 runs and each run for 15
sec to give the best results. The angle of incidence light was 90 and wavelength of operation
was 659.0 nm. Results were analyzed with BIC particle sizing software and BIC
zetapotential analyzer.
2.5 Evaluation of sensor performance
In order to evaluate the sensor performance, a colorimetric study was undertaken to
determine the limit of detection (LOD), response time, and sensitivity of the sensor.
Formation of the indophenols with significant color changes was the key principle for
the colorimetric studies. Studies were conducted in a ceramic watch plate with 12 wells,
each well with a surface area of approximately 3.14 cm
2
. Various volumes and concentration
of Gibbs reagent and phenol buffer were added to observe the color changes (Table 1, also
cf. § 3.6). At intervals of 15 minutes, a photograph of the sample was collected with
computer assisted camera, and the whole experiment was conducted over 24 hr. The
collected samples were re-imaged after two weeks and the initial and two-week intensities
were compared. No difference was found, indicating that the samples are at least stable up
to two weeks. The significance of the background and maximum values were to enable
normalization of the different colors in grey-scale mode with background substraction. In
this manner, different intenties due to differences in background color could be
compensated for and different formulations directly compared. The grey-scale calibration
tablet provided ‘internal’ calibration allowing changes due to actual phenol to be
determined.
3. Results and discussion
The optical properties of the GGH sensor will be discussed first (described in § 3.1),
followed by electron and atomic microscopy morphological analysis (described in § 3.2-3.4).
The electrokinetic properties will be discussed next (described in § 3.5) followed by actual
sensor performance with literature comparison (described in § 2.4) and a conclusion on
sensor testing to close the chapter (described in § 4.0).
New Perspectives in Biosensors Technology and Applications
430
Sl. No Parameter 1:
Gibbs conc.
(µM)
Parameter 2:
Au NPs conc.
(M)
Parameter 3:
Phenol Conc.
(Vol %)
R.O.D = 1/O.D
1 0.025 0.01 6.67 50.21
2 0.025 0.02 7.69 48.41
3 0.025 0.04 8.33 51.37
4 0.05 0.01 15.38 58.06
5 0.05 0.02 10.00 56.51
6 0.05 0.04 12.50 53.84
7 0.10 0.01 14.28 59.85
8 0.10 0.02 25.00 63.98
9 0.10 0.04 14.28 62.72
10 0.15 0.01 20.00 54.50
11 0.15 0.02 25.00 56.80
12 0.15 0.04 40.00 64.31
13 0.20 0.01 16.67 44.31
14 0.20 0.02 25.00 44.25
15 0.20 0.04 33.33 41.56
16 0.25 0.01 50.00 39.62
Average back ground-174.02 Maximum value-255
Table 1. The measurement of relative optical density as function of fabrication variable.
3.1 Optical microscopic study on GGH phenol sensor
Optical microscopic images showing the morphological structures of the Gibbs reagent were
captured with and without the addition of the phenol. Figure 2A (100) micrographs show
cylindrical and linear nature of the Gibbs reagent (without AgNPs) which were sparsely
distributed. The cylindrical properties of these compounds increase the surface area for
exposure to phenol for better sensitivity. Figure 2B (400) indicates that the Gibbs reagent is
impregnated with Au-NP clusters. Au-NPs show uniformity in size and shape increase the
sensitivity of the sensor due to SPR and the rapid reaction rate between the two ((Gibbs) and
target molecule (phenol)) elements. Figure 2C (400) also shows the morphological changes
to the trapping element upon addition of buffered phenol, for the enhanced GGH sensor.
These morphological changes were recognized as loss of linear cylindrical structure of Gibbs
reagent polymer and of the indophenol complex, whereas Au-NPs remain intact, which
provides conspicuous color changes and consequently improves the LOD of phenol It can
be surmized that Au-NPs act as heterogeneous catalysts to increase the reaction rate
between phenol and Gibbs via lowering the activation energy and creating a new pathway.
The indopenol complex with various color schemes serves as a delicate indicator to display
the sensor performance.
Sensor Enhancement Using Nanomaterials to Detect
Pharmaceutical Residue: Nanointegration Using Phenol as Environmental Pollutant
431
Fig. 2. Optical microscopic photographs of gold-modified Gibbs hybrid sensing element and
sensing mechanism, A: the sensor image at 100 ; B: the sensor image at 400 ; C: the sensor
image at 400 after addition of buffered phenol analyte.
3.2 Scanning electron microscopic study on GGH phenol sensor
SEM micrographs also exhibit the linear cylindrical nature of the Gibbs reagent (Figure 3A)
coated with the spherical Au-NPs (before addition of phenol) and GHH sensing element
forms mesh-like network, upon addition. Au-NPs display near-spherical shape and their
particle sizes vary from approximately 30-40 nm in diameter. Although Au-NPs aggregate
and form several large-size clusters, it was determined that evenness of the GGH sensor
increased with electrical activity and resulted in improved sensitivity of Gibbs reagent.
Figure 3B is an SEM image of GGH sensing element which interacts with the phenol
compound when the buffered phenol analytes with various concentrations were introduced.
With the addition of phenol to the surface of the GGH sensor, morphological changes of
dissolution of porous nature of Gibbs was seen with the formation of the indophenol
(colored complex) and loss of mesh work was characterized. Therefore, the formation of the
indophenol becomes a delicate indicator to display the regional differentials in color and
morphology of the GGH sensor. In turn, this will enhance the sensor sensitivity and its
LOD, which is classified by colorimetric values.
Fig. 3. The SEM top view morphological analyses of sensor, A: the GGH morphology before
addition of phenol and B: the GGH morphology after addition of phenol.
3.3 Transmission electron microscopic study on GGH phenol sensor
TEM images also depict the inner structural morphology with high spatial resolution of the
film as indicated by SEM. TEM images (Figure 4A-D) of GGH depict linear and cylindrical
New Perspectives in Biosensors Technology and Applications
432
nature of Gibbs reagent with uniform Au-NP coating. Linear nature of the polymer
synthesized in sol method possess better sensitivity for the detection of phenol because large
area of contact for electron exchange and consequently for the indophenol complex formation
(Figure 4A). Loss of network structure of GGH sensing element was observed upon
substrate inclusion via a chemical reaction of the substrate phenol and detecting element,
the Gibbs reagent (Figure 4B). These changes were in consistent with the optical and SEM
characterization techniques. The significant morphological changes enhanced the limit of
detection of the GGH sensor, which allows us to develop sensor with high performance.
Figure 4B also depicts the size and shape of Au-NPs of 10-15 nm in diameter. Au-NPs were
agglomerating slightly and possess surface plasma resonance. The lattice fringe (Figure 4C)
indicates ultrafine Au-NPs were otained. The ring pattern of Ag-NPs (Figure 4D) results
from polycrystals, suggesting high degree of crystallinity was acheived. The indexing of
ring pattern suggests that the face-center cubic Au (PDF 00-004-0784, a 0.408 nm, = 90 )
was obtained. This observation is confirmed by XRD analysis (Figure 4E-insert). However,
the Gibbs reagent was vaporized under high energy beam of electrons, which is the reason
why no ring pattern or electron diffraction was observed. The XRD pattern indicated that
the Gibbs reagent (Figure 4E) is well-aligned with the standard 2,6-dichloro-p-
benzoquinone-4-chlorimine (C
6
H
2
Cl
3
NO, PDF 25-1917) using lower energy.
3.4 Atomic force microscopic study on GGH phenol sensor
AFM images depicted the surface morphology and measured the size of the Au-NPs. Figure
5A showed the sparse distribution of the Au-NPs and figure 5B represents the topography
of sensor film active surface at nano-range. Size of coated Au-NP cluster in this study was
measured as approximately 30-40 nm in diameter. The Au-NPs was coated on the surface by
Gibbs reagent. Since AFM studies the top surface layer of sensor film, it depicts the actual
layer which is in contact with phenol but it cannot reveal the inner composition and build
up of sensor. Au-NPs were measured to have an effective diameter of 12 nm for Au by itself.
With the addition of gum Arabic (GA) to the Au-NPs, increase in the size of NPs was
observed with an average cluster dimension of 169.6 nm and polydiversity of 0.267
(dimensionless) for the cluster of coated particles. Analysis shows the mean particle size of
GGH was 485 nm and the distribution of (up to 20) particles (polydiversity of 0.05), which
was consistent with the SEM findings.
3.5 Electrokinetic behavior of GGH colloidal suspension
The measured zetapotentials (, with ZetaPALS™) of GGH colloidal suspension were
averaged at -23.0 mV. The negative sign indicates repulsive forces between Au-NPs and
GGH preventing flocculation and aggregation of particles and the numerical value indicates
samples had colloidal stability (Figure 6). results indicate that the GGH colloid is stable
and agglomeration is successfully prevented using GA as the surfactant. The electrokinetic
study also confirms that nano-dispersion of Au with size of 10-15 nm (also found by TEM,
see Figure 5B) has been achieved. Fluctuations in the measured value of during the
experiment were not observed; therefore the measurements were time independent in the
present study, which confirms the stability of GGH colloid. Bottom up (sol-gel) green
synthesis of Au-NPs modified Gibbs reagent has been developed to prevent the aggregation
of the particles during synthesis. To synthesised nanoparticles exhibited high degree of
stability (due to the high measured , i.e. steric effects > van der Waals forces). The GA
Sensor Enhancement Using Nanomaterials to Detect
Pharmaceutical Residue: Nanointegration Using Phenol as Environmental Pollutant
433
Fig. 4. TEM images of sensing elements, A: morphology of gold-modified Gibbs hybrid
sensing element; B: morphology of gold-modified Gibbs hybrid sensing element after
addition of buffered phenol analyte; C: lattice fringe of gold-modified Gibbs hybrid sensing
element; D: TEM ring pattern of nanogold; E: corresponding X-ray diffraction (XRD) pattern
of gold-modified Gibbs hybrid sensing element with standards for gold and Gibbs.
New Perspectives in Biosensors Technology and Applications
434
Fig. 5. AFM Images of sensor topology, A: the forward scan of surface 2D topology of gold-
modified Gibbs hybrid sensing element; B: the 3D image of gold-modified Gibbs hybrid
sensing element to determine the sensor thickness.
polymers are adsorbed onto the particle surface and cause van der Waals forces weakening.
Significant steric repulsion prevents Au-NPs from being adhered and the particle surfaces
are separated as a result.
The main goal during the synthesis phase was to control the particle size and its structure,
followed by nanocharacterization of the nanoparticles. These particles were synthesised
using a bottom-up colloidal chemistry approach. Au-NP size was controlled through
incorporation of GA as the dispersing agent, which also aids wetting of the metal salt and
distribution of the surface of the GGH composed of a continuous Au layer which was then
deposited onto the Gibbs cluster successively.
Fig. 6. Zetapotential of gold-modified Gibbs hybrid colloidal suspension, of a number of
replicates ( n=1-6).
3.6 Evaluation of GGH sensor performance
Colorimetric evaluation of the phenol sensor reagent was performed and color changes of
different concentrations of phenol and Gibbs reagent in different dilutions at different
intervals of time were captured (images not shown). Initial color was developed within one
hour and changes in intensity of color were different in all wells with the passage of time.
Sensor Enhancement Using Nanomaterials to Detect
Pharmaceutical Residue: Nanointegration Using Phenol as Environmental Pollutant
435
Using the calibration grey-scale tablet, the minimum intensity value was set to zero and the
maximum optical density set to 255, from which the optical density (OD) was calculated as:
OD = log[
(255-p)/(255-x)]
where ‘p’ stands for average background correction for the well-plate(s), ‘x’ for mean
intensity of color converted to grey-scale. The measurements were recorded as relative
optical density (ROD) values, where
ROD = 1/OD
ROD of the 12 wells (numbered 1-12) at various intervals was calculated based upon the
intensity of color development of each well, converted to grey-scale. Measured intensties
from wells 13 to 16 were used for background correction and average background
determination to calculate the p-value. Evaluation of the ROD from the different
formulations at different intervals was examined, indicating that the variable which
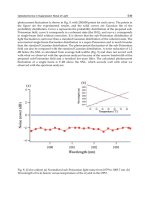
influenced the measured ROD the most was phenol concentration. The observed color
change was almost instantaneous (~ 1 sec, various parameters are summarized in Table 1,
including color intensity recorded every five minutes from zero minutes to twenty-four
hours (data not shown)) was standaridized to one hour. The calibration plot at one hour for
different sensor formulations is shown in figure 7. It was found that optimal parameters
were having an incubation time of five minutes for phenol to Gibbs reagent, at a molar ratio
of 4:1 between Gibbs reagent to phenol and 1:1 molar ratio between Gibbs reagent and Au.
Using various volumes of buffered phenol, the LOD was measured in terms of
concentration as 0.1 M, while the variation in measured ROD was 36%. The ROD values
(determined as the (minimum measured intensity value / maximum intensity value) x 100)
Fig. 7. The sensitivity study using various concentration ratios of Gibbs vs phenols, noting
three formulations were selected to demonstrate the linearity of sensitivity.