Optoelectronics Devices and Applications Part 6 pptx
Bạn đang xem bản rút gọn của tài liệu. Xem và tải ngay bản đầy đủ của tài liệu tại đây (930.38 KB, 40 trang )
0
Applications and Optoelectronic Methods of
Detection of Ammonia
Paul Chambers, William B. Lyons, Tong Sun and Kenneth T.V. Grattan
City University, London
United Kingdom
1. Introduction
This chapter describes applications of ammonia in agriculture, pharmaceutical and
environmental industries and optoelectronic methods of its detection.
In Section 2 the discovery, the chemical structure, reactivity and application of ammonia are
reviewed. Applications in agriculture, cleaning products, pharmaceutical industries, beauty
products, the benefits and dangers of ammonia to human health, environment and industrial
processes are also discussed.
Section 3 describes the rotational-vibrational molecular processes that cause the optical
absorption of light in the infrared spectrum. The infrared and ultraviolet absorption spectra
are also shown. Data relating to the absorption of light by ammonia at ultraviolet wavelengths
is also shown.
Existing optical ammonia gas detection methods that utilise lasers and broadband sources and
the evanescent field of an optical fibre are described in Section 4. This includes a discussion
of optical sources, optical fibers, gas cell designs and detectors that are used in optoelectronic
gas sensing systems.
In section 5, the limiting effects of fundamental noise sources, such as photon noise, resistor
noise and optical source noise on sensor sensitivity are described. The selective performance
of optoelectronic gas sensors is also discussed, i.e. the discrimination of the sensor to different
gases.
2. Ammonia: the chemical
The ammonia molecule consists of one nitrogen atom covalently bound to three hydrogen
atoms, the pyramidal configuration is shown in Figure 1. The structure of the covalent bond
results in the compound being neutral in charge, but there remain two unfilled electron pairs
in the valence band. As ammonia has an unfilled valence band, it is a weak base, with a Ph. of
approximately 12. Ammonia exists in the gas phase in the in the environment, as the boiling
point of ammonia is -33.35
◦
C.
The production of ammonia by the distillation of animal hoofs, horns and hide scraps is
recognised as a very old method of the extraction of ammonia. Written references to the use of
ammonia date back to the thirteenth century in Catalan literature (Miller (1981)), while Felty
(1982) noted that the name ammonia is derived from the salt sal-ammoniac. Sal-ammoniac
(salt comprised of ammonium chloride) or salt of Ammon was named after the Egyptian chief
10
2 Optoelectronics / Book 2
Fig. 1. Diagram of ammonia molecule consisting of 1 nitrogen and 3 hydrogen atoms which
are covalently bound.
God Ammon, as it is possible that it was extracted from camel dung near the Temple of Jupiter,
in ancient Egypt (in present day Libya) in around 332 B.C
In Miller (1981), it is also described how Johann Kunkel van Lowenstern noticed that ammonia
gas could be produced by the addition of lime to sal-ammoniac. In 1773 Joseph Priestley
was the first chemist to identify and extract pure gaseous ammonia by applying heat to
aqueous ammonia mixed with sal-ammoniac. Using the Haber-Bosch process of nitrogen
fixation(Howard & Rees (1996)), ammonia is now the most widely synthetically produced
chemical. Ammonia reacts with acids or neutral substances, such as water, sulfuric acid and
nitric acid. These reactions result in the formation of anhydrous ammonia, which is acidic,
ammonium sulfate and ammonium nitrate. Compounds in the Amine functional group are
derived from the ammonia molecule, where one, or more, of the hydrogen atoms is replaced
with an alternate chemical arrangement.
Ammonia currently has a wide range of uses and applications. When used in agriculture,
ammonia forms a source of nitrides in fertilisers which promotes plant growth. In cleaning
products the action of ammonia hydroxide, as an acid , aids in removing contamination from
surfaces. In hair conditioners, ammonia aids the blending of colour into hair. Pharmaceutical
processes use ammonia as a buffer to control the P.H. level for solution preparation.
Dissociated ammonia atmospheres are employed in steel processing for the annealing of
steel to aid corrosion resistance (Levey & van Bennekom (1995),Samide et al. (2004)). Chilled
ammonia is used, as a binding agent, to remove carbon dioxide from the exhausts from fossil
fuel burning power plants (Darde et al. (2008)).
While ammonia gas is necessary for these processes, it is dangerous to people in excessive
concentrations if inhaled, as anhydrous ammonia is corrosive (Close et al. (1980)). Ammonia
is also destructive when present in semiconductor fabrication facilities (Sun et al. (2003)). For
safety reasons and process monitoring applications, it is therefore important to monitor the
concentrations of ammonia and optoelectronic methods can provide an accurate means of
achieving this.
3. Optical absorption spectrum of ammonia
The literature relating to the vibrational and electronic optical absorption spectra is reviewed
in this section. This includes data relating to the infrared and ultraviolet absorption spectra.
3.1 Infrared absorption s pectrum
Incident optical radiation on the ammonia molecule causes vibrations of the inter-atomic
distances between the nitrogen and hydrogen atoms in the pyramidal structure. This causes
190
Optoelectronics – Devices and Applications
Applications and Optoelectronic Methods of Detection of Ammonia 3
the partial absorption of optical power at characteristic wavelengths, including the original
vibration and higher frequency (shorter wave-length) harmonics, resulting in the absorption
spectrum. The rotational-vibrational modes, as reviewed by McBride & Nicholls (1972) are
shown in Figure 2. The non-degenerate symmetric v
1
and v
2
vibrational modes shown in
Figures 2(a) and 2(b), preserve the pyramidal shape, while the degenerate v
3
and v
4
modes,
shown in figures 2(c) and 2(d) distort the three dimensional shape.
(a) (b)
(c) (d)
Fig. 2. The rotational-vibrational modes of the ammonia (NH
3
)molecule
(a): v
1
vibration
(b): v
2
vibration
(c): v
3
vibration
(d): v
4
vibration
The optical absorbance of a gas is defined in terms of its cross-section. The absorbance
cross-section is denoted by σ
(λ). The Beer-Lambert Law, which is shown in Equation 1,
describes the relationship between the incident optical power, I
0
, and the transmitted power
intensity, I
1
, at each wavelength, λ, in terms of the absorbance cross-section, σ(λ),gas
path-length, l, and gas concentration, c.
ln
I
0
I
1
= σ(λ) × l × c (1)
The cross-sections of atmospheric gases are contained in the HITRAN database. While
the database is updated, with the last update in 2008 (), the last
update of the ammonia gas data was in the 1986 edition (Rothman et al. (1987)). The articles
documenting the molecular vibrations of ammonia and their characteristic wave-lengths are
detailed in Table 1.
The cross-sectional absorbance spectrum up to 8μ m using data from the Hitran database,
which was detailed in Table 1, is shown in Figure 3. It can be observed that the maximum
191
Applications and Optoelectronic Methods of Detection of Ammonia
4 Optoelectronics / Book 2
Wavelength Absorption Band Reference
1.89–2.09 μm v
1
+v
4
Brown & Margolis (1996)
v
3
+v
4
6.00 μm 2v
2
/v
4
Cottaz et al. (2000)
5–8 μm 3v
2
-v
2
v
2
+v
4
-v
2
Cottaz et al. (2001)
4v
2
-v
2
4.00 μm v
1
-v
2
v
3
-v
2
v
1
Kleiner et al. (1999)
3 μm v
3
Guelachvili et al. (1989)
2v
4
4 μm 3v
2
/v
2
+v
4
Kleiner et al. (1995)
v
1
+v
2
1.89–2.09 μm v
2
+v
3
Urban et al. (1989)
v
2
+2 v
4
Table 1. The rotational-vibrational coupling of ammonia gas that gives the infra-red
absorption of ammonia gas
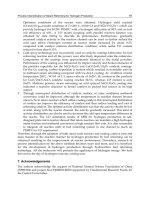
Fig. 3. The infrared absorption cross-section of ammonia gas. The data were selected from
the 1986 edition of the HITRAN database (Rothman et al. (1987)), which includes the data
described in Table 1
cross-section absorbance in this wavelength range is approximately 7
×10
−20
cm
2
molecule
−1
at around 6 μ m.
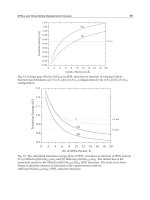
3.2 Ultraviolet absorption spectrum
Ammonia also absorbs optical power at ultraviolet wavelengths. The ultraviolet electronic
absorption is caused by the interaction of light with electrons in the valence band of the
ammonia molecule (Burton et al. (1993)). The absorption spectrum of ammonia is shown in
Figure 4. The data was obtained from the results of Cheng et al. (2006) that are contained in
the Mainz UV spectral database (Keller-Rudek & Moortgat (2006)).
The peak absorbance shown in Figure 4 inthe ultraviolet absorption spectrum is appoximately
2
×10
−17
cm
2
molecule
−1
. This is around one thousand times greater than was the case in the
192
Optoelectronics – Devices and Applications
Applications and Optoelectronic Methods of Detection of Ammonia 5
Fig. 4. Ulraviolet absorption cross-section absorption spectrum of NH
3
.Absorption
spectrum data shown were taken from Cheng et al. (2006)
infrared spectrum. As the absorbance cross section is in the exponent of Equation 1, this leads
to a difference in the gas absorption of many orders of magnitude.
4. Optical methods of detection
This Section reviews a range of optoelectronic methods for the detection of gases including
how they are applied for the detection of ammonia.
Early optical gas analysers relied upon the photoacoustic properties of gases, at the time
this was referred to as the “Tyndall-Röntgen effect". The “Tyndall-Röntgen effect" in gases
is analogous to the “Bell effect", which is the development of an audible sound arising from
the intermittent exposure of a solid or liquid to radiation. Early gas sensing systems that
utilised the photoacoustic effect were developed before, during and since World War II, in
Britain, the U.S.S.R. and Germany. An example of an early gas detection method due to
Veingerov (1938), which is described in Hill Hill & Powell (1968), is shown in Figure 5. The
gas analyser, which was named an “optico-accoustic" analyser, operated by passing intensity
modulated optical radiation from a Nernst Glower Source through a highly polished tube to a
telephone receiver. The pressure variations induced by the intermittent optical beams resulted
in a differing expansion of the gases present in the sample gas cell. This, in turn, induced the
generation of acoustic tones that were picked up by the telephone earpiece (microphone).
These tones were indicative of the gases present in the sample gas cell. The branch-resonator
enabled the pressure fluctuations developed to be amplified, so that the detected signal could
be enhanced.
Concurrently with the work by Veingerov, Luft developed a null-balance arrangement (see
Hill & Powell (1968)). This, and systems developed from it, were later referred to as LIRA
(Luft Infra-Red Analyser, Luft (1947) ) type analysers, an example of which is shown in Figure
6.
The systems operate by passing two alternately chopped optical beams through a reference
gas cell and a sample or measurement gas cell to a detector. Initially the device was
193
Applications and Optoelectronic Methods of Detection of Ammonia
6 Optoelectronics / Book 2
Fig. 5. An early “optico-acoustic" gas detection arrangement due to Vengerov (see references
Hill & Powell (1968); Veingerov (1938))
"null-balanced" by filling both the referenceand sample cells with a gas that had no absorption
lines in the spectrum of interest and equalising the intensity of the optical beams by adjusting
a blocking trimmer screw. The insertion of the sample gas into the sample or measurement
cell leads to a signal modulation at the detector which is proportional to the target gas
concentration in the sample gas. It was found that, by the insertion of a reference gas cell
in series with the measurement gas cell, the selectivity of the system to the target gas could be
improved. The LIRA system was able to detect CO
2
concentrations of less than 10 ppm (parts
per million).
Hill & Powell (1968) also described the development of early gas analysers that were
manufactured during the 1950s and 1960s and the development of early infra-red detectors.
Goody (1968) explored the possibility of selectively detecting a specified target gas
by a correlation technique. Goody introduced a pressure modulated “cross-correlating
spectrometer", a device which involved passing light from an optical source through two
sequential gas cells and an optical filter, before impinging on an optical detector, see Figure
7. The first gas cell contained the gas volume to be analysed (the measurement cell) and
the second contained only the target gas (the reference cell). By modulation of the target
gas pressure within the reference gas cell, a modulation of the detected optical power at the
output of the measurement gas cell was observed. This magnitude of the output modulation
was related to the concentration of target gas within the measurement gas cell. The method
showed high rejection of drifts in source power and had high rejection of contaminant gas. A
NH
3
sensor based on this method was found to be 140 times less sensitive to N
2
O contaminant
gas, even though the spectral absorption of N
2
O is significantly stronger than the spectral
absorption of NH
3
in the band used.
Taylor et al. (1972) provide details of a similar system, intended to measure remotely (from a
satellite) the temperature of the upper atmosphere from the spectral transmission of CO
2
.The
system gathered light reflected from the earths atmosphere, and passed it though a pressure
194
Optoelectronics – Devices and Applications
Applications and Optoelectronic Methods of Detection of Ammonia 7
Fig. 6. A Null-Balance Lira (Luft Infra-Red Gas Analyser) gas detection system Hill & Powell
(1968)
Fig. 7. Pressure Modulation Spectroscopy system (reproduced from Goody Goody (1968))
modulated reference gas cell to a detector. Their system showed a sensitivity of 1
◦
C. This
method utilised the spectral emission of CO
2
at 15 μm.
A reported method of modulating the transmission of the reference cell was that of Stark
modulation. This is the line-splitting effect that results when a high electric field is applied
to a gas. It is only effective on molecules having a significant dipole moment, e.g. H
2
O, CH
4
etc. Edwards & Dakin (1993) investigated the use of Stark modulation for the detection of
ammonia and water vapour, both of industrial significance, using optical fibre-based systems.
195
Applications and Optoelectronic Methods of Detection of Ammonia
8 Optoelectronics / Book 2
This system demonstrated the use of optical fibres for gas detection, an area which is now
discussed in detail.
4.1 Optical fibre implementations
Optical detection systems using optical fibres offer a number of advantages over bulk optical
sensing systems. This section develops the review by Dakin and Chambers (2004) to show
the application of sensors using an optical fibre for the detection of ammonia. The principal
advantage is that a robust passive sensing head may be sited remotely from the monitoring
station, which is a useful feature in severe environments. This also allows for the development
of multiplexed networked systems, where a single interrogation unit can monitor many
low-cost passive sensing heads via a predictable propagation medium (i.e. the optical fibre).
Conventional silica fibres have the disadvantage that transmission is restricted to the visible
and near-infra-red region (0.6 μmto2.0μm). Fluoride and other fibres may be used to
extend the operation of these sensors further into the infra-red, allowing accurate detection
of gases with infra-red absorption in the mid- and far-infra-red. Unfortunately, these fibres
are expensive and less robust. Optical fibre sensors are also generally believed to be safe for
use in explosive atmospheres. However, the safety of optical fibre sensors is not unqualified,
as it has been established that in the case of very high powers, i.e. of the order of 100 mW,
or greater in multi-mode fibre, explosive risks may present themselves (Hills et al. (1993);
Zhang et al. (1992)). Conventional optical fibres have a very small acceptance aperture, which
severely restricts the amount of light that can be coupled into a fibre. Thus the power launched
into optical fibres from high-radiance near-infra-red (NIR,
∼0.7 μm-∼1.5 μm) Light Emitting
Diodes (LEDs) is rarely above 1mW, even when large core optical fibres are used, and by
comparison the spectral radiance of incandescent filament lamps is usually at least an order
of magnitude less. Longer wavelength LEDs (
>∼1.5 μm) often have a lower spectral radiance.
As the launched power is relatively low, sensitive light detection systems are required to
produce operational sensors. With laser sources, there is no difficulty in achieving launch
efficiencies in excess of 80% into multi-mode fibres. Consequently high powers can be
launched, and the detection system constraints are eased substantially.
It was realised that narrow-linewidth diode lasers could readily be used in fibre-optic
environmental detection systems. Inaba et al. (1979) suggested the use of a dual-wavelength
laser to realise a differential absorption method that could be used over many kilometres of
low-loss optical fibre in cases where it was necessary to locate the sensing head remotely from
the measuring equipment. This typically involved the comparison of the received powers at
two, or more, different wavelengths, each having passed through a remote measurement gas
cell, so that the differential absorption of the two wavelengths by the gas sample could be used
to infer the concentration of the target gas. The method required that the target gas possessed
suitable gas absorption bands within the spectral transmission window of the optical fibre.
Culshaw et al. (1998) have surveyed some of the system topologies that may be used with
laser-based optical gas detection systems and quantified the expected system sensitivities,
which are of the order of less than 1 ppm. Stewart et al. (2004) and Whitenett et al. (2004) have
realised some of these topologies, which included a Distributed FeedBack (DFB) wavelength
modulated laser cavity ring-down approach that showed a methane detection sensitivity of
50 ppm.
A laser-based detection system for the detection of NO
2
gas (which is an industrial hazard
and common environmental pollutant) was developed by Kobayashi et al. (1981). This was
196
Optoelectronics – Devices and Applications
Applications and Optoelectronic Methods of Detection of Ammonia 9
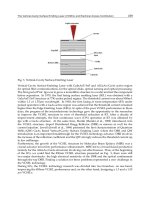
Fig. 8. Schematic of a differential fibre-optic detection system (redrawn from a diagram in
Hordvik et al. (1983)).
achieved by splitting light, from an Ar-ion multi-line laser, into two paths, one passing
through a measurement gas, and the other being transmitted directly to the measurement
unit as a reference signal. The detection unit contained two filters to separate the two chosen
laser lines, and these were then detected on separate optical receivers. One of these chosen
laser lines coincided with a strong absorption line in the NO
2
absorption spectrum, whilst the
other absorption line was somewhat weaker, hence giving a differential absorption method,
by which the concentration of NO
2
in the measurement cell could be found. The system had
an estimated detection limit of 17 ppm. The advantages of this dual-wavelength system were
that the measurement was dependent on neither the optical power spectrum from a single
source, which could drift, nor the system transmission, which could be affected by optical
alignment, surface contamination, etc. It was realised that the selection of light sources used
in this type of detection system was not necessarily limited to lasers, but broad-band sources
such as filtered incandescent lamps or LEDs could also be used.
Hordvik et al. (1983) developed a fibre-optic system for the remote detection of methane gas
(CH
4
), see Figure 8. This system used a halogen lamp light source, which was alternately
chopped into two separately filtered paths. One path was passed through a narrow-band
interference filter, centred at the same wavelength as a strong absorption band of CH
4
(Q-branch centred at 1.666 μm), whilst the other filter covered a broader spectral range, and
consequently had lower average absorption. These two complementary-modulated beams
were combined by means of a fibre-coupler, with two output ports. Light from one was passed
through a measurement cell to an optical detector (the measurement signal), and light from
the other was passed directly to an optical detector (reference signal). By comparison of the
optical powers in the narrow-band and broadband beams of the light that had and had not
passed through the measurement cell, it was possible to calculate the CH
4
concentration.
A somewhat similar system based on the use of optical fibres and optical fibre couplers, but
with the innovative use of compact LED light sources, was developed by Stueflotten et al.
(1982). The schematic of the system is shown in Figure 9. Again, two different optical filter
wavelengths were used, to give differential attenuation in strong and weak gas absorption
regions. This was proposed for remote measurement in hazardous industrial environments,
such as off-shore oil platforms. The systems above developed by Hordvik and Stueflotten
both had a reported detection limit of approximately 5000 ppm (0.5% vol/vol) of methane.
4.2 Sensing using inelastic processes
Other forms of spectrophotometric processes rely on Raman scattering. A Raman scattering
gas detection method is now briefly reviewed.
197
Applications and Optoelectronic Methods of Detection of Ammonia
10 Optoelectronics / Book 2
Raman scattering involves the inelastic scattering of light, i.e. first absorption and then
delayed re-emission of light at a different wavelength to that incident on the material. The
Raman process represents a form of scattering in which an incident photon may gain energy
from (the anti-Stokes Raman process), or donate energy to (the Stokes Raman process) a
vibrational or rotational energy level in a material. This produces a re-emitted photon of
different energy and, hence, of a different wavelength. A method of detection that exploits
Raman spectroscopy was developed by Samson & Stuart (1989) using the detection system
shown in Figure 10. Raman scattering in gases is generally very weak, but the emission
usually occurs in a well defined spectrum.
In the system developed by Samson and Stuart, the laser excites the gas and a mirror is
used to reflect the incident light back through the interaction zone. Another concave mirror
reflector doubles the level of Raman light received by the collection lenses. The alternative
inelastic scattering process of fluorescence is rare in gases, and consequently is not commonly
used for optical gas sensors, but fluorescence cannot be ignored when using Raman sensing,
as it can cause crosstalk if it occurs in optical glass components or at mirror surfaces.
Fortunately, Raman lines for simple gases are narrow compared to fluorescence emission
which is usually relatively broadband. Raman detection systems may be employed to monitor
the concentration of ammonia and ammonia based compounds in industrial atmospheres
(Schmidt et al. (1999)).
4.3 Comb filter modulator for partially matching several spect ral lines
Instead of detecting a gas using a single line of its absorption spectrum, or using a broadband
source to cover many absorption lines, there are advantages in using some form of optical
“comb" filter, with several periodic narrow transmission windows, in order to match several
Fig. 9. Schematic of the differential fibre-optic detection system (redrawn from a diagram of
Stueflotten et al. (1982))
198
Optoelectronics – Devices and Applications
Applications and Optoelectronic Methods of Detection of Ammonia 11
Fig. 10. Schematic of a gas sensor using Raman Scattering
(Redrawn from Samson & Stuart (1989))
spectral lines simultaneously. Such a comb filter can be scanned, correlated or wavelength
modulated, through a set of gas lines to give an intensity modulation. The method has
the advantage that it may allow improved selectivity, as a synthetic multiple-narrow-line
comb-filter spectrum allows simultaneous measurement on several spectral lines. This
reduces interference effects, which can cause complications with laser sources. A method of
doing this, with a scanned Fabry-Perot comb filter, has been demonstrated (Dakin et al. (1987);
Mohebati & King (1988)) with application to methane detection. Dakin et al. implemented a
system that passed light sequentially from a source through a Fabry-Perot interferometer to
a detector. By changing the spacing of the plates of the interferometer the transmission of
fringes of the interferometer were tuned to match the absorption spectrum of the methane
target gas. Dakin et al. (1987) reported a sensitivity limit of 100 ppm. The disadvantage of
the Fabry-Perot filter is that it has a regular frequency spacing, whereas the gas absorption
features are not normally equally spaced. A variation of the method is to use the correlation
spectroscopy complementary source modulation technique with a filter that replicates the
gas transmission spectrum. Recently in Vargas-Rodriguez & Rutt (2009) have demonstrated
that, using this approach at 3.3 μ m, a minimum detection level of 0.023 % methane could be
detected with a 1 s integration time.
4.4 Photoacoustic ammonia gas detection
A wavelength modulation can also be used for a photo-acoustic optoelectronic gas
concentration measurement. Kosterev & Tittel (2004) demonstrated a noise limited detection
of 0.65 ppm v. The system operated by the wavelength modulation of light from a 1.53 μm
laser source with a quartz tuning fork. The tuning fork vibration frequency was twice that of
the modulation of the laser source. The detected current from the optical detector could then
be demodulated to find the gas concentration.
4.5 Sol-gel ammonia detection
Gases, including ammonia, may also be detected by the application of a chemical indicator
dye to the surface of an optical fibre. The Sol-gel process enables the deposition and
immobilisation of the chemical dye on to the surface of the optical fibre. The dye then absorbs
199
Applications and Optoelectronic Methods of Detection of Ammonia
12 Optoelectronics / Book 2
light when in the presence of the gas to be sensed. The process can be applied to a wide
range of chemical processes, however, the interactions of the dye with contaminant gases and
humidity must be carefully considered (Malins et al. (1999)).
4.6 Ultraviolet optical det ection of ammonia
The relatively intense ultraviolet absorption spectrum of ammonia, which was shown in
Section 3.2, enables precise and selective detection of ammonia gas. Chambers et al. (2007)
have demonstrated that ammonia gas can be detected at levels of ppm with low-cost
ultraviolet LED light sources and detectors. Manap et al. (2009) has shown that the ultraviolet
measurement was highly selective as contamination gases were not identifiable. With the
recent development of these systems, it is necessary that the performance ultraviolet optical
components are analysed (Eckhardt et al. (2007)).
5. Sources of noise
The accuracy of an optoelectronic sensor is limited by the selectivity and sensitivity of the
sensor. These design considerations are now discussed.
In the design of optoelectronic gas sensor, it is important that the sensor measures solely the
target gas that it was designed to measure. This is termed the selectivity of the sensor. In a
gas absorption sensor selectivity issues can arise from contaminant gases, or the fouling of
optical components, with an absorption spectrum that overlaps the gas to be sensed in the
wavelength range of the optical source. Usually, the careful design of a sensor can eliminate
this issue.
The measurement of an optoelectronic system will always be limited by a form of fundamental
noise. These noise sources include resistor noise, photon noise, source noise and, in
photo-acoustic systems, acoustic noise. Optical noise sources will now be discussed with their
impact on measurement.
With optical absorption gas sensors it is necessary to accurately measure the optical power
transmitted from the measurement gas cell. The output from the measurement detector
photodiode is an electrical current that is proportional to the incident optical intensity. When
broadband optical sources are used, the transmitted spectral power density is usually small, of
the order of nW nm
−1
, making it necessary to use a transimpedance amplifier to transform the
detector current into a measurable voltage. This makes it necessary to use a sizeable feedback
resistor, which is a significant source of thermal noise. This is usually the dominant source of
noise in sensors with a low output optical power level. The thermal voltage noise, V
therm al
,
using the thermal noise equation is given by:
V
therm al
=
4kT R
SO
B,(2)
where k is Boltzmann’s constant, T is the resistor absolute temperature in kelvins, R
SO
is the
parallel resistance of the photodiode shunt resistance and feedback resistance and B is the
post-detection noise bandwidth.
Shot noise (photon noise) describes the random arrival of photons at a detector and is
described by Poisson Statistics. Photon noise is expressed by the following equation:
I
Shot Noise
=
2qI
Sig
B,
200
Optoelectronics – Devices and Applications
Applications and Optoelectronic Methods of Detection of Ammonia 13
where q is the electronic charge, I
Sig
is the photocurrent generated and B is the post-detection
noise bandwidth. With a shot noise limited system has reached the fundamental noise floor.
The noise from an optical source is due to source related intensity or phase fluctuations.
These variations have been analytically quantified and described by Tur Tur et al. (1990). They
derived a method for calculating the relative intensity noise from an optical source.
S
in
( f)=
0.66I
2
0
Δv
(3)
Tur et al. (1990) showed that the optical source noise may be described by Equation 3, where
Δv is the FWHM bandwidth (in Hertz) of the emission from the source, and the optical power
from the source is I
0
. Source noise tends to be the dominant source of noise in laser coupled
gas detection systems.
6. Conclusions
As the globally most produced chemical, with a range of applications in agriculture, cleaning
products, pharmaceutical industry, steel processing and carbon dioxide capture processes
ammonia is vitally important to modern life. The monitoring of ammonia concentration is
essential as, not least the gas has a pungent odour, but is also extremely toxic.
The infrared and ultraviolet molecular absorption mechanisms were discussed and their
resulting spectra shown. A range of optoelectronic detection systems were described. The
intention is to show how these sensors may be adapted to domestic, agricultural and
industrial environments. With the growing awareness of the importance and dangers of
ammonia, it is highly likely that optoelectronic sensors will be further researched and
developed.
7. References
Brown, L. R. & Margolis, J. S. (1996). Empirical line parameters of NH
3
from 4791 to 5294
cm
−1
, JQSRT 56: 283–294.
Burton, G. R., Chan, W. F., Cooper, G. & Brion, C. E. (1993). The electronic absorption
spectrum of nh
3
in the valence shell discrete and continuum regions. absolute
oscillator strengths for photoabsorption (5
˝
U200 ev), Chem. Phys. 177: 217–231.
Chambers, P., Lyons, W. B., Lewis, E., Sun, T. & Grattan, K. T. V. (2007). The potential for
development of an NH
3
optical fibre gas sensor, Journal of Physics: Conference Series,
Third International Conference on Optical and Laser Diagnostics, Vol. 012015.
Cheng, B M., Lu1, H C., Chen, H K., Bahou, M., Lee, Y P., Mebel, A. M., Lee, L. C., Liang,
M C. & Yung, Y. L. (2006). Absorption cross sections of nh
3
,nh
2
d, nhd
2
, and nd
3
in
the spectral range 140-220 nm and implications for planetary isotopic fractionation,
The Astrophysical Journal 647(2): 1535.
Close, L. G., Catlin, F. I. & Cohn, A. M. (1980). Acute and chronic effects of ammonia burns of
the respiratory tract, Arch Otolaryngol. 106(3): 151–158.
Cottaz, C., Kleiner, I., Tarrago, G., Brown, L.R. (2001). Assignments and intensities of
14
NH
3
hot bands in the 5-8μm(3v
2
-v
2
,v
2
+v
4
-v
2
)and4μm(4v
2
-v
2
,v
1
-v
2
,v
3
-v
2
)
regions, J.Mol.Spectrosc. 209: 30–49.
201
Applications and Optoelectronic Methods of Detection of Ammonia
14 Optoelectronics / Book 2
Cottaz, C., Kleiner, I., Tarrago, G., Brown, L. R., Margolis, J. S., Poynter, P. L., Pickett,
H. M., Fouchet, T. & Drossart, P. (2000). Line positions and intensities in the 2v
2
/v
4
vibrational system of
14
NH
3
near 5-7 μm, JQSRT 203: 285–309.
Culshaw, B., Stewart, G., Dong, F., Tandy, C. & Moodie, D. (1998). Fibre optic techniques for
remote spectroscopic methane detection from concept to system realisation, Sensors
& Actuators B: Chemical 51: 25–37.
Dakin J.P. & Chambers P. (2004). Review of methods of optical gas detection by direct
optical spectroscopy with emphasis on correlation spectroscopy, NATO Science Series,
Volume 224, Part 2, 457-477,
Dakin, J. P., Wade, C. A., Pinchbeck, D. & Wykes, J. S. (1987). A novel optical fibre methane
system, SPIE volume: 734 Fibre Optics ’87: Fifth Internation Conference on Fibre Optics
and Optoelectronics.
Darde, V., Thomsen, K., van Well, W. J. M. & Stenby, E. H. (2008). Chilled ammonia process for
CO
2
capture, Greenhouse Gas Control Technologies 9, Proceedings of the 9th International
Conference on Greenhouse Gas Control Technologies (GHGT-9), Vol. 1, pp. 1035–1042.
Eckhardt, H. S., Klein, K F., Spangenberg, B., Sun, T. & Grattan, K. T. V. (2007). Fibre-optic uv
systems for gas and vapour analysis, J. Phys.: Conf. 85: 012018.
Edwards, H. O. & Dakin, J. P. (1993). Gas sensors using correlation spectroscopy compatible
with fibre-optic operation, Sensors & actuators B: Chemical 11: 9.
Felty, W. L. (1982). From camel dung, J. Chem. Educ. 59: 170.
Goody, R. (1968). Cross-correlating spectrometer, Journal of the Optical Society of America
58(7): 900–908.
Guelachvili, G., Abdullah, A. H., Tu, N., Rao, K. N., Urban, S. & Papou
˘
sek, D. (1989). Analysis
of high-resolution fourier transform spectra of
14
NH
3
at 3.0μm, Journal of Molecular
Spectroscopy 133: 345–364.
Hill, D. W. & Powell, T. (1968). Non-Dispersive Infra-Red Gas Analysis in Science, Medicine and
Industry, Adam Hilget Ltd.
Hills, P. C., Samson, P. J. & Webster, I. (1993). Optical fibres are intrinsically safe: reviewing
the myth, Australian Journal of Electrical and Electronics Engineering 10(3): 207–220.
ISSN:0725-2986.
Hordvik, A., Berg, A. & Thingbø, D. (1983). A fibre optic gas detection system, proceedings 9th
international conference on Optical Communications, ’ECOC 83’, p. 317.
Howard, J. B. & Rees, D. (1996). Structural basis of biological nitrogen fixation, Chem. Rev.,
96: 2965
˝
U–2982.
Inaba, H., Kobayasi, T., Hirama, M. & Hamza, M. (1979). Optical-fibre network system for
air polution monitoring over a wide area by optical absorption method, Electronics
Letters 15(23): 749–751.
Keller-Rudek, H. & Moortgat, G. K. (2006). MPI-Mainz-UV-VIS Spectral Atlas of Gaseous
Molecules, Max-Planck-Gesellschaft zur Förderung der Wissenschaften e.V., chapter
Spectral-Atlas-Mainz.
Kleiner, I., Brown, L. R., Tarrago, G., Kou, Q L., Picque, N., Guelachvili, G., Dana, V. &
Mandin, J Y. (1999). Line positions and intensities in the vibrational system v
1
,v
3
and 2v
4
of
14
NH
3
near 3 micron, J.Mol.Spectrosc. 193: 46–71.
Kleiner, I., Tarrago, G. & Brown, L. R. (1995). Positions and intensities in the 3 v
2
/v
2
+v
4
vibrational system of
14
NH
3
near 4 micron, Journal of Molecular Spectroscopy
173: 120–145.
202
Optoelectronics – Devices and Applications
Applications and Optoelectronic Methods of Detection of Ammonia 15
Kobayashi, T., Hirana, M. & Inaba, H. (1981). Remote monitoring of NO
2
molecules by
differential absorption using optical fibre link, Applied Optics 20(19): 3279.
Kosterev, A. A. & Tittel, F. K. (2004). Ammonia detection by use of quartz-enhanced
photoacoustic spectroscopy with a near-ir telecommunication diode laser, Applied
Optics 43: 6213–6217.
Levey, P. R. & van Bennekom, A. (1995). A mechanistic study of the effects of nitrogen on the
corrosion properties of stainless steels, Corrosion 51(12): 911–921.
Luft, K. F. (1947). Anwendung des ultraroten spektrums in der chemischen industrie, Angew.
Chem. 19(B): 2.
Malins, C., Doyle, A., MacCraith, B. D., Kvasnik, F., Landl, M., Simon, P., Kalvoda, L.,
Lukas, R., Pufler, K. & Babusík, I. (1999). Personal ammonia sensor for industrial
environments., J Environ Monit. 1(5): 417–422.
Manap, H., Muda, R., O’Keeffe, S. & Lewis, E. (2009). Ammonia sensing and a cross sensitivity
evaluation with atmosphere gases using optical fiber sensor, Procedia Chemistry,
Proceedings of the Eurosensors XXIII conference, Vol. 1, pp. 959–962.
McBride, J. . P. & Nicholls, R. W. (1972). The vibration-rotation spectrum of ammonia gas i.
Miller, G. C. (1981). Chemical of the month: Ammonia, J. Chem. Educ. 58: 424–425.
Mohebati, A. & King, T. A. (1988). Remote detection of gases by diode laser spectroscopy,
Journal of Modern Optics 35(3): 319–324.
Rothman,L.S.,Gamache,R.R.,Goldman,A.,Brown,L.R.,Toth,R.A.,Pickett,H.M.,Poynter,
R. L., Flaud, J M., Camy-Peyret, C., Barbe, A., Husson, N., Rinsland, C. P. & Smith,
M. A. H. (1987). The hitran database: 1986 edition, Appl.Opt. 26: 4058–4097.
Samide, A., Bibicu, I., Rogalski, M. S. & Preda, M. (2004). Surface study of the corrosion of
carbon steel in solutions of ammonium salts using mössbauer spectrometry, Journal
of Radioanalytical and Nuclear Chemistry 261(3): 593–596.
Samson, P. J. & Stuart, A. D. (1989). Fibre optic gas sensing using Raman spectroscopy,
Proceedings of 14th Australian conference on optical fibre technology, pp. 145–148.
Schmidt, K., Michaelian, K. & Loppnow, G. (1999). Identification of major spieces in
industrial metal-refining solutions with raman spectroscopy, Applied Spectroscopy
53(2): 139–143.
Stewart, G., Shields, P. & Culshaw, B. (2004). Development of fibre laser systems for ring-down
and intracavity gas spectroscopy in the near-IR, Measurement Science Technology
15: 1621–1628.
Stueflotten, S., Christensen, T., Iversen, S., Hellvik, J. O., Almås, K., Wien, T. & Graav, A.
(1982). An infrared fibre optic gas detection system, Proceedings OFS-2 international
conference, pp. 87–90.
Sun, P., Ayre, C. & Wallace, M. (2003). Characterization of organic contaminants
outgassed from materials used in semiconductor fabs/processing, Characterization
And Metrology For Ulsi Technology: 2003 International Conference on Characterization and
Metrology for ULSI Technology. AIP Conference Proceedings, Vol. 683, pp. 245–253.
Taylor, F. W., Haughton, J. T., Peskett, G. D., Rogers, C. D. & Williamson, E. J.
(1972). Radiometer for remote sounding of the upper atmosphere, Applied Optics
11(1): 135–141.
Tur, M., Shafir, E. & Blotekjaer, K. (1990). Source-induced noise in optical systems driven by
low coherence sources, Journal of Lightwave Technology 8: 183–189.
203
Applications and Optoelectronic Methods of Detection of Ammonia
16 Optoelectronics / Book 2
Urban, S., Tu, N., Rao, K. N. & Guelachvili, G. (1989). Analysis of high-resolution fourier
transform spectra of
14
NH
3
at 2.3 μm, Journal of Molecular Spectroscopy 133: 312–330.
Vargas-Rodriguez, E. & Rutt, H. N. (2009). Design of CO, CO
2
and CH
4
gas sensors based
on correlation spectroscopy using a fabry-perot interferometer, Sensors & actuators B:
Chemical 137: 410–419.
Veingerov, M. L. (1938). Eine methode der gasanalyze beruhend auf dem optisch-akustischen
Tyndall-Röntgeneffekt, Dokl. Akad. Nauk SSSR. 19: 687.
Whitenett, G., Stewart, G., Yu, H. & Culshaw, B. (2004). Investigation of a tuneable
mode-locked fiber laser for application to multipoint gas spectroscopy, Journal of
Lightwave Technology 22(3): 813–819.
Zhang, D. K., Hills, P. C., Zheng, C., Wall, T. F. & Samson, P. (1992). Fibre optic ignition
of combustible gas mixtures by the radiative heating of small particles, Proceedings
of the 24th International Symposium on Combustion (code 19626), Pittsburgh, PA, USA,
pp. 1761–1767. ISSN:0082-0784.
204
Optoelectronics – Devices and Applications
11
Optical-Fiber Measurement Systems
for Medical Applications
Sergio Silvestri and Emiliano Schena
University Campus Bio-Medico of Rome
Italy
1. Introduction
After telecommunications, also medicine has been revolutionized by optical fibers. They
were firstly used, in the early sixties, to visualize internal anatomical sites by illuminating
endoscopes. The essential technological solution to obtain good quality images was the
introduction of “cladding” during the fifties. The result was the development of minimally
invasive tools that have become essential for medical diagnosis and surgery. But optical
fibers offer the potential for much more than illumination or imaging tasks. For example,
they can also be utilized to sense physiological parameters.
The subject of present chapter is, therefore, a description of the design and measurement
principles utilized in fiber optic sensors (FOSs) with a particular reference to biomedical
applications.
FOSs development started in the sixties, but the high component costs and the poor interest
of the medical community delayed the industrial expansion. The cost reduction of key
optical components allowing to realize even disposable or mono-patient FOSs, the increase
of components quality, the development of miniaturization, and the availability of plug and
play and easy-to-use devices are the main reasons of the growth that is taking place in the
use of FOSs.
Moreover, FOSs are characterized by some crucial advantages respect on the conventional
transducers that allow to satisfy requirements for use in medical applications: they are
robust, may have good accuracy and sensitivity, low zero- and sensitivity-drift, small size
and light weight, are intrinsically safer than conventional sensors by not having electrical
connection to the patient, large bandwidth, and show immunity from electromagnetic
interference. This last feature allows to monitor parameters of physiological interest also
during the use of electrical cauterization tools or in magnetic resonance imaging. At present,
FOSs are used to measure physical variables (e.g., pressure, force, strain, and fluid flow) and
also chemical variables (oxygen concentration in blood, pH, pO
2
, and pCO
2
).
The simplest FOSs classification is based on the subdivision in intrinsic and extrinsic
sensors. In an intrinsic sensor the sensing element is the optical fiber itself, whereas an
extrinsic sensor utilizes the optical fiber as a medium for conveying the light, whose
physical parameters are, in turn, related to the measurand.
Due to different requirements for miniaturization and safety, in medical applications, these
sensors are usually further divided in: invasive sensors, which are inserted into the body,
Optoelectronics – Devices and Applications
206
therefore they must be miniaturized and biocompatible; non-invasive sensors, placed near
the body or on the skin surface.
A number of measurement principles can be utilized to realize transducers based on the
variation of fiber optic properties with physical or chemical variables, or based on variation
of light parameters in the fiber. As the wide variety of techniques developed to design FOS
for medical applications, just some of them are here described in detail.
This chapter is divided into subsections where a concise description of the measurement
principle of FOSs is presented along with the main medical applications. Particular
emphasis is placed on the metrological characteristics of the described FOSs and on the
comparison with conventional sensors. Measurement principles include interferometry-
based, intensity-based, fiber Bragg grating and laser Doppler velocimetry sensors.
In the following sections, the four abovementioned working principles and their use in
specific medical applications to sense variables of physiological interest are investigated.
The performances of the sensing methods are also presented with particular reference to the
description of commercially available sensors.
2. Interferometry-based and intensity-modulated fiber optic sensors
FOSs can be realized with a working principle based on a large number of interferometric
configurations, e.g., Sagnac interferometer, Michelson interferometer, Mach-Zehnder
interferometer, and Fabry-Perot interferometer (Yoshino et al., 1982a) (Davis et al., 1982).
Typically, these approaches show an extremely high sensitivity although cross-sensitivity
represents a significant drawback: first of all the influence of temperature may introduce
quite high measurement uncertainties (Grattan & Sun, 2000).
These FOSs can be designed as intrinsic sensors, where the sensing element is the fiber itself,
or as extrinsic sensors, where a small size sensing element is attached at the tip of an optical
fiber. The most common configuration is the second, where the sensing element, placed at
the tip of the optical fiber, causes changes of light parameters in a well-known relation with
the measurand. In this case, the optical fiber is employed to transmit the radiation emitted
by a light source (e.g., laser or diode) and to transport the radiation, modulated by the
measurand, from the sensing element to a photodetector (e.g., an optical spectrum analyzer).
Thanks to this solution, the sensor can be used also for invasive measurements, as the
largest part of the measurement system (light source and photodetector) can be placed far
from the miniaturized sensing element, due to the very limited energy losses of light in the
fiber.
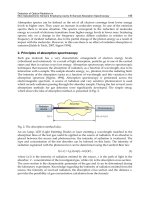
Fig. 1. Schematic representation of a Fabry-Perot interferometer.
Optical-Fiber Measurement Systems for Medical Applications
207
In medical applications, mainly dedicated to force and pressure monitoring (Rolfe et al.,
2007), the most common design is based on the interferometer configuration proposed by
Fabry and Perot (Fabry & Perot, 1898), also known as multi-beam interferometer because
many beams interfere in one resonator. A typical realization is composed of two parallel
high reflecting mirrors placed at distance d (Figure 1). If d is variable, the instrument is
called a Fabry-Perot interferometer. If d is fixed, whereas the incident light angle varies, the
instrument is called a Fabry-Perot etalon. The Fabry-Perot interferometer allows to
distinguish very close radiation wavelengths.
The Fabry-Perot cavity is usually utilized as secondary element of the sensor. Its output is
an electromagnetic radiation with a wavelength that is function of d. In order to have high
performances a measurement system based on Fabry-Perot interferometer needs a
photodetector discriminating radiations with very close wavelengths. The working principle
can be described as follows. When a light beam, emitted by a light source (e.g., a laser),
enters between the two mirrors, a multiple reflections phenomenon takes place. The
electromagnetic waves in the cavity can interact constructively or destructively, depending
on if they are in phase or out of phase respectively. The condition of constructive
interference, corresponding to a peak of transmitted light intensity, happens if the difference
of optical path length between the interacting beams is an integer multiple of the light
wavelength. The phase difference between interacting beams, and therefore the intensity of
transmitted light, depends on the distance d between the mirrors. Considering for simplicity
the same value for the refractive index upward the first surface and downward the second
mirror (n
1
), the intensity of transmitted light can be expressed as follows (Peatross & Ware,
2008):
2
00
2
22
1
1
1 4 sin 1 sin
22
R
II I
RR F
(1)
Where I
0
is the intensity of the incoming wave, F is the cavity’s coefficient of finesse that can
be expressed by the following equation:
2
4
1
R
F
R
(2)
R is the reflectance of both mirrors, and δ, the phase difference between each succeeding
reflection, is a function of the radiation wavelength (λ), the distance between the two mirrors
(d), and the angle between the radiation direction and the normal to the mirror surface (
1
):
1
1
4
cos
dn
(3)
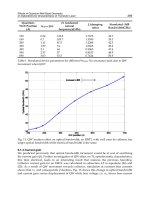
In order to increase the sensitivity of the Fabry-Perot interferometer, it is desirable that the
intensity (I) varies strongly with δ. Equation 1 shows that sensitivity of I with δ increases
when F is increased. Therefore, the sensitivity of the device increases when F, and
consequently R, is increased, as shown by equation 2. For the above mentioned reasons,
important parameters of a Fabry-Perot interferometer are: the difference between two
succeeding transmission peaks (free spectral range) and the value of R. In fact, the difference
between the maximal and the minimal peaks of the transmitted radiation increases with R,
Optoelectronics – Devices and Applications
208
moreover, the trend of I as a function of d becomes sharper when R increases: this makes
easier the determination of d variations. A mirror with a very high reflectance (R) is usually
obtained by coating the internal surface of the two mirrors.
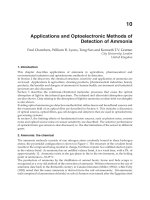
Fig. 2. Ratio between the intensities of transmitted and incident radiation as a function of
δ/2 for different values of cavity’s finesse coefficient.
Figure 2 shows the ratio between the intensity of transmitted and incident light as a function
of δ/2, considering a normal incident radiation (cosα
1
≈1), for the following F values: F=0.1
(R≈2.4 %), F=1 (R≈17 %), F=10 (R≈54 %), F=100 (R≈82 %).
Thanks to the use of an optical fiber coupled to a Fabry-Perot cavity, the measurement
system can be miniaturized, with the light source and the photodetector separated from the
sensing element (the cavity). Moreover, the small size of the sensing element, along with the
flexibility of the fiber optic with small outer diameter, allows to directly insert the sensing
element into the body for use in clinical applications where an invasive measurement is
required. Some sensors, showing the above described working principle, designed for
medical applications are reported in Section 2.1.
The intensity-modulated FOSs are characterized by a working principle based on the
intensity variation of the reflected light into the fiber related to a displacement induced by
the measurand on a secondary element. A basic configuration shows one or more optical
fibers with the extremity placed at a known distance from a movable mirror having high
reflectance. The radiation, emitted by a source and conveyed into the fiber, is reflected by
the mirror: the distance (d) between the fiber tip and the mirror is related to the measurand
magnitude. The intensity of the back-reflected light coupled to the fiber is a fraction of the
incident light intensity and depends on the distance between the fiber and the reflecting
surface, or on a deformation of the surface: an increase of the distance causes a decrease of
the back-reflected intensity as shown in figures 3a, 3b, and 3c. This principle, when applied
to a secondary transducer, allows to measure several physical variables: temperature,
pressure, force, fluid velocity and volumetric flow rate.
More complex configurations have been realized with solutions improving sensor
performances (Puangmali et al., 2010).
Other methods applied to the design of intensity-modulated FOSs are based on the light
coupling of two fibers (Lee, 2003). In this configuration, schematically reported in figure 4,
the radiation emitted by a light source is conveyed within a fiber optic, whose distal
extremity is placed in front of another fiber. The intensity of the light transmitted into the
second fiber, and measured by a photodetector placed at its distal tip, is related to the
distance (d) between the two fiber tips: the transmitted intensity decreases when d increases,
Optical-Fiber Measurement Systems for Medical Applications
209
as shown in figures 4a, 4b, and 4c. The measurand can be a displacement or a physical
variable causing the displacement, such as force, pressure or temperature.
Fig. 3. Schematic representation of common intensity-modulated FOSs realized with a fiber
and a reflecting surface. The intensity of the reflected radiation coupled to the fiber at
different distances d between the fiber and the mirror (a, b, and c).
Fig. 4. Schematic representation of intensity-modulated FOSs realized with two fibers or
more. The intensity of the coupled radiation of the two fibers is function of their distance d:
if d increases the intensity of collected light decreases (a, b, and c). Sensors’ performances
can be improved using differential configuration (d, and e).
Optoelectronics – Devices and Applications
210
The above described configuration can be improved using three or more fibers in
differential configuration for the compensation of changes in the light source intensity or
losses in the fiber, as shown in figure 4d and 4e.
An interesting example of sensor designed with this working principle is a flow-meter based
on the vortex shedding phenomenon: the light intensity transmitted between the fibers is
modulated by the periodical mechanical motion caused by vortex shedding. The light
intensity is converted by a photodiode in an electric signal related to the flow rate. This
sensor can be used to perform measurements of fluid flow rate also at high temperature (350
°C) (Wroblewski & Skuratovsky, 1985).
A further design to realize intrinsic intensity-modulated FOSs is based on microbending.
The bending of an optical fiber, in fact, causes an attenuation of the light intensity conveyed.
As it is well known, the ever-present radiation loss into the cladding region causes an
attenuation when the light passes through a fiber. The intensity loss into the cladding region
can be increased if the fiber is bent (figure 5). Also this working principle allows to sense
pressure, force, fluid velocity and volumetric flow rate.
Fig. 5. a and b: principle of work of FOS based on microbending that transduces a
displacement causing the bending into an intensity attenuation.
Generally speaking, intensity-modulated FOSs are characterized by the main advantage of
requiring a modest amount of electronic interfaces (Udd, 2006).
2.1 Interferometry-based and intensity-modulated fiber optic sensors: medical
Intracranial pressure (ICP) is the cerebrospinal fluid pressure inside the skull. Being the
skull a rigid case, any volumetric increase of its content may raise the ICP. The ICP
monitoring is probably the most important application of FOSs in the medical field at the
moment. During the sixties there was a significant propulsion in the development of
pressure FOSs for measurement of intravascular blood pressure (Lekholm & Lindstrom,
1969) and in the early seventies some patents were issued describing FOSs to measure the
ICP.
The ICP value is principally due to two main components: cerebrospinal fluid (CSF) volume,
that is responsible for ICP baseline and can cause, in pathological conditions, an increase of
this parameter; vasogenic components causing small fluctuations of cerebral blood volume,
that can increase the ICP value in conditions of hypercapnea or increase of cerebral
metabolism. Mass lesions (tumors, pus or hematoma), vascular engorgement (e.g., in case of
traumatic brain injury), cerebral oedema or hydrocephalus may also increase the ICP value.
Its monitoring is, therefore, essential in patients with traumatic brain injury, tumors or pus,
where the ICP increase is a common cause of ischemia, intracranial hemorrhages or brain
Optical-Fiber Measurement Systems for Medical Applications
211
herniation. Since the ICP value varies continuously, an uninterrupted record of the ICP
should be obtained in order to avoid the loss of diagnostic data.
Normal ICP values depend on age, position and clinical conditions. In supine position it
ranges from 7 mmHg to 15 mmHg for adults and from 3 mmHg to 7 mmHg for children; an
ICP exceeding 20 mmHg needs therapeutic treatment (Smith, 2008).
Although some attempts have been performed to introduce non-invasive or minimally-
invasive methods, e.g., the estimation of ICP by the measurement of tympanic membrane
displacement (Shimbles et al., 2005) or by ultrasound-based techniques (Yoshino et al.,
1982b), the ICP monitoring usually requires invasive transducers. Transducers can be placed
in parenchymal, ventricular, epidural, subdural, or subarachnoid locations, although
measurements obtained from the last three sites appear less accurate (Bratton et al., 2007).
Also, lumbar puncture can be utilized to estimate the ICP, but this indirect measurement not
always correlates with the ICP value. In the clinical practice, the monitoring is performed in
several ways: 1) through a catheter placed in ventricular, epidural or subarachnoid spaces
and connected to an external strain gauge; 2) through a micro strain gauge typically placed
in ventricular or parenchymal catheters; 3) through FOSs guided inside the ventricles, brain
parenchyma, subdural or subarachnoid spaces.
The standard proposed by the Association for the Advancement of Medical Instrumentation
(AAMI) provides the performances that a device intended for ICP measurement should
assure. The device should have a pressure range between 0 mmHg and 100 mmHg, an
accuracy better than ±2 mmHg in the range from 0 mmHg to 20 mmHg, and lower than 10
% of the measured value in the range from 20 mmHg to 100 mmHg (Bratton et al., 2007).
Commercially available FOSs, intended to monitor ICP value, are based on two working
principles. The former was introduced by T. E. Hansen, who described an interesting micro-
tip FOS for medical applications (Hansen, 1983). Successively, A. Lekholm and L. Lindstrom
realized a FOS with the same measurement principle for intravascular use (Lekholm &
Lindstrom, 1969) and A. Wald dedicated it to monitor the ICP (Wald et al., 1977). The
working principle is based on the presence of two groups of fiber bundles connected to a
LED and to a photodetector respectively. At the common end of the bundle is placed a thin
metal membrane reflecting the light. In this way, the light emitted by LED is conveyed to the
fibers connected to the photodetector, as schematically reported in figure 6.
Fig. 6. Schematic representation of the sensing element of the FOS made by Camino
Laboratories: the output light variation is related to the pressure that causes a mirror
displacement.
Optoelectronics – Devices and Applications
212
The coupling and, therefore, the photodetector signal, depends on the membrane deflection
caused by an external pressure. These FOSs have small size, e.g., an outer diameter of 1.5
mm or 0.85 mm for the unshielded case, and a frequency response flat from 0 Hz up to 15
kHz. On the other hand, they show zero drift if a temperature step from 20 °C to 37 °C is
applied, recovering the baseline after about 40 s.
The second FOS design is based on Fabry-Perot interferometry (Fabry & Perot, 1898). These
sensors were introduced in the late seventies (Mitchell, 1989). The sensing element shows
two parallel optical reflecting surfaces, as schematically reported in figure 1, and one of
them is a pressure sensitive diaphragm. A variation of the external pressure causes a
deflection of the diaphragm, reducing the optical cavity depth. The optical cavity is,
therefore, with variable dimension allowing light intensity curve having multiple maxima
and minima that depend on cavity depth.
At present, some fiber optic devices based on micro-optical mechanical systems (MOMS) to
monitor the ICP are commercially available.
FISO Technologies, Inc. has developed some pressure FOSs for medical applications
constituted by a Fabry-Perot cavity whose optical length changes with the physical
parameters to be measured. The FOP-MIV pressure sensor is a miniaturized Fabry-Perot
cavity constituted by a micromachined silicon diaphragm membrane, acting as pressure
sensing element (Chavko et al., 2007). When pressure increases, the thin membrane is
deflected and the Fabry-Perot cavity depth is reduced, in this way the small cavity depth
variations are related to pressure variations. Vacuum inside the cavity prevents changes of
internal pressure caused by gas thermal expansion that would, otherwise, distort the
pressure measurement.A high vacuum is maintained inside the cavity therefore, the FOP-
MIV measures absolute pressure. Being one of the smallest pressure sensors commercially
available, FOP-MIV is well designed for many medical applications where size is an
important issue (Hamel & Pinet, 2006). The optical nature of the FOP-MIV, makes the sensor
immune to electromagnetic field or radiofrequency interferences regularly encountered in
operating rooms or MRI environment. FOP-MIV is characterized by a measurement range
up to 300 mmHg, an accuracy equal to 1.5 % of full scale output (or ±1 mmHg), a resolution
better than 0.3 mmHg, a thermal effect sensitivity of 0.1 %/°C; a zero drift thermal effect of
0.4 mmHg/°C.
Innerspace, Inc. produces a device to monitor ICP also based on the Fabry-Perot cavity: the
pressure, deflecting the diaphragm, alters the cavity depth and thus the optical cavity
reflectance at a given wavelength. If a LED source is used, the spectrally modulated
reflected light can be split into two wavebands by a dichroic mirror. The ratio of the two
signals provides a pressure estimation immune to the typical light level changes occurring
in FOS systems. The measurement range is from -10 mmHg up to +100 mmHg, the linearity
and hysteresis is ±2 mmHg from 0 mmHg to 10 mmHg and 10% of reading from -10 mmHg
to 125 mmHg (Mignani & Baldini, 1995).
Camino Laboratories realized the ICP monitoring through an intensity-modulated based
FOS. A dual-beam reference, using a secondary fiber optic path, is joined to the pressure
measuring fiber link, but unaffected by pressure variations. The sensor is based on the
intensity modulation technique with dual-beam referencing. The radiation conveyed within
a fiber optic is coupled to a fiber by a bellow with a reflecting surface. The intensity of the
coupled radiation depends on the position of the bellow’s tip, which is function of the
pressure, as shown in figure 6. The measurement range is from 0 mmHg up to 100 mmHg,
linearity and hysteresis is ±2 mmHg from -10 mmHg to +50 mmHg and 6% of read value
Optical-Fiber Measurement Systems for Medical Applications
213
from +50 mmHg to +125 mmHg, the frequency response shows an attenuation of -3dB from
33 Hz to 123 Hz, a zero drift <2 mmHg (first 24 hours) and less than 1 mmHg/day (first 5
days).
At present, the “gold standard” technique for ICP monitoring is considered a catheter
inserted into the lateral ventricle and connected to an external strain gauge (Smith, 2008).
The main advantages include the chance to perform a periodic external calibration and a
slightly lower cost than microstrain gauge and fiber optic devices (Bratton et al., 2007).
However, also these sensors have their own set of potential complications, including
obstruction or disconnecting of the tubing, occasional difficulties to place in the presence of
brain swelling and shift (Ostrup et al, 1987), migration of the catheter out of the ventricle
(Al-Tamimi et al., 2009), and infections occur in up to 11% of cases (Steiner & Andrews,
2006). Microstrain gauge and FOS show similar metrological characteristics but with a
higher cost. The additional advantages of FOS devices are: the immunity to the
electromagnetic interferences that allows to monitor the ICP during magnetic resonance or
during the use of electrical cauterization tools, no obstruction and electrical hazard, and a
quite low zero-drift (Crutchfield et al., 1990).
Arterial pressure invasive measurements can also be performed through FOSs. The most
widely used configuration is Fabry-Perot interferometry. Many studies describe
miniaturized pressure sensors (Ceyssens et al., 2008; Totsu et al., 2005). FOS allows to obtain
a large bandwidth (some kHz), an accuracy better than 4 % of the read value, and a
measurement range that covers the physiological pressure values (less than 300 mmHg).
Wolthuis et al. developed a Fabry-Perot FOS able to perform a concurrent measurement of
pressure (with resolution of 1 mmHg, measurement range from 1 mmHg to 1000 mmHg
and flat frequency response up to 1000 Hz) and temperature (with resolution of 0.2 °C, rise
time of 20 ms, and measurement range from 10 °C to 60 °C) (Wolthuis et al., 1993). RJC
Enterprises, LLC realized further developments of the sensor using the same principle of
measurement. For temperature measurement, the outer surface of a thin silicon layer defines
the optical reflecting cavity; the refractive index of silicon changes with temperature altering
the optical cavity reflectance spectra The transducer (for pressure and temperature) contains
a 850 nm LED whose emission reaches the sensor via an optical fiber. In the sensor's optical
reflecting cavity, the spectral distribution of the LED light is modified as a function of cavity
depth, and this spectrally altered light is reflected back down the fiber to the instrument.
Light returning to the instrument is optically split into two spectral components; the
photocurrents from these two components form a ratiometric signal which in turn correlates
with changes in the measured parameter (Wolthuis et al., 1993). The sensor shows some
advantages: small size (the maximum dimension is 300 µm), resolution of 0.02 °C and 0.1
mmHg, accuracy of 0.1 °C and ±1 mmHg (or 2 % of read value), bandwidth up to 500 Hz
limited only by supporting instrumentation, measurement range from 15 °C to 55 °C and
from 500 mmHg to 1100 mmHg (absolute pressure).
An interesting application of these sensors is related to the intra-aortic balloon pumping
(IABP) therapy, which is a therapy of circulatory support often used to help patients
recovery from critical heart diseases, cardiac surgery or to wait until a transplant is
performed. A catheter, terminated by an inflatable balloon, is introduced through the
femoral artery and is positioned into the descending aorta just below the subclavian artery.
The inner lumen of the catheter can be used to monitor systemic arterial pressure and the
outer lumen is used for the delivery of gas to the balloon. The balloon must be rapidly
inflated with the onset of the diastole and deflated when the systole happens. The