Photodiodes World Activities in 2011 Part 12 ppt
Bạn đang xem bản rút gọn của tài liệu. Xem và tải ngay bản đầy đủ của tài liệu tại đây (3.24 MB, 30 trang )
Single Crystal Diamond Schottky Photodiode
321
depletion layer width decreases with the increase in doping concentration and the
tunnelling probability increases. So a good ohmic contacts are obtained by heavily doping
the p-type diamond layer (doping levels much larger than 10
20
cm
-3
). The resulting layer p
+
,
which is highly doped by B, was metalized by silver paint annealed at 500°C for 10 min. The
I-V characteristic is reported in Fig.4 where is also reported the specific resistance calculated
by ohm’s law.
4.2 Shottky contact on intrinsic diamond layer
The electrical characterization of the metal/intrinsic diamond Schottky junction of the
devices was performed at room temperature in a vacuum chamber with a background
pressure of 10
-4
mbar by measuring the current–voltage (I–V) characteristics by using a
Keithley 6517A pico-ampere meter.
The I-V characteristic was obtained by applying a voltage to the metal contact while the p-
type diamond layer is earthing. Fig.5 shows the typical I-V characteristic of the diamond
Schottky photodiodes. When the p-type rectifyng contact is reverse biased by connecting the
metal to positive terminal, holes are repelled from the interface and the bands are away bent
down. The potential barrier for the holes is increase, as is the width of the depletion region.
The resulting net current is very low (reverse biased). If instead the metal is connected to the
negative terminal, then forward biasing results as the holes are attracted toward the metal
interface (forward biased).
Fig. 5. Typical I-V characteristic of the PIM device
In Fig.5, it’s clearly seen the different behaviour of reverse and forward current.
When a negative voltage (forward voltage) is applied on the metal electrode a hole current
starts flowing from the p-type diamond, via the nominally intrinsic diamond region,
towards the Schottky contact. The rectification behaviour of the both photodiodes is
observed with a very high rectification ratio of about 10
8
at ±3V. For values of |V
B
| < |V
on
|,
where V
on
is “turn- on voltage” that in figure is about - 1 V , the forward current is due to
generation-recombination effects and leakage superficial current and it’s similar at the
reverse current. Increasing the forward bias, in the region between approximately -1 V and -
1.6 V forward voltage (V
F
), the current rises exponentially with V
F
.
In this region the forward current density (J
F
) is well described by the thermionic emission
(TE) theory. The thermionic emission theory by Bethe is derived from the assumptions that
Photodiodes - World Activities in 2011
322
the barrier height is much larger than kT, thermal equilibrium is established at the plane
that determines emission, and the existence of a net current flow does not affect this
equilibrium. Bethe’s criterion for the slope of the barrier is that the barrier must decrease by
more than kT over a distance equal to the scattering length. The resulting current flow will
depend only on the barrier height and not on the width, and the saturation current is not
dependent on the applied bias. Then the current density of majority carriers from the
semiconductor over the potential barrier into the metal is expressed as (M. Brezeanu et al.,
2007):
*2
*
*0
0
exp 1
exp
F
FS
BI
S
p
qV
JJ
nkT
q
JAT
kT
m
AA
m
=−
−φ
=
=
(1)
where n is the ideality factor (n≥1 and it informs the experimental I-V characteristic deviates
from the behaviour SBD ideal (n = 1)), T the absolute temperature (Kelvin), k the
Boltzmann’s constant, J
S
the saturation current density, A
0
the Richardson’s constant
(120.173Acm
-2
K
-2
), A* the Richardson’s effective constant, m0 and mp* electron mass and
effective mass hole in diamond (m
p
*=0.7 m
0
) and Φ
BI
the Schottky barrier height. From the
exponential fit of the I-V characteristic, it is possible to estimate the saturation current
density J
S
and the ideality factor n. Substituting the values obtained from the fit in the
following equation
*2
ln
B
BI
S
KT AT
qJ
Φ=
(2)
it’s possible estimate the Schottky barrier heigh. The values obtained for IDT-PIM and PIM
photodiodes are 1.65 eV and 1.8 eV respectively.
5. Extreme UV characterization
The photodiodes have been tested over the extreme UV spectral region from 20 to 120 nm,
using He and He Ne DC gas discharge as radiation sources and a toroidal grating vacuum
monochromator (Jobin Yvon model LHT 30) with a 5Å wavelength resolution. The
dimension of the optical aperture is 0.25 × 6.00 mm
2
; a manual shutter is used to switch on
and off the UV radiation. The experimental apparatus of UV characterization is reported in
the following picture.
The photoresponse measurements have been performed in a vacuum chamber, at a pressure
of 0.03 mbar. By using a three (X-Y-Z) dimension mechanical stage powered by stepper
motors, it is possible to locate the photodetector in front of the beam light and to compare its
response with that of a calibrated NIST silicon photodiode ()
placed in the same position, which measures the absolute photon flux. A raster scansion of
the beam light was performed on the detector surface so to position the photodetectors
where their response has a maximum (see Fig.6(b)).
Single Crystal Diamond Schottky Photodiode
323
Fig. 6. a) Extreme UV characterization system, b) Raster scansion of the beam light
A hole, 2 mm in diameter, is used to collimate the radiation on the sensitive area of the
detectors and to obtain the same illuminated area on the silicon photodiode. The photocurrent
is measured by an electrometer (Keithley 6517A), using the internal voltage source.
Because of different geometry adopted by the two devices, they are measured differently.
The PIM detector is encapsulated in a copper/vetronite shielded housing with a 2 mm
pinhole. In such housing, the Al contact is grounded and the photocurrent is measured from
p-type diamond so that the signal is not affected by the eventual presence of secondary
electron emission current from the illuminated contact.
Fig. 7. a) I-V characteristic in dark and in light of PIM detectors and b) signal to dark current
ratio (SDR)
Photodiodes - World Activities in 2011
324
The IDT-PIM is simply mounted in an sample holder for UV measurements with the same 2
mm pinhole. In this case, the measured photocurrent of IDT-PIM detector can contain both
photoemission current and photoconductive current. The photoemission contribution
contains electron emission arising from Al fingers and from p-type diamond exposed to the
UV irradiation. The typical current – voltage (I-V) characteristics in dark current and under
irradiation have been measured at room temperature of two detectors are shown in Fig. 7.
The devices operate in the reverse bias mode because when operating in the forward bias
mode, the photocurrent is masked by the dark current. The dark current is very low (<0.1
pA) below about + 10 V, as expected for a metal/diamond rectifying contact.
The photocurrent vs. applied voltage is also reported in the same figure when the device is
exposed to UV radiation and 30.4 nm (He lines) and 73 nm (Ne line). The device shows a
photocurrent response even at zero voltage bias, exploiting the internal junction electric
field. The photocurrent is almost constant with increasing positive voltage, while the dark
current increases by about two orders of magnitude. Remarkably, thus, the best signal-to-
dark current (SDR) ratio (see Fig.7 (b)) is obtained at zero bias voltage, so that in the
following, the devices have been operated with no external bias voltage applied.
5.1 Temporal response
Temporal response measurements upon exposure to UV radiation have been performed
according to the following procedure: at first the dark current value was recorded for
several seconds keeping the light shutter closed, until the steady state value had been
reached; then the shutter was opened and the photocurrent was measured. Finally, the
shutter was closed again until the dark current reached the initial value, before starting a
new measurement run. The detectors time response, upon exposure to UV radiation, have
been measured by opening and closing a manual shutter during the acquisition. The
temporal response of the tested devices is reported in Fig. 8 (a) under UV illumination of the
He-Ne DC gas discharge radiation source.
Fig. 8. a) Temporal responses under illumination of He-Ne DC gas discharge radiation
source. b) The magnification of fall time of the both devices.
Single Crystal Diamond Schottky Photodiode
325
The response is reproducible and no undesired effects such as persistent photocurrent and
priming or memory effects, which are often observed in diamond UV detectors (C. E. Nebel
et al., 2000, A. De Sio et al., 2005, M. Liao et al., 2008), are observed. negligible. However, it is
obtained only after the very first irradiation: the device, just mounted, reaches the described
performance only after a pre-irradiation time of few minutes Fig.8 (b) shows rise and fall
times of the signal of about 60 ms, which corresponds to the acquisition rate of the used
electronic chain.
5.2 Linearity
A useful detector is expected to exhibit linear response with photon flux, i.e. a constant
responsivity up to a saturation point where space charge effects prevail and no more
electron-hole pairs can be collected under illumination. The calibration of linear detectors
and related electronics is much simpler. The linearity of the photodetectors have been
investigated varying the current intensity of the plasma. The photocurrent (I
ph
) measured
vs. the incident optical power (P), under irradiation of He-Ne gas discharge radiation is
shown in Fig.9. We used a power law: I
ph
=A+B•P
C
to fit the data. Here A is the offset
corresponding to the dark current, B is the photosensitivity (provided C=1) and C is a
linearity coefficient. The graph shows the measured data as well as the fitting function. In
this spectral region, both photodetectors shows remarkably good linearity, C being 1 in all
cases within the error.
Fig. 9. Linearity of IDT-PIM and PIM photodiodes.
5.3 Extreme UV spectroscopy
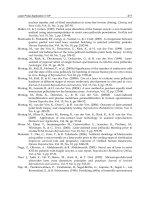
The normalized emission spectra of a DC discharge He and He-Ne lamp measured in
unbiased mode by the detectors are reported in Fig.10.
All spectral lines are clearly resolved and observed with a good signal to noise ratio,
demonstrating the high photodetection capabilities of the CVD single crystal diamond
grown in the extreme UV spectral region. All spectral lines are classified by the
NIST Atomic Spectra Database Lines Form from the following website:
Photodiodes - World Activities in 2011
326
Fig. 10. He-Ne emission spectrum measured by the two devices.
In particular, the low intensity lines of the He-Ne spectrum in the wavelength range 20-30
nm are easily resolved by PIM detector
Fig. 11. He-Ne spectrum measured by PIM detector in the range 20-30 nm
5.4 Responsivity and external quantum efficiency
The absolute spectral response of the PIM detectors is measured by comparison with a
calibrated photodiode exposed to the same source on the same optical area of about 1 mm2.
The spectral responsivity, expressed in amperes per watt (A/W), is defined as the
photocurrent per unit incident optical power and can be evaluated from the relationship R
d
= R
Si
I
d
/I
Si
where R
Si
is the responsivity of the calibrated silicon photodiode at a given
wavelength, I
Si
and I
d
are the photocurrents measured by the silicon photodiode and the
diamond detector, respectively.
The responsivities of both photodiodes are reported in Fig.12. The responsivity of the PIM
device decreases monotonically as the wavelength increases until about 80 nm while at 120
Single Crystal Diamond Schottky Photodiode
327
nm an increased value is observed. At 98 nm the signal is below the noise level so that only
an upper limit can be provided. However, the presence of a minimum in the responsivity
around 100 nm can be clearly deduced from Fig.12.
Fig. 12. Responsivity of the both devices.
The responsivity of the IDT-PIM detector is much lower than that of the PIM detector at
short wavelength (below 50 nm) showing a maximum at about 73 nm. The increased
sensitivity of the IDT-PIM device at intermediate wavelength could be probably ascribed to
the contribution of photoemission current as already reported in the literature (T. Saito et al,
2006). For both the devices the absolute responsivity measured at around 50 nm is
comparable to the best results reported in the literature for diamond based EUV detectors
(A. BenMoussa et al., 2006).
The External Quantum Efficiency (EQE) spectrum, estimated by: EQE = 1240•Rd / λ[nm], is
reported in Fig.7 for the PIM devices.
As mentioned above, the photocurrent measured by IDT-PIM detector includes the contains
both photoconductive current and photoemission current, arising from secondary electron
escape from Al fingers, which also depends on the wavelength (J. Ristein et al, 2005, W.
Pong et al., 1970). On the contrary, in the encapsulated PIM device the illuminated contact is
grounded and the current flowing from the boron doped layer is not affected by secondary
electrons contribution. Moreover, the more homogeneous electric field configuration of the
PIM device allows a simple analysis of the detection process.
In order to investigate the effect of the metallic Schottky contact upon the detection
performance of the PIM devices, different semitransparent metals (thickness < 10nm) have
been thermally evaporated on the oxidized surface of single crystal CVD intrinsic diamond
layers.
Photodiodes - World Activities in 2011
328
Fig. 13. External quantum efficiency EQE of the two photodiodes between 20 and 120 nm.
The absolute spectra responsivity curves versus different meal contacts of the devices are
shown in Fig.14. All the devices have a maximum of the responsivity at lower wavelengths
and a sharp cutting edge for longer wavelengths while at around 120 nm an increased value
is observed. The lowest responsivity, between 50 ÷ 100 nm, has been measured for the
device having Cr as an electrode. The device having Ag and Pt contacts shows rather similar
trend of the responsivity, whereas Al contact shows the best results in the UV performances.
Fig. 14. External quantum efficiency EQE of the PIM devices between 20 and 120 nm as a
function of the type of the metallic contact.
Single Crystal Diamond Schottky Photodiode
329
5.5 UV/visible rejection ratio
The photoconductive response was tested over a wide spectral range, extending from the
extreme UV (EUV) up to the visible. The 210–500 nm range was investigated using an
Optical Parametric Oscillator (OPO) 5 ns pulsed laser (Opolette laser by Opotek). The laser
beam was scattered by an optical diffuser in order to prevent signal saturation of the
electronic chain and the diamond detector was placed 10 cm away from the diffuser. A 500
MHz Le Croy WaveRunner 6050 digital oscilloscope was used to acquire the output signal.
50Ω
Tunable laser
Power meter
Diamond detector
D iffus er
O s cillos c ope
50Ω
Tunable laser
Power meter
Diamond detector
D iffus er
O s cillos c ope
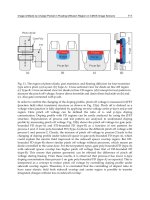
Fig. 15. Optical Parametric Oscillator and experimental set up.
Two different connection configurations were used:
i.
Direct recording of the detector output by the digital oscilloscope
ii.
Integrated measurement by an Ortec142A charge preamplifier.
The signal provided by a pyroelectric power meter was used to normalize the diamond
detector output, in order to take into account the wavelength dependence of laser pulse
amplitude and the intrinsic fluctuations of the beam intensity.
The visible-blind properties of the photodetectors were tested by measuring the
photoresponse at different wavelengths in the 210–500 nm range.
In Fig.16 (a) the device responsivity of the PIM detector is reported as a function of the
incident laser radiation wavelength, normalized to the pyroelectric power meter signal. A 3
orders of magnitude variation was measured when moving across the band gap wavelength
of 225 nm. Such a drop increases up to 5 orders of magnitude when the UV to visible
rejection ratio is considered. It should be stressed that a very stable and reproducible
response was observed in the whole energy range and irradiation memory or pumping
effects were not observed.
In addition, a linear increase in the photoresponse as a function of calculated radiation
intensity was observed measuring the output signal at decreasing device distances from the
optical diffuser.
The time response at 220 nm of the investigated PIM detector is reported in Fig. 16 (b). As
clearly seen in the Fig.16 (b), the device response to a laser pulse at 220 nm, measured
through a bias Tiee and recording by the digital oscilloscope (Le Croy 500MHz), shows an
exponential decay time constant of about 100ns. The reason of this trend of output response
is due to electrical circuit of the device. In fact, an RC circuit, the value of the time constant is
equal to the product of the circuit resistance and the circuit capacitance. Therefore, taking
into account the depletion capacitance measured by C-V curves of about 100pF and the
resistance of p-type diamond film ~1kΩ, the time constant result to be τ = 100ns.
Photodiodes - World Activities in 2011
330
Fig. 16. a)Normalized responsivity of PIM device as a function of the incident laser radiation
wavelength. b) The device response to laser pulses directly obtained by the digital
oscilloscope.
The visible-blind properties of the IDT-PIM device were also tested by measuring the
photoresponse at different wavelengths in the 210–500 nm range. In this region, the spectral
response shows a visible/UV rejection ratio of about 4/5 orders of magnitude, as clearly
seen in Fig.17(a) .Moreover, the time response at 220 nm of the investigated detector is
reported in Fig.17 (b). The Fig.17(b) shows the device response to a laser pulse at 220 nm,
which have a full width at half maximum (FWHM) of about 25 ns, and the time response is
faster than that of PIM detector. In fact, in this case, the parallel capacitance of the
photodiode is very low, about 15pF.
Interdigitated structure, therefore, can be optimized in order to build a ultrafast XUV
detector, for time resolution.
Fig. 17. a) Normalized responsivity of IDT- PIM device as a function of the incident laser
radiation wavelength. b) The device response to laser pulses directly obtained by the digital
oscilloscope.
6. Conclusion
Two detectors were fabricated at the University of Rome “Tor Vergata” with a structure that
acts as a metal/intrinsic/p-doped diamond photovoltaic Schottky diode. The two detectors
Single Crystal Diamond Schottky Photodiode
331
operate in different configurations: one in transverse geometry and the other one in planar
configuration.
We have measured the electrical characteristics and tested the performance under
continuous vacuum UV photon irradiation of the two devices. A general result of our
experiments is that diamond detectors are very sensitive devices showing show a very low
dark current and very good signal-to-noise ratio. The responses are reproducible and
undesired effects such as persistent photocurrent, priming or memory effects are negligible
for both devices. The response time could is very fast and it is much lower than the
acquisition rate of the used electronic chain (~ 60 ms). These results indicate the high quality
of our CVD diamond grown for UV applications.
The responsivity and the EQE of the two devices show an opposite behaviour as a function
of the radiation wavelengths due to the different operative configurations. In particular the
PIM detector is more efficient at lower wavelengths and present a drop of sensitivity at
approximately 100 nm. The IDT-PIM is less efficient at low wavelength and has a maximum
efficiency at about 74 nm.
The visible-blind properties of the photodetector were also tested by measuring the
photoresponse at different wavelengths in the 210–500 nm range. A 3/4 orders of
magnitude variation was measured by diamond based detectors when moving across the
band gap wavelength of 225 nm. Moreover, the spectral response shows a visible/UV
rejection ratio of about 5 orders of magnitude for both photodiodes. Finally, the device
response to laser pulses at 220 nm is different in two cases due to the different electrical
circuit of the two devices. In particular, the time response of IDT-PIM detector is faster than
that of PIM detector.
7. Acknowledgment
The devices studied in this chapter were developed by the group of Rome University “Tor
Vergata” composed by Prof. Marco Marinelli, Prof. Enrico Milani, Dr Gianluca Verona-
Rinati, Dr Giuseppe Prestopino and myself. They have made possible the writing of this
chapter.
Moreover, I’d like to thank the staff of "O. M. Corbino" Institute of Acoustics (IDAC) of
CNR who give me the possible to perform the photolithography techniques used to realize
the devices developed in this chapter.
8. References
J. E. Field, Properties of Diamond , Academic Press, London, (1979).
J.Prins, Applications of diamond films in electronics in “The Physics of Diamond”, A. Paoletti and
A. Tucciarone (editors), IOS Press, Amsterdam, (1997).
J.F. Hochedez, J. Alvarez, F.D. Auret, P. Bergonzo, M C. Castex, A. Deneuville, J.M. Defise,
B. Fleck, P. Gibart, S.A. Goodman, O. Hainaut, J P. Kleider, P. Lemaire, J. Manca, E.
Monroy, E. Munoz, P. Muret, M. Nesladek, F. Omnes, E. Pace, J.L. Pau, V.
Ralchenko, J. Roggen, U. Schuhle, C. Van Hoof, Diamond Relat. Mater. 11 (2002), 427.
A. Balducci, M. Marinelli, E. Milani, M.E. Morgada, A. Tucciarone, G. Verona-Rinati, M.
Angelone, M. Pillon, Appl. Phys. Lett. 86 (2005), 193509.
T. Teraji, S. Yoshizaki, H. Wada, M. Hamada, T. Ito , Diamond Relat. Mater. 13 (2004), 858.
Photodiodes - World Activities in 2011
332
V.I. Polyakov, A.I. Rukovishnikov, N.M. Rossukanyi, A.I. Krikunov, V.G. Ralchenko, A.A.
Smolin, V.I. Konov, V.P. Varnin, I.G. Teremetskaya, Diamond Relat. Mater. 7 (1998),
821.
L. Thaiyotin, E. Ratanaudompisut, T. Phetchakul, S. Cheirsirikul, S. Supadech, Diamond
Relat Mater 11 (2002), 442.
R. D. McKeag and R. B. Jackman, Diamond Relat. Mater. 7 (1998), 513.
L. Barberini, S. Cadeddu, and M. Caria, Nucl. Instrum. Methods 460 (2001), 127.
E. Pace, A. Vinattieri, A. Pini, F. Bogani, M. Santoro, G. Messina, S. Santangelo, Y. Sato, Phys.
Status Solidi, A Appl. Res. 181 (2000), 91.
S. Almaviva, Marco Marinelli, E. Milani, G. Prestopino, A. Tucciarone, C. Verona, G.
Verona-Rinati, M. Angelone, M. Pillon, Diamond Relat. Mater. 18 (2009), 101.
S. Almaviva, Marco Marinelli, E. Milani, G. Prestopino, A. Tucciarone, C. Verona, G.
Verona-Rinati, M. Angelone, M. Pillon, I. Dolbnya, K. Sawhney and N. Tartoni, J.
Appl. Phys. 107 014511 (2010).
S. Almaviva, Marco Marinelli, E. Milani, G. Prestopino, A. Tucciarone, C. Verona, G.
Verona-Rinati, M. Angelone, M. Pillon Diamond and Related Materials, v 19, n 1, p 78-
82, January 2010.
D. Palik., Handbook of Optical Constants of Solids II, Academic Press, New York (1991).
M. Werner, Semicond. Sci. Technol. 18 (2003) S41-S46.
S.M. Sze, Physics of Semiconductor Devices, John Wiley and Sons (WIE) (1981)
M. Brezeanu, T. Butler, N. Rupesinghe, S. J. Rashid, M. Avram, G. A. J Amaratunga, F.
Udrea, M. Dixon, D. Twitchen, A. Garraway, D. Chamund, and P. Taylor, IEEE
Proc.: Circuits Devices Syst. 1, 380 (2007).
website: .
C. E. Nebel, A. Waltenspiel, M. Stutzmann, M. Paul, and L. Schäfer, Diamond Relat. Mater. 9,
(2000), 404.
A. De Sio, E. Pace, Nucl. Instr. Methods A 552 (2005), 203
M. Liao, Y. Koide, J. Alvarez, M. Imura, J.P., Physical Review B 78 (2008), 045112.
T. Saito, K. Hayashi, H. Ishihara and I. Saito, Metrologia 43, (2006), S51.
A. BenMoussa, A. Theissen, F. Scholze, J.F. Hochedez, U. Schuhle, W. Schmutz, K. Haenen,
Y. Stockman, A. Soltani, D. McMullin, R.E. Vest, U. Kroth, C. Laubis, M. Richter, V.
Mortet, S. Gissot, V. Delouille, M. Dominique, S. Koller, J.P. Halain, Z. Remes, R.
Petersen, M. D'Olieslaeger, J.M. Defise , Nucl. Instr. Methods A 568 (2006), 398.
J. Ristein, W. Stein, L. Ley, Diamond and Relat. Mat. 7, 626 (1998).
W. Pong, R. Sumida, G. Moore, J. Appl. Phys 41, 1869 (1970).
14
GaN Based Ultraviolet Photodetectors
D. G. Zhao and D. S. Jiang
State Key Laboratory on Integrated Optoelectronics,
Institute of Semiconductors, Chinese Academy
of Sciences, Beijing
P. R. China
1. Introduction
The band gaps of the III–nitrides are large and direct,which are 0.7 eV for InN, 3.4 eV for
GaN, and 6.2 eV for AlN (Jain et al., 2000; Wu et al., 2002), consequently There are many
areas where conventional semiconductors including Si and GaAs cannot be used. For
example, short wavelength light emitters are required for full color display, high density
information storage, and under water communication. However, III–nitrides are particularly
suitable for applications in these areas. A great success in device applications has been
obtained so far, including the realization of high brightness blue GaN based light emitting
diodes (LED) and long lifetime GaN based laser diodes (LD) (Nakamura, 1998).
On the other hand, III-nitrides are one of the most promising materials for the fabrication of
high-sensitivity visible-blind (λ≤365nm) and solar-blind (λ≤280nm) ultraviolet (UV)
photodetectors, which have extensive applications in flame detection, secure space-to-space
communication, and ozone layer monitoring. Various types of GaN-based photodetectors
have been realized, including p-i-n and Schottky barrier photodetectors, solar-blind
ultraviolet photodetector focal plane arrays, and UV avalanche photodiodes (McClintock et
al., 2005; Zhao et al. 2007a; Cicek et al., 2010). The fabrication of GaN-based photodetectors
were reviewed in some articles previously(Muñoz et al.,2001). Since the quality of GaN
materials plays a key role in determining the performance of GaN UV photodetectors, in
this chapter, firstly the growth and properties of GaN materials are introduced, then the
device technology and fabrication are presented, finally a conclusion is drawn.
2. GaN material growth and ultraviolet photodetector’s fabrication
The GaN-based materials used for device applications investigated in this chapter are
grown on the c-plane sapphire substrate by metalorganic chemical vapor deposition
(MOCVD). The ammonia (NH
3
), trimethylgallium (TMGa), trimethylaluminum (TMAl) and
Silane (SiH
4
) have been used as N, Ga, Al, and Si precursors, respectively. H
2
has been used
as the carrier gas. The quality of the thin films is mainly characterized by the double x-ray
diffraction (DCXRD) and photoluminescence (PL). The full width at half maximum
(FWHM) of DCXRD ω-scan rocking curves is obtained using a Rigaku SLX-1AL x-ray
diffractometer. A 325 nm He–Cd laser is employed as excitation light in the measurement of
the PL spectra.
Photodiodes - World Activities in 2011
334
2.1 Material growth for GaN based UV photodetectors
Many attempts were made to synthesize GaN crystals during the period 1930–1960, but
good quality crystals could not be grown for a long period of time, mainly because there
are large lattice mismatch and thermal mismatch between the III–nitrides and widely-
used heteroepitaxial substrates (Jain et al., 2000). The beginning of the growth of good
quality epilayers was made by the two-step method (Amano et al., 1986; Nakamura,
1991). In the following, we will firstly introduce the MOCVD growth of GaN epilayers,
then the AlGaN growth will be discussed with the parasitic reaction between the TMAl
and NH
3
in MOCVD, finally the defects and related yellow luminescence of GaN films are
studied.
2.1.1 GaN material growth using the two-step method
The two-step growth method of GaN epilayer with low-temperature AlN buffer layers by
MOCVD is studied. (Zhao et al., 2004). The growth procedure is as follows: Firstly the AlN
buffer layer is grown on sapphire substrate at 600℃ and annealed in a temperature ramp,
then a GaN epilayer about 2.5 μm thick is deposited on the AlN buffer layer at 1080℃. The
real-time in situ optical reflectivity measurements are employed to monitor the whole
growth stages of GaN materials.
Fig. 1 shows the traces of in situ optical reflectivity measured from the two GaN epilayers
samples A and B grown on a 20 nm thick AlN buffer layer with different annealing
processes during the temperature elevation after the growth of low-temperature AlN
buffer layer. The annealing time of AlN buffer layer used in the growth of two samples A
and B are 1000 second and 300 second, respectively. In Fig. 1(a) and (b), two traces are
divided into three parts corresponding to three growth stages of GaN deposit on low-
temperature AlN buffer layer as follows: (i) the low-temperature AlN buffer layer
deposition, (ii) temperature ramp and anneal of the AlN buffer layer, (iii) the growth of
GaN epilayers. The differences in the surface evolution processes during the growth of
samples A and B are observed. In the initial growth stage of sample A where GaN
epilayer is deposited on AlN buffer layer with a 1000 second annealing time, the surface
of GaN layer becomes rough and the intensity of the in situ optical reflectivity decreases,
then the surface of GaN layer turns to be optically smoother step by step, it means the
lateral growth and coalescence of GaN islands emerge (Han et al., 1997), at last the quasi
two-dimensional growth of GaN layer occurs. An oscillation of the reflectivity intensity
with large and equal amplitude is well observed. However, the growth procedures of
sample B deposited on AlN buffer layer with a 300 second annealing time shows a
different kind of trace in Fig. 1(b). The surface roughing of GaN islands does not clearly
appear. There is nearly no change in the intensity of in situ optical reflectivity during the
starting period of the growth of GaN epilayer, as shown by the arrow in Fig. 1(b). As
shown in Table 1, sample A has a narrower FWHM of x-ray rocking curve and a higher
electron mobility, it seems that the longer annealing time of low-temperature AlN buffer
layer tends to promote a lateral growth of GaN islands, and the quality of GaN epilayers
is improved. It also suggests that the lateral growth of GaN islands is helpful to decrease
the edge threading dislocations, since the FWHM of x-ray ω-scan rocking curve for (0002)
and (10-12) planes represents indirectly the density of screw and edge threading
dislocations (Heying et al., 1996; Heinke et al.,2000).
GaN Based Ultraviolet Photodetectors
335
Samples AlN Buffer layer
XRD FWHM(arcmin)
Electron
Mobility(cm
2
/Vs)
Annealing
Time (s)
Thickness
(nm)
(0002) (10-12)
A,E
1000 20 6.9 11.2 360
B 300 20 8.1 19.1 142
C 1000 45 10.2 28.6 73
D 1000 30 7.2 13.9 217
F 1000 16 … … …
Table 1. Growth condition and characterization result of GaN samples.
Fig. 1. The traces of in situ optical reflectivity measurements for the three stages in the whole
growth process of GaN epilayers on low-temperature AlN buffer layer with different
annealing time: (a) 1000 s (b) 300 s.
It is found that not only the annealing time, but also the thickness of low-temperature AlN
buffer layer has an enormous influence on the quality of GaN epilayers. The traces of in situ
optical reflectivity measured from GaN epilayers growth on low-temperature AlN buffer
layer with different thickness are shown in Fig. 2(a)-(d), where the dashed lines denote the
start of GaN epilayers growth. For the four samples, the same 1000 second annealing time of
low-temperature-grown AlN is employed but the thickness of low-temperature AlN buffer
layer is different. They are 45nm, 30nm, 20nm, and 16nm for sample C, D, E (where sample
E and sample A is the same sample with different names) and F, respectively. It can be seen
from Fig. 2 that there exist a lot of differences in the reflectivity curves measured during the
initial stage of the growth process of GaN epilayers. Nearly no any growth of GaN islands
(surface roughing process in the initial growth stage) and their coalescence (lateral growth)
is observed in the starting period of growth process of sample C which is deposited on the
45 nm AlN buffer layer. There is a little growth of GaN islands and their coalescence in the
Photodiodes - World Activities in 2011
336
growth process of sample D which is deposited on the 30 nm AlN buffer layer. With thinner
AlN buffer layer, however, the obvious lateral growth of GaN islands is observed in the
growth process for sample E, as shown in Fig. 2 (c). The growth process of sample F is
stopped as shown in Fig. 2(d), indicating that the AlN buffer layer is too thin to lead to the
coalescence of GaN islands and to start a quasi two-dimensional growth. In this case the
quality of GaN epilayers becomes very bad. As shown in Table 1, the optimal thickness of
AlN buffer layer in this growth condition is around 20nm. A too thick or too thin AlN buffer
layer will lead to the deteriorated quality of GaN epilayers.
Fig. 2. The traces of in situ optical reflectivity measurements for the whole growth process of
GaN epilayers on low-temperature AlN buffer layer with the same 1000 s annealing time
and different thickness: (a) 45 nm, (b)30 nm, (c) 20 nm, (d) 16 nm. The dashed lines denote
the start of GaN epilayer’s growth.
In order to gain further insight to the effect of AlN buffer layer on the quality of GaN layers,
three AlN buffer layers a, b, and c with growth stopped just before the growth of high
temperature GaN epilayers [indicated by arrow in Fig. 1(a), (b) and Fig. 2(a)] are prepared
and examined by atomic force microscopy (AFM). These AlN buffer layers are grown under
the same growth conditions as those in samples A, B, and C, i.e. a (1000 second annealing,
20nm thickness), b (300 second annealing, 20nm thickness), and c (1000 second annealing,
45nm thickness), respectively. The surface morphology of these AlN buffer layers is shown
in Fig. 3(a), (b) and (c), respectively. They are quite different, and the sample a has the
largest grain size and the lowest nuclei density as shown in Fig. 3. It is known that the GaN
epilayer A which is grown on the AlN buffer layer a has the best quality, implying that the
quality of GaN epilayers is closely related to the surface morphology of AlN buffer layer.
Because the GaN islands in the initial growth stage will coalescence quickly if the AlN
buffer layer has small grain size and high nuclei density, as a result, a lot of formed
dislocations will go through the GaN epilayers, leading to a deteriorated quality. On the
GaN Based Ultraviolet Photodetectors
337
other hand, the quality of GaN epilayers deposit on AlN buffer layer with large grain size
and low nuclei density will be much better, since the lateral growth and coalescence of GaN
islands will be prolonged, which leads to an increased volume of defect-free columnar
domains and improve the crystal quality (Han et al., 1997). Of course, when the AlN buffer
layer has too large grain size and too low nuclei density, it will take a too long time for the
lateral growth of GaN islands, the quality of GaN epilayers will also become bad. Therefore,
it is concluded that the quality of GaN epilayers is dependent on the grain size and the
nuclei density of AlN buffer layer. A long time annealing and a suitable thickness of AlN
buffer layer are very important to the growth of high quality GaN epilayers.
a) b) c)
Fig. 3. AFM images of the surface morphology of the AlN buffer layers, where a, b, and c are
for the growth of samples A, B, and C, respectively
Besides the growth condition of low-temperature AlN buffer layer, the V/III ratio in the
initial growth stage has an important influence on the quality of a GaN epilayer grown by
MOCVD, and the quality of GaN epilayer could be improved by employing a lower V/III
ratio in the initial growth stage and intentionally prolonging the island coalescence process
(Zhao et al., 2007b, 2009a). After optimizing the growth conditions, high-mobility MOCVD-
grown n-type GaN films of about 4μm in thickness were reported (Zhao et al., 2006a). The
electron mobility at room temperature was as high as 1005 cm
2
/Vs at an electron
concentration of 1.1×10
16
cm
-3
. Fig. 4 shows the Hall measurement results of high quality
GaN samples. This is one of the best values reported for GaN films grown by MOCVD.
Fig. 4. The temperature-dependent electron mobility(solid square) and concentration(open
circle) of high quality n-type GaN sample. The electron mobility at room temperature was as
high as 1005 cm
2
/Vs at an electron concentration of 1.1×10
16
cm
-3
.
Photodiodes - World Activities in 2011
338
2.1.2 Parasitic reaction between TMAl and NH
3
in MOCVD
AlGaN materials are important for producing solar-blind ultraviolet photodetectors.
However, the parasitic reaction of TMAl and NH
3
occurring in the vapor phase is much
more serious than that of TMGa and NH
3
(Mihopoulos et al, 1998), and it has an
important influence on the growth of AlGaN materials. We will discuss parasitic reaction
of TMAl and NH
3
in MOCVD and study how to reduce its effect in this section (Zhao et
al., 2006b).
Fig. 5 shows the relationship between the growth rate of AlN at different reactor pressure of
50, 200 and 500 Torr in MOCVD system, respectively. It is found that with the increase of
growth temperature, the growth rate of AlN increase slowly when the reactor pressure is as
small as 50 Torr, while it instead decreases with increasing growth temperature if the reactor
pressure is raised to 200 Torr, and it decreases even more rapidly if the reactor pressure is
500 Torr. Usually it is difficult to grow AlN material at low temperature because of the
difficulty of decomposing NH
3
. However, the growth rate of AlN at high growth
temperature is much slower than at low temperature when a relatively high reactor pressure
is adopted during the growth. Such abnormal growth rate dependence on growth
temperature is attributed to the parasitic effect of NH
3
and TMAl. It is known that there is a
boundary layer above the substrate in the reaction chamber, and the gas precursors have a
residence time in the MOCVD process. The process related to parasitic reaction of TMAl and
NH
3
in the vapor phase can be described as follows (Mihopoulos et al, 1998),
Al(CH
3
)
3
+ NH3 → Al(CH
3
)
3
.NH
3
(1)
Al(CH
3
)
3
.NH
3
→ Al(CH
3
)
2
.NH
2
+ CH
4
(2)
nAl(CH
3
)
2
.NH
2
→ [Al(CH
3
)
2
.NH
2
]
n
,where n≥3 (3)
2Al(CH
3
)
2
.NH
2
→ [Al(CH
3
)
2
.NH
2
]
2
→ AlN particles (4)
[Al(CH
3
)
2
.NH
2
]
3
→ AlN particles (5)
During the growth, the AlN particles formed by parasitic reaction according to the equation
(4) and (5) are carried away from the deposition zone and do not contribute to the growth
(Mihopoulos et al, 1998). It is reported that the dimers ( i.e. [Al(CH
3
)
2
.NH
2
]
2
) have sufficient
energy to lose methyl groups to form AlN particles at high temperature (Mihopoulos et al,
1998). Therefore, if parasitic reaction plays an important role, much more AlN particles will
be engendered with the increase of growth temperature, and the growth rate of AlN will
decrease. Such effect is significant under a high reactor pressure. However when the reactor
pressure is as low as 50 Torr, the surface kinetically-limited mechanism is competed with
the gas phase parasitic reaction and becomes dominated, the growth rate of AlN is expected
to increase with the growth temperature as is expected. From the experimental result it is
deduced that the parasitic reaction depends on the reactor pressure besides the growth
temperature, i.e. it dominates when the reactor pressure is 200 Torr and 500 Torr, and is less
significant at 50 Torr. It is reasonable that the chance for TMAl and NH
3
to come into contact
increases at higher reactor pressures, and the formation of trimers ( i.e. [Al(CH
3
)
2
.NH
2
]
3
)
and higher n-mers( [Al(CH
3
)
2
.NH
2
]n for n>3) is enhanced by the increasing reactor pressure,
as a result, the parasitic reaction between TMAl and NH
3
becomes weak at a low reactor
pressure.
GaN Based Ultraviolet Photodetectors
339
Fig. 5. The measured growth rate of AlN versus the growth temperature, the reactor
pressures adopted in the growth are 50, 200 and 500 Torr, respectively.
The dependence of the AlN growth rate on the flux of NH
3
is also studied, and a very
interesting phenomena are observed as shown in Fig. 6. It is found that whatever the
other growth parameters are taken, the growth rate of AlN always decreases with the
increase of the flux of NH
3
in the range shown in Fig. 6. The parasitic reaction is expected
to be responsible for the phenomena. It has been reported that NH
3
can reduce the
potential energy barrier of trimers and higher n-mers formation (Nakamura et al., 2000).
Therefore, with the increase of the flux of NH
3
, the quantities of trimers and higher n-
mers which do not contribute to the growth will increase, and the growth rate of AlN will
decrease. It is found that the growth temperature has an effect on the changing speed of
growth rate with increasing flux of NH
3
. The data measured at 800 °C and 540 °C are
denoted by squares and circles respectively in Fig.6. It can be seen that the growth rate of
AlN decreases rapidly at higher growth temperature, which supports the conclusion that
higher growth temperature enhances parasitic reaction as suggested by the result of Fig. 5.
In addition, with the increase of the flux of NH
3
, parasitic reaction is enhanced at higher
growth temperature, therefore the growth rate of AlN decreases rapidly. On the other
hand, the variation of the growth rate with respect to the flux of NH
3
is also influenced
strongly by the reactor pressure, as shown by the two curves in the lower part of Fig. 6
which are measured at the flux of 500 Torr and 50 Torr, respectively. It indicates that at a
higher reactor pressure, more trimers and higher n-mers are formed with the increase of
NH
3
flux due to parasitic reaction. As a result, the growth rate of AlN decreases more
rapidly with the increase of NH
3
flux. Taking the above result into account, it is concluded
that the parasitic reaction can be reduced by decreasing the growth temperature, reactor
pressure and the flux of NH
3
.
The further research results confirm that low reactor pressure can weaken parasitic
reactions and lead to a higher Al content in AlGaN film (Deng et al., 2011). On the other
hand, the enhancement of the surface mobility of Al is especially important for high
quality AlGaN layers (Zhao et al., 2006b, 2008a). The migration-enhanced MOCVD is
intended to carry on for improving the surface dynamic behavior of Al atoms in the
growth (Zhang et al., 2002).
Photodiodes - World Activities in 2011
340
Fig. 6. The measured growth rate of AlN versus the flux of NH
3
. Either the growth
temperature or reactor pressure are different for the three curves.
2.1.3 Yellow luminescence and related defects in GaN materials
There are many problems of GaN materials are still hung in controversy till now. It is well-
known that there is a yellow luminescence band centered at 2.2-2.3eV in the PL spectra of
GaN. The mechanism behind it is still under disputation (For example, see Reshchikov &
Morkoc, 2005).We find that the edge dislocations play an important role in enhancing the
yellow luminescence of n-type GaN samples (Zhao et al.,2006d).
Fig. 7. Room temperature PL spectra of GaN samples A, B, and C of series I, which have the
same Si doping, where the intensity of the near-band-edge luminescence peak at 3.42 eV is
normalized.
Two series of GaN samples were prepared in our experiment. There were ten GaN samples
in series I, where different growth conditions were used but the same SiH
4
flux of 0.72
nmol/min was employed during the materials growth. Fig. 7 shows the room
GaN Based Ultraviolet Photodetectors
341
temperature(RT) PL spectra of three typical samples, A, B, and C in this series. The DCXRD
characterization results of these three samples are listed in Table 2. As shown in Fig. 7, the
broad band centered at 2.3 eV is the yellow luminescence. The undulations of the yellow
luminescence band are formed by light interference. The intensity of the near-band-edge
luminescence peak at 3.42 eV is normalized for the three PL spectra in Fig. 7. The integrated
intensity ratios of the yellow luminescence band to the near-band-edge emission (I
YL
/I
BE
)
are 2.14, 1.20, and 0.27 for samples A, B, and C, respectively. As shown in Table 2, sample A
has the widest DCXRD FWHM at the (102) plane, and sample C has the narrowest DCXRD
FWHM at the (102) plane. Correspondingly, sample A has the most intense yellow
luminescence band, while sample C has the least. The relative intensity of yellow
luminescence band seems to be strongly dependent on the FWHM at the (102) plane.
The solid square symbols in Fig. 8 show the dependence of the I
YL
/I
BE
value on the DCXRD
FWHM at the (102) plane for the all ten samples of series I. The figure clearly indicates that
the relative intensity of the yellow luminescence band increases as the DCXRD FWHM at
the (102) plane increases. However, we have also found that the relative intensity of yellow
luminescence exhibits a random fluctuation when the DCXRD FWHM at the (002) plane
increases (not shown here). It has been reported that the GaN samples with narrower
DCXRD FWHM at the (002) plane have lower screw dislocation densities, while the GaN
samples with narrower FWHM at the (102) plane have lower edge dislocation densities
(Heying et al., 1996; Heinke et al., 2000). Therefore, the above-mentioned results suggest that
the intensity of the yellow luminescence band in n-type GaN is not influenced by the
density of screw dislocations, but is strongly related to the edge dislocations.
Sample DCXRD FWHM (arcsec) SiH
4
Flux
(nmol/min)
n (cm
-3
) I
YL
/I
BE
(a.u.)
(002) (102)
A 428 835 0.72 8.8×10
16
2.14
B 382 605 0.72 2.1×10
17
1.20
C 425 490 0.72 2.6×10
17
0.27
Table 2. Characterization results and Si doping condition of n-type GaN samples in series I
Hall measurements were carried out to gain further insight into the behavior of edge
dislocations in GaN. Fig. 8 shows the dependence of net carrier concentration of the n-type
GaN samples of series I (hollow triangle symbols) on the DCXRD FWHM at the (102) plane.
We observed that the carrier concentration decreased with the increase of the FWHM at the
(102) plane. This is surprising because the same Si doping is used during the growth of this
series of GaN samples. This implies that edge dislocations may influence the net carrier
concentration of GaN samples. It is well known that there are many dangling bonds along
the edge dislocation lines, and they can introduce deep acceptor centers which may capture
electrons from the conduction band in n-type semiconductors (Read, 1954; Podor, 1966). It
has been proved that the negatively charged acceptors introduced by the dislocation line act
as scattering centers in n-type GaN (Ng et al., 1998; Look & Sizelove, 1999). Therefore, the
decrease of free electron concentration shown in Fig. 8 can be attributed to the compensation
effect from the increasing acceptor levels introduced by the edge dislocations. This result
confirms that the edge dislocations introduce acceptors in n-type GaN samples.
It is widely accepted that the yellow luminescence is caused by the transition of donor-
acceptor (DA) pairs (For example, Reshchikov & Morkoc, 2005). The average distance
Photodiodes - World Activities in 2011
342
between donors and acceptors plays a key role in determining the luminescence efficiency of
the radiative recombination in the yellow luminescence band. It is found that there are many
positively charged donors surrounding the negatively charged edge dislocation core in Si-
doped GaN (Krtschil et al., 2003). The transition probability of electrons and holes between
donors and acceptors will be higher around edge dislocations as the average distance of DA
pairs becomes shorter and the overlap integral between electron and hole wavefunctions
becomes larger, which will lead to an enhancement of the luminescence efficiency of the
yellow band by the edge dislocations.
Fig. 8. The ratio between integrated intensity of the yellow luminescence band to near-band-
edge emission (I
YL
/I
BE
) (solid squares) and the net carrier concentration (hollow triangles)
vs. DCXRD FWHM at the (102) plane for the ten GaN samples of series I .
In order to study the source of donor species involved in the yellow luminescence, a
different Si doping experiment was performed in which the series II GaN samples were
studied. The structural quality of the series II GaN samples was high, the DCXRD FWHM at
the (002) and (102) planes of these samples as narrow as 180 arcsec was obtained. Fig. 9
shows the PL spectra of samples D, E, F, and G, for which the SiH
4
fluxes used during
MOCVD growth were 0, 0.05, 0.22, and 0.45 nmol/min, respectively. The corresponding
electron concentrations are 5.0×10
15
cm
-3
, 1.5×10
16
cm
-3
, 8.8×10
16
cm
-3
, and 1.8×10
17
cm
-3
,
respectively. In Fig. 9, the PL intensity is normalized according to the intensity of the near-
band-edge emission. The ratio I
YL
/I
BE
increases as the SiH
4
flux increases, which is 0.15, 0.23,
0.32, and 0.35 for samples D, E, F, and G, respectively. It is well known that Si impurity
atoms act as shallow donors in GaN and can increase the electron concentration in GaN
samples. The PL results indicate that Si impurity has an influence on the relative intensity of
the yellow luminescence band. This is reasonable if the Si donors are involved in the yellow
luminescence in n-type GaN as a component of the related donor-acceptor pairs, although
the multiple origins of the yellow luminescence are proved to co-exist (For example,
Reshchikov & Morkoc, 2005). Due to the high quality of the GaN samples of series II which
have a very low background carrier concentration as small as 5.0×10
15
cm
-3
for the
unintentionally-doped GaN and a low dislocation density, a better observation of the
correlation between Si doping and relative intensity of the yellow luminescence in these Si-
GaN Based Ultraviolet Photodetectors
343
doped samples becomes possible. For example, as shown in the insets of Fig. 9, the PL
spectrum of sample G measured at 10K demonstrates a sharp peak of donor-bound exciton
luminescence at the energy of 3.490eV with an FWHM as narrow as 1.6 meV.
Fig. 9. RT PL spectra of GaN samples D, E, F, and G in series II with different Si doping,
which have the same DCXRD FWHM at the (102) plane as narrow as 180 arcsec. In the
figure the intensity of the near-band-edge luminescence peak at 3.42 eV is normalized. The
insets are the ω-scan rocking curve of DCXRD(right) and 10K PL spectrum(left) of sample G.
The above results suggest that the yellow luminescence is effectively enhanced by the DA
pair transitions from donor impurities such as Si to acceptors around the edge
dislocations in n-type GaN. It is also found that the edge dislocation and Si impurity play
important roles in linking the blue and yellow luminescence bands in n-type GaN films
(Zhao et al., 2009b). In addition, there is some relationship between the yellow
luminescence band and electron mobility of n-type GaN, but it is not a simple one (Zhao
et al., 2007c). In fact, even the intensity of yellow luminescence is often used as an
indicator of material quality for GaN, it does not have any monotonous correlation with
the electron mobility of GaN.
2.2 Fabrication of GaN based UV photodetectors
On the basis of material growth, the fabrication of GaN based UV photodetectors are
studied. Firstly the relationship between defects and performance of Schottky barrier
photodetectors is investigated, then the fabrication of p-i-n high performance UV avalanche
photodiodes are introduced, finally some new GaN photodetector devices are proposed.
2.2.3 Influence of defects on the responsivity of GaN Schottky barrier UV
photodetectors
In this section, the effect of defects on the responsivity of GaN Schottky barrier UV
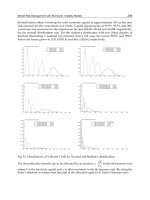
photodetectors is investigated (Zhao et al.,2007a). A schematic diagram of the Schottky
barrier photodetector structure is shown in Fig. 11. The top transparent Schottky barrier was
formed on the n
-
-GaN layer using Ni/Au (3nm/3nm) metal film, and the bottom Ohmic
contact to the n
+
-GaN layer was made with Ti/Al/Ti/Au metal. Table 3 lists the carrier
concentration in the n
-
-GaN layer and the DCXRD FWHM of three samples A, B, and C.
Photodiodes - World Activities in 2011
344
Fig. 10. Schematic diagram of GaN Schottky barrier ultraviolet photodetectors
Samples No. FWHM of DCXRD ( arcsec )
n
-
-GaN Layer
(002) (102)
A 190 195 Si-doped, n≈1.6×10
16
cm
-3
B 290 320 Si-doped, n≈1.0×10
17
cm
-3
C 230 245 undoped, n≈2.0×10
16
cm
-3
Table 3. The main difference in the structure parameters and epilayer XRD characterization
result of three photodetector samples
Fig. 11. The zero bias spectral response of Schottky barrier photodetector samples A, B and
C (See text), where sample C uses undoped GaN layer as n
-
-GaN layer, samples A and B
use lightly Si-doped ones .
We have investigated photocurrent spectra of many Schottky barrier photodetectors with
different n
-
-GaN/n
+
-GaN structure. Most of them show a high responsivity near the band edge
of GaN, which decreases with increasing photon energy due to the reduction of penetration
depth of light and the increase in surface recombination of photogenerated carriers. Fig. 11
depicts the spectral response at zero bias for three typical ultraviolet photodetector samples, A,
B and C. The n
-
-GaN layers in samples A and B are doped with Si, but have different carrier
concentrations n and DCXRD FWHM values, as shown in Table 3. The peak responsivity is
GaN Based Ultraviolet Photodetectors
345
about 0.20, 0.12 and 0.21 A/W for samples A, B, and C, respectively. Considering the n
-
-GaN
layers of sample A and B are both Si-doped, we firstly investigated the mechanism behind the
different responsivity for these two photodetectors. After the device simulation, it is confirmed
that the difference in the electron concentration can not be mainly responsible for the difference
in responsivity between these two Schottky photodetectors (Zhao et al.,2007a). Actually, sample
B has a higher dislocation density as shown by the DCXRD FWHM and a lower responsivity,
indicating that dislocations can play a role in decreasing the responsivity of GaN photodetector.
A lot of research work have discussed the behavior of dislocations in GaN,
and they have
confirmed that the dislocation cores are normally negatively charged in n-type GaN (Krtschil et
al., 2003). It is reasonable to conceive that dislocation-induced acceptor levels can increase the
recombination probability of photogenerated electron-hole pairs and thus reduce the
responsivity of GaN ultraviolet photodetectors (Zhao et al., 2006d). Therefore, normally the
responsivity of GaN based photodetectors can be improved through decreasing the dislocation
density of the epilayer structure.
It is noted that the properties of different kinds of n
-
-GaN layer, i.e., undoped or Si-doped,
may cause a difference in the responsivity of GaN Schottky barrier photodetectors. Fig. 13
shows a comparison of the spectral responses between samples A and C, where the n
-
-GaN
layer of sample C is not Si-doped. Compared with sample A, sample C shows an
unexpectedly higher peak responsivity of 0.21 A/W even though it has a higher dislocation
density. It suggests that the major difference between the two samples is caused by the Si
doping of n
-
-GaN layer. The positron annihilation experiment has confirmed that the
lightly Si doping can increase the concentration of Ga vacancies in comparison with
undoped n-type GaN, and lead to a decrease in the minority carrier diffusion length (Zhao
et al., 2006e). It is thus proposed that the photo-generated holes can be trapped by the Ga
vacancies. The n
-
-GaN layer in sample C has a lower concentration of Ga vacancies than in
samples A and B. Since the photocurrent in the investigated Schottky barrier photodetector
mainly comes from the drift current, the concentration of movable photogenerated holes in
the depletion region has a strong influence on the photocurrent. The Ga vacancies will trap
photogenerated carriers and increase their recombination probability in the depletion
region, leading to a serious reduction of responsivity. The Ga vacancies may play an
important role in the reduction of responsivity of GaN Schottky barrier photodetectors. It is
also found that the Ga vacancies may lead to an increase of leakage current of GaN Schottky
barrier photodetetors (Zhao et al., 2010a). Of course, it is also possible that other defects
such as Ga vacancies complexes or unknown defects due to the Si doping will increase the
recombination of photogenerated electron-hole pairs and reduce the photocurrent.
From the above-mentioned experiment results, using an undoped n
-
-GaN layer with a
lower dislocation density is obviously necessary to achieve a higher responsivity in the GaN
Schottky barrier photodetectors. In addition, the unexpected decrease in measured
responsivity are observed in a specific GaN Schottky barrier photodetector at high reverse
bias voltage (Zhang et al., 2008). A model is proposed which explains the phenomena and
suggests that the choice of load resistance is also important for the application of GaN UV
photodetectors.
2.2.4 Fabrication of GaN avalanche photodiodes
In this section, the fabrication and characterization of GaN-based p-i-n avalanche
photodiodes (APD) with large active area are discussed (Liu et al., 2009), which is suitable