Progress in Biomass and Bioenergy Production Part 12 ppt
Bạn đang xem bản rút gọn của tài liệu. Xem và tải ngay bản đầy đủ của tài liệu tại đây (959.33 KB, 30 trang )
Characterization of Biomass as Non Conventional Fuels by Thermal Techniques
319
residue of oil residue already mentioned before. In particular, the effect of inert vs mild
oxidizing conditions and the effect of slow vs fast heating are presented.
Pyrolysis and oxidative pyrolysis experiments have been carried out in the tubular reactor
described in Fig. 4. The reaction products were quickly cooled down as they flowed through
250ml bubblers held at 0°C and -12°C respectively. Tar captured by the bubblers has been
characterized off line by means of simulated distillation. The gas which passed through the
bubblers was sent directly to a micro-GC Agilent 3000° equipped with four columns
(Molesieve MS5A, Poraplot U, Poraplot allumina and OV1) in order to analyse the gaseous
products on line.
150°C 900°C350°C 600°C 900°C
Fig. 14. MS curves from experiments TG-IP of a residue of the oil industry.
The overall char yield was between 19-22% in all the tests. The tar yield was around 10% but
turned out to be rather scattered. The analysis of the tars collected by the bubblers is
reported in Tab. 6. The weight fractions corresponding to different boiling points are
reported. It can be observed that tar produced from slow pyrolysis under inert conditions
has a minor fraction of components with boiling point between 170-300°C, a 60% weight
fraction has boiling point in the range 350-500°C and 30% above 500°C. These figures are
consistent with the weight loss measured by TGA. Tar obtained by fast pyrolysis under inert
conditions and by slow pyrolysis with a mild oxidizing atmosphere both contain a larger
fraction with boiling point below 350°C.
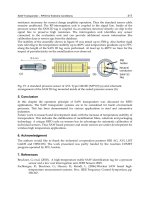
The composition of the gas leaving the bubblers during an experiment of slow pyrolysis in
He are reported in Fig. 15. It can be observed that hydrocarbons with more than two carbon
atoms are released in two stages. The first, more pronounced one, occurs between 150-
400°C, the second between 400 and 600°C. Methane is instead released over the entire
temperature range of the experiment. Under moderately oxidizing conditions similar
profiles are obtained up to 300°C, but at higher temperatures CO
2
is produced at the
expense of methane and other hydrocarbons.
Progress in Biomass and Bioenergy Production
320
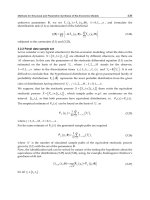
Figure 16 reports the cumulative yields of different gaseous species throughout pyrolysis in
the tubular reactor under different conditions. It can be observed that during slow heating rate
pyrolysis in helium the product gas contains mainly CH
4
(90%) and small percentages of CO,
CO
2
, C
2
H
6
(3-5% each). The presence of oxygen in the pyrolysis atmosphere at low
concentration levels (0.1%) produces a gas with 50% di CO
2
and 40% CH
4
. Upon fast heating
pyrolysis rate under inert conditions produces a rather different gas, with a marked increase in
C
2
H
4
, which becomes the most abundant species, followed by CH
4
, C
2
H
6
, CO, CO
2
.
Experiment TR-IP-SH
w%
Experiment TR-OP-SH
w%
Experiment TR-OP-I
w%
1st bubbler 2nd bubbler 1st bubbler 1st bubbler
<170 0 0 0 <170 0
170-350 4.7 12.3 18 170-350 4.7
350-500 61.5 55.8 58 350-500 61.5
500-800 33.8 31.9 24 500-800 33.8
Table 6. Boiling points of tar collected during pyrolysis in lab scale reactor of a residue of the
oil industry
Char combustion (TR-CC-SH, TR-CC-I)
Char combustion experiments have been carried out in a fluidized bed reactor (FB-C)
consisting of a 1.1 m long quartz tube with 20 mm id The tube is heated by a vertical
electrical furnace with 110 mm ID and length 750 mm. Gas flows bottom up and passes
through a distributor positioned at the centre of the tube. The gas flow rate is 100NL/h. A
bed of 20mm quarzite is used with particle size between 300-400 µm. Exhaust gas is
analysed on line by ABB IR analysers. In each test initially the bed is fluidized by nitrogen.
One single particle of approximately 5mm diameter is fed from the top of the reactor at a
fixed temperature (between 500-600°C). After pyrolysis is complete, the gas is switched from
nitrogen to an O
2
/N
2
mixture (with O
2
at values between 4-15%).
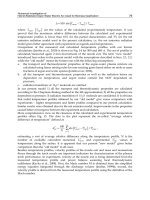
Figure 17 shows typical results of a fluidized bed experiment. In the example reported in
this figure the particle was fed at t=100s under inert conditions. The bed was at 600°C. The
progress of pyrolysis can be followed from the profile of CH
4
. The time of pyrolysis in this
experiment was 58s. At time t=800s oxygen was let into the reactor at the desired level of
concentration (15% in the example), this produced a fast increase of combustion products.
The CO and CO
2
profiles obtained during this stage are reported in the figure and show
that char combustion took 430s. Notably in all the experiments devolatilization took
roughly 60s. Pyrolysis time was indeed not affected by the operating conditions, in the
range investigated, suggesting that the process was dominated by heat and mass transfer
effects.
The char combustion time increased from 430s to 1500s when the temperature was lowered
from 600 to 500°C at a value of oxygen concentration of 15% and from 430s to 1700s when
oxygen concentration was lowered from 15 to 4 % at the temperature of 600°C. A regression
of data of average rate of char combustion at different temperature and oxygen
concentration allows to estimate the values of kinetic parameters.
Characterization of Biomass as Non Conventional Fuels by Thermal Techniques
321
t, min
0 20406080100
0
10
20
30
40
50
60
t, min
0 20406080100
0
10
20
30
40
50
60
C2H6
C2H4
C3H8
C3H6
C4
nC5
0
200
400
600
800
1000
1200
200°C 600°C20°C
iso
CH4
ppm
Fig. 15. Gas evolved during TR-IP experiment of a residue of the oil industry
0
10
20
30
40
50
60
70
80
90
100
CO
CO2
CH4
C2H6
C2H4
C2H2
C3H8
C3H6
nC4
nC5
C5H10
nC6
%
Mol
TR-IP-F
TR-IP-S
TR-IP-S
0
10
20
30
40
50
60
70
80
90
100
CO
CO2
CH4
C2H6
C2H4
C2H2
C3H8
C3H6
nC4
nC5
C5H10
nC6
%
Mol
TR-IP-F
TR-IP-S
TR-IP-S
Fig. 16. Analysis of gas evolved during TR-IP experiment of a residue of the oil industry.
Progress in Biomass and Bioenergy Production
322
Fig. 17. Profiles of O
2
CO and CO
2
released during an experiment of TRCCI at 600°C in the
fluidized bed reactor for a residue of the oil industry
7. Conclusions
An experimental procedure has been proposed to investigate at a lab-scale the potential of
biomasses as fuels for pyrolysis and combustion processes. The experimental work coupled
physico-chemical characterization tests with pyrolysis under inert and oxidizing conditions
and char combustion using different experimental techniques.
Thermogravimetric analysis provides useful information on the temperature range in which
pyrolysis/combustion of the fuel can be carried out and allows to estimate the rate and
kinetics of the reactive processes. Moreover it provides useful information on the effect of
Characterization of Biomass as Non Conventional Fuels by Thermal Techniques
323
inert/oxidative conditions on the products yield. Examples reported in this paper show that
the presence of oxygen upon heating favours pyrolysis reactions in many cases, but when
biomasses have a high content of metals and inorganic matter the presence of oxygen
hinders the pyrolitic reactions at low-moderate temperature through formation of oxygen
complexes.
Tests of pyrolysis in lab scale reactors show that the composition of the pyrolysis gas and tar
are strongly affected by the heating rate and by the presence of even minor concentrations of
oxygen. As far as gas composition is concerned, slow heating under rigorously inert
conditions produces mainly methane and minor amounts of hydrogen, methane, propane,
ethylene, CO, CO
2
. When heating is carried out in an even mild oxidizing atmosphere the
gas produced contains mainly CO
2
and CH
4
and modest amounts of alkanes and alkenes of
higher order. As far as tar is concerned, both fast heating and the presence of oxygen
increase the low boiling point fraction.
Experiments in a fluidized bed reactor allows to estimate the time of pyrolysis and of char
combustion under different conditions.
Characterization of the solid products by ICP and XRD allows to investigate the fate of
mineral matter and metals. The examples reported for some metal rich fuels show that
metals mainly remain in the solid residue during pyrolysis under rigorously inert
conditions (up to 600°C). On the contrary pyrolysis under oxidizing conditions and char
combustion at temperatures in excess of 800°C produce the oxidation and loss of selected
volatile metals, most likely in their oxidized forms. This result has severe environmental
implications and needs to be taken into account in process design.
8. Acknowledgments
Several people contributed to the work and are gratefully acknowledged, in particular Mr
Vitale Stanzione for ICP and GC analysis, Dr Paola Ammendola and Dr Giovanna Ruoppolo
for pyrolysis experiments in the tubular reactor, Mr Sabato Russo for SEM analysis. Special
thanks to Mr Luciano Cortese for the valuable support in several aspects of the experimental
work and Dr Riccardo Chirone for guidance and assistance.
9. References
[1] Pedersen K.H, Jensen A.D. Berg M., Olsen L.H , Dam-Johansen K., Fuel Proc.Tech. 90
(2009) 180-185
[2] Senneca O., Chirone R., Salatino P., J. Anal. Appl. Pyrolysis 71 (2004) 959;
[3] O. Senneca, P. Salatino, Combust. Flame 3 (2006) 578
[4] Braguglia C.M., Marani D., Mininni G., Mescia P., Bemporad E., Carassiti F. Water, Air,
and Soil Pollution 158 (2004) 193-205
[5] Tillman D.A., Harding N.S., Fuels of Opportunity, Characteristics and Uses in
Combustion Systems (2004) 29-87
[6] Struckmann P., Dieckmann H J., Brandenstein J., Ochlast M,. VGB Power Tech 84 (2004)
72-76
[7] Day M., Cooney J.D.,Touchette-Barrette C., Sheehan S.E., Fuel Proc.Tech. 63 (2000) 29–44
[8] Nnorom, I. et Al., 2007, Resources, Conservation and Recycling 52 (2008) 5
[9] Afzal A., Chelme-Ayala P., El-Din A.G., El-Din M.G., Water Environment Research
(2008) 1397-1415
Progress in Biomass and Bioenergy Production
324
[10] Senneca O., Fuel 87 (2008) 3262 – 3270
[11] Monte M.C., Fuente E., Blanco A. , Negro C., Waste Management 29 (2009) 293–308
[12] H.L. Friedman, J. Polym. Sci. C6 (1964) 183.
[13] T. Ozawa, J. Therm. Anal. 31 (1986) 547.
[14] H.E. Kissinger, Anal. Chem. 29 (1957) 1702.
[15] T. Ozawa, J. Therm. Anal. 2 (1970) 301.
[16] T. Ozawa, Bull. Chem. Soc. Jpn. 38 (1965) 1881.
[17] J.H. Flynn, L.A. Wall, J. Polym. Sci B4 (1966)
[18] Senneca O, Fuel Processing Technology 88 (2007) 87-97
[19] Salatino P., Senneca O., Masi S., Gasification of a coal char by oxygen and carbon
dioxide, Carbon, 36 (1998) 443
17
Estimating Nonharvested Crop Residue
Cover Dynamics Using Remote Sensing
V.P. Obade
1
, D.E. Clay
1
, C.G. Carlson
1
,
K. Dalsted
1
, B. Wylie
2
, C. Ren
1
and S.A. Clay
1
1
South Dakota State University
2
United States Geological Survey (EROS), Sioux Falls
United States of America
1. Introduction
Non harvested above and below ground carbon must be continuously replaced to maintain
the soil resilience and adaptability. The soil organic carbon (SOC) maintenance requirement
is the amount of non-harvested carbon (NHC) that must be added to maintain the SOC
content at the current level (NHC
m
) (Mamani-Pati et al., 2010; Mamani-Pati et al., 2009). To
understand the maintenance concept a basic understanding of the carbon cycle is needed
(Mamani-Pati et al., 2009). The carbon cycle is driven by photosynthesis that produces
organic biomass which when returned to soil can either be respired by the soil biota or
contribute to the SOC. The rates that non-harvested biomass is converted from fresh
biomass to SOC and SOC is converted to CO
2
are functions of many factors including,
management, climate, and biomass composition. First order rate mineralization constants
for nonharvested carbon (k
NHC
) and SOC (k
SOC
) can be used to calculate half lives and
residence times. Carbon turnover calculations are based on two equations,
[]
NHC a m
SOC
kNHCNHC
d
dt
=−
(1)
k
SOC
× SOC
e
= k
NHC
× NHC
m
(2)
In these equations, SOC is soil organic C, NHC
a
is the non-harvested carbon returned to soil,
NHC
m
is the nonharvested carbon maintenance requirement, k
soc
is the first order rate
constant for the conversion of SOC to CO
2
, and k
NHC
is the first order rate constant for the
conversion of NHC to SOC (Clay et al., 2006). These equations state that the temporal
change in SOC (dSOC/dt) is equal to the non-harvested carbon mineralization rate constant
(k
NHC
) times the difference between the amounts of carbon added to the soil (NHC
a
) and the
maintenance requirement (NHC
m
) and that at the SOC equilibrium point (SOC
e
), the rate
that non-harvested C (NHC) is converted into SOC (k
NHC
× NHC
m
) is equal to the rate that
SOC is mineralized into CO
2
(k
SOC
× SOC
e
). Through algebraic manipulation, these
equations can be combined to produce the equation,
aSOC
eNHC NHC e
NHC k
SOC 1
SOC k t k SOC
d
d
=+
×
(3)
Progress in Biomass and Bioenergy Production
326
When fit to a zero order equation, the y-intercept and slopes are
SOC
NHC
k
k
and
NHC
1
k
e
SOC×
,
respectively.
Based on this equation, NHC
m
, k
NHC
, and k
SOC
can be calculated using the equations, NHC
m
= b × SOC
e
; k
NHC
= 1/ (m × SOC
e
); and k
SOC
= b/(m × SOC
e
). This approach assumed that
above and below ground biomass make equal contributions to SOC; that the amount of
below ground biomass is known; and NHC is known and that initial (SOC
e
) and final
(SOC
final
) SOC values are near the equilibrium point. Advantages with this approach are
that k
SOC
and k
NHC
are calculated directly from the data and the assumptions needed for
these calculations can be tested. A disadvantage with this solution is that surface and
subsurface NHC must be measured or estimated. Remote sensing may provide the
information needed to calculate surface NHC, through estimating the spatial variation of
crop residues which are a major source of NHC.
Traditionally crop residue cover estimates have relied on visual estimation through road
side surveys, line-point transect or photographic methods (CTIC, 2004; McNairn and Protz,
1993; Serbin et al., 2009 a). However, such ground-based survey methods tend to be time-
consuming and expensive and therefore are inadequate for crop residue quantification over
large areas (Daughtry et al., 2005; Daughtry et al., 2006). The need to improve these
estimates has prompted much research on the extraction of surface residue information
from aerial and satellite remote sensing (Bannari et al., 2006; Daughtry et al., 2005; Gelder et
al., 2009; Serbin et al., 2009 a & b; Thoma et al., 2004). Previous research has shown crop
residues may lack the unique spectral signature of actively growing green vegetation
making the discrimination between crop residues and soils difficult (Daughtry et al., 2005).
Daughtry and Hunt (2008) reported that dry plant materials have their greatest effect in the
short wave infra-red (SWIR) region between 2000 and 2400 nm related to the concentration
of ligno-cellulose in dry plant residue.
Other studies have proposed the Cellulose Absorption Index (CAI), the Lignin Cellulose
Absorption index (LCA) and the Shortwave Infrared Normalized Difference Residue
Index (SINDRI) for estimating field residue coverage (Daughtry et al., 2005; Daughtry et
al., 2006; Thoma et al., 2004; Serbin et al., 2009 c). However, neither CAI, LCA nor
SINDRI are currently practical for use in spaceborne platforms (Serbin et al., 2009 a). For
example, EO-1 Hyperion which was sensitive to the spectral ranges of CAI and LCA (2100
and 2300 nm wavelengths), is past its planned operational lifetime and suffers bad
detector lines (USGS, 2007), while the shortwave infrared (SWIR) detector for ASTER
satellite failed in April, 2008 (NASA, 2010; Serbin et al., 2009 c). Therefore, indices that
utilize the multispectral wavelength ranges (450-1750 nm) appear to be the most viable
economical alternative. The objective of this research was to assess if remote sensing can
be used to evaluate surface crop residue cover, and the amount of nonharvested biomass
returned to soil.
2. Materials and methods
2.1 Study area
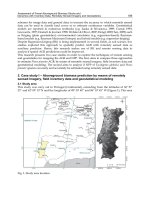
A randomized block field experiment was conducted in South Dakota (SD) in the years 2009
and 2010. The coordinates at the site were 44˚ 32'07"North and 97˚ 22' 08"West. Soil at the
site was a fine-loamy, mixed, superactive, frigid typic calciudoll (Buse). The treatments
considered were residue removed (baled) or returned (not baled) with each treatment
Estimating Nonharvested Crop Residue Cover Dynamics Using Remote Sensing
327
replicated 36 times. The field was chisel plowed and corn was seeded at the site during the
first week of May in 2009 and 2010. The row spacing was 76 cm and the population was
80,000 plants per hectare. Following physiological maturity in October, grain and stover
yields were measured. In all plots corn residue was chopped after harvesting. In residue
removal plots, stover was baled, and removed. The amount of residue remaining after
baling was measured in at 16 locations that were 0.5806 m
2
in size. For these measurements,
the stover was collected, dried, and weighed. Approximately 56% (±0.08) of the corn
residue was removed by this process. Following residue removal, soil surface coverage was
measured using the approach by Wallenhaupt (1993) on 27
th
November 2009 and 13
th
November 2010.
2.2 Field measurements and model development
Spectral reflectance measurements of corn residues were collected with a Cropscan
handheld multispectral radiometer (Cropscan Inc., Rochester, Minnesota) under clear sky
conditions between 10 a.m. and 3 p.m. for all the field sites on 28
th
November 2009 and
13
th
November 2010. The Cropscan radiometer measures incoming and reflected light
simultaneously. It measures within the following band widths, 440-530 (blue), 520-600
(green), 630-690 (red), 760-900 (near infra red, NIR), 1550-1750 (mid infra red, MIR),
for wide (W) bands, and 506-514, 563-573, 505-515, 654-666, 704-716, 755-765,
804-816, 834-846, 867-876, 900-910, 1043-4053 nanometer (nm) for narrow wavelength
bands.
The Cropscan radiometer was set at a height of 2 m above ground, so as to approximate a
1 m
2
spatial resolution on the ground. The Cropscan was calibrated by taking five
spectral radiance readings on a standard reflectance, white polyester tarp, before
beginning the scanning and after the whole field had been scanned. Scanning errors
were minimized by following the protocols as reported by Chang et al. (2005). For
calculations it is assumed that the irradiance flux density at the top of the radiometer is
identical to the target. Reflectance data were corrected for temperature and incident light
angles, relative to top of the sensor. Based on measured reflectance information, four
wide reflectance bands and four indices derived from the wide spectral bands were
calculated (Table 1).
Vegetation
Index
Equation
(modified)
Reference
Normalized Difference
Vegetation Index (NDVI
w
)
NDVI
w
=
(R
830
-R
660
)/(R
830
+R
660
)
Rouse et al. 1974
Green Normalized Difference
Vegetation Index
w
(GNDVI
w
)
GNDVI
w
=
(R
830
-R
560
)/(R
830
+R
560
)
Daughtry et al. 2000
Gitelson and Merzlyak
1996
Normalized Difference Water
Index (NDWI
w
)
NDWI
w
=
(R
830
-R
1650
/(R
830
+R
1650
)
Gao 1996
Blue Normalized Difference
Vegetation Index (BNDVI
w
)
BNDVI
w
=
(R
830
-R
485
)/(R
830
+R
485
)
Hancock and
Dougherty 2007
Table 1. Spectral band combinations (indices)
Progress in Biomass and Bioenergy Production
328
2.3 Statistical analysis
Proc Mixed available within the Statistical Analysis System (SAS Institute, North Carolina)
software, was used to determine reflectance differences in the residue removed and
returned plots. Correlation (r) coefficients between reflectance values and weights of stover
returned and % surface residue cover were determined. Finally, graphs of percent residue
cover versus spectral band and index
for the models with the highest
correlations were
compared.
3. Results and discussion
In 2009, 28.8 % of the soil was covered with residue in the removed (baled) plots, while in
2010, 54% of the soil was covered with residue (Table 2). In the residue returned (not baled)
plots, the surface cover was 100 and 70%, in 2009 and 2010, respectively. The residue
removal plots (28.8% cover) in 2009 had the lowest reflectance in the green, red, and NIR
bands, while the residue returned plots in 2010 had the highest reflectance in the green, red,
NIR, and MIR bands. These results imply that corn residues have a relative high albedo,
compared to soil. Slightly different results would be expected in soybean (Glycine max)
where Chang et al. (2004) did not detect reflectance differences between bare and soybean
residue covered soil.
Year Residue
Percent
Cover
Weight
Mg/ha
Blue W. Green W. Red W. NIR W. MIR W. NDVIw GNDVIw BNDVIw NDWIw
2009 Removed 28.8 d 3.7a 4.60 c 6.50 c 8.84 c 13.75 d 19.50 b 0.22b 0.36b 0.50b -0.0035b
2009 Returned 100 a 7.1b 7.72 a 11.10 ab 15.60 b 23.05 c 24.02 a 0.20c 0.35c 0.50b 0.026a
2010 Removed 54.2 c 2.7c 6.60 b 11.22 b 16.53 b 26.6 b 26.61 a 0.24a 0.41a 0.60a -0.15c
2010 Returned 70.0 b 5.5d 7.18 a 12.28 a 18.16 a 28.91 a 27.30 a 0.23ab 0.41a 0.60a 0.02ab
p-value 0.0001 0.001 0.0001 0.0001 0.0001 0.0001 0.0005 0.0001 0.0047 0.1691 0.0001
2009 64.4 10.9 6.2 8.77 12.2 18.4 21.76 0.21b 0.36 0.50 -0.08
2010 62.1 7.1 6.9 11.75 17.3 27.74 26.96 0.23a 0.41 0.60 0.011
p-value 0.464 0.001 0.14 0.0010 0.0002 0.0001 0.0368 0.013 0.0001 0.0001 0.0003
*Values within a column that have different letters are significantly different at the 0.05 probability level.
Table 2. Variation in residue cover over several wavelengths reflected from corn residues on
the ground near Badger site, SD in the years 2009 and 2010.
Blue Green Red NIR MIR
r
Residue returned (ton/ha) 0.39 0.30 0.27 0.22 0.002
% residue cover 0.61 0.56 0.53 0.48 0.24
NDVI
w
GNDVI
w
NDWI
w
BNDVI
w
Residue returned (ton/ha) -0.35 -0.24 0.35 -0.19
% residue cover -0.34 -0.15 0.47 0.01
Table 3. The correlation between the amounts of residue returned in 2009 and 2010 to the
soil and the ground cover with surface reflectance. r values greater than 0.174 are
significant at the 0.05 level.
Estimating Nonharvested Crop Residue Cover Dynamics Using Remote Sensing
329
The correlation coefficient between the residue returned in ton/ha and percent residue
cover with surface reflectance are shown in Table 3. The correlation coefficients between
residue returned and reflectance ranged from 0.002 in the MIR band to 0.39 in the blue band.
For the % surface residue cover, higher r values were observed. These results suggest that
surface reflectance measurements were better at predicting the crop residue coverage than
residue amount. The highest r value between % ground cover and reflectance was observed
for the blue band. The different bands previously have been reported for different uses
( The blue band is useful for
distinguishing soil from vegetation, while green is useful for assessing plant vigor. The NIR
(770-900 nm) and short-wave infrared (1550 – 1750 nm) discriminates biomass content from
soil moisture content. Although blue has a high correlation with surface residue cover,
atmospheric scattering may reduce its suitability for space-based sensors (Lillesand and
Kiefer, 2000; Wang et al., 2010).
The amount of residue retained on the soil was correlated to NDVI, GNDVI, and NDWI,
while the percent coverage was correlated to NDVI and NDWI. Of the indices
determined, NDWI
w
had the highest r value with percent residue cover followed by
NDVI
w
, GNDVI
w
, and BNDVI
w
respectively. It is important to note, that the results are
limited by the boundary conditions of the experiment. Although only the percent residue
cover and residue weights versus the reflectance were analyzed, other factors such as soil
cover, color or moisture could have impacted the reflectance values (Barnes et al. 2003;
Daughtry et al., 2005; Daughtry et al., 2006; Pacheco and McNairn, 2010; Thoma et al.,
2004).
A comparison of the reflectance data across years for the blue band suggests that a zero
order equation (y = 4.31 + 0.036x; r
2
= 0.38) could explain the relationship between
reflectance and surface coverage (Fig. 1). Slightly different results were observed for the
NDWI
w
indices where a second order quadratic equation (y = -0.22 + 0.005x – 0.0000263 x
2
;
R
2
= 0.26) was used to describe the relationship with surface coverage. The graph of %
residue cover versus NDWIw flattens after the 60 % residue cover which implies that
NDWI
w
may saturate with increasing coverage. A limitation of this study is that only one
site was analyzed, therefore any models generated would be suitable for the specific site and
only after fall harvest. Other errors can occur when extrapolating plot measurements data
to the whole field coverage. In future, research that confirms the finding for other sites and
harvesting approach needs to be conducted.
4. Conclusion
The main objective of this study was to investigate the potential of remote sensing
to assess residue coverage. The research showed that surface reflectance was more closely
correlated with percent cover than the amount of residue returned. Of the spectral
band widths measured, reflectance in the blue range provided the most consistent results
across the two years. NDWI
w
had a higher correlation with residue returned and % cover
than NDVI
w
, GNDVI
w
, or BNDVI
w
. Future studies should not only consider more field
sites, but incorporate factors such as the decomposition rates of residues on spectral
reflectance and harvesting approaches (see Daughtry et al. 2010), so as to develop an
accurate and standard approach for mapping residue cover in real time over large
geographic areas.
Progress in Biomass and Bioenergy Production
330
% cover
0 20406080100120
% Blue reflectance
2
4
6
8
10
12
14
2009
2010
%
cover
0 20 40 60 80 100 120
NDWI
-0.4
-0.3
-0.2
-0.1
0.0
0.1
0.2
0.3
Fig. 1. Percent residue cover versus spectral bands (top) and NDWI
w
index (below)
5. Acknowledgements
Funding for this project was provided by NASA, South Dakota Corn Utilization Council, SD
2010 initiative, SD Soybean Research and Promotion Council.
6. References
Bannari, A., Pacheco A., Staenz, K., McNairn, H., Omari, K. 2006. Estimating and mapping
crop residue cover on agricultural lands using hyperspectral and IKONOS data.
Remote Sensing of Environment 104: 447-459.
Barnes, E. M., Sudduth, K.A., Hummel, J. W., Lesch, S. M., Corwin, D. L., Yang, C., Daughtry,
C.T. and Bausch, W. C. 2003. Remote- and ground-based sensor techniques to map soil
properties. Photogrammetric Engineering & Remote Sensing. Vol. 69, No. 6: 619–630.
Chang J., Clay S., Clay D., Aaron D., Helder D., Dalsted K. 2005. 'Clouds influence precision and
accuracy of ground-based spectroradiometers'. Communications in Soil Science and Plant
Analysis 36: 1799-1807.
Estimating Nonharvested Crop Residue Cover Dynamics Using Remote Sensing
331
Chang, J., Clay, S.A.and Clay, D.E. 2004. Detecting weed free and weed infested areas of a
soybean (Glycine max) field using NIR reflectance data. Weed Sci. 52:642-648.
Clay, D.E., C.G. Carlson, S.A. Clay, C. Reese, Z. Liu, and M.M. Ellsbury. 2006. Theoretical
Derivation of New Stable and Non-isotopic Approaches for Assessing Soil Organic
C Turnover. Agron. J. 98:443-450.
CTIC. 2004. National survey of conservation tillage practices. Conservation Technology
Information Center, CTIC, West Lafayette, IN.
(accessed on 26
th
September 2009).
Daughtry, C. T., Doraiswamy, P. C., Hunt Jr., E. R., Stern, A.J., McMurtrey, J. E., Prueger,
J.H. 2006. Remote Sensing of crop residue cover and soil tillage intensity. Soil and
Tillage Research 91: 101-108.
Daughtry, C. T., Hunt Jr., E. R, Doraiswamy, P. C., McMurtrey, J. E. 2005. Remote sensing
the spatial distribution of crop residues. Agronomy Journal 97: 864–871.
Daughtry, C. T., Hunt Jr., E.R. 2008. Mitigating the effects of soil and residue water contents
on remotely sensed estimates of crop residue cover. Remote Sensing of Environment
112: 1647-1657.
Daughtry, C. T., Serbin, G., Reeves III, J. B., Doraiswamy, P. C., Hunt Jr., E.R. 2010. Spectral
reflectance of wheat residue during decomposition and remotely sensed estimates
of residue cover. Remote Sensing 2: 416-431.
Daughtry, C. T., Walthall, C.L., Kim, M.S., Brown de Colstoun, E., McMurtrey, J.E. 2000.
Estimating corn leaf chlorophyll concentration from leaf and canopy reflectance.
Remote Sensing of Environment 74: 229–239.
Gao, B.C. 1996. NDWI—a normalized difference water index for remote sensing of
vegetation liquid water from space. Remote Sensing of Environment 58: 257–266.
Gelder, B. K., Kaleita, A. L., Cruse, R. M. 2009. Estimating mean field residue cover on
midwestern soils using satellite imagery. Agronomy Journal 101: 635–643.
Gitelson, A., Merzlyak, M. 1996. Signature analysis of leaf reflectance spectra: algorithm
development for remote sensing of chlorophyll. J. Plant Physiol. 148: 494-500.
Hancock, D.W., Dougherty, C.T. 2007. Relationships between blue- and red-based
vegetation indices and leaf area and yield of alfalfa. Crop Science 47: 2547-2556.
Lillesand, T., and Kiefer, R. 2000. Remote Sensing and Image Interpretation. New York: John
Wiley and Sons, Inc. ISBN 0-471-25515-7.
Mamani-Pati, F., D.E. Clay, C.G. Carlson, S.A. Clay, G. Reicks, and K. Kim. 2010. Nitrogen
Rate, Landscape Position, and Harvest Corn Stover Impacts on Energy Gains and
carbon budgets of Corn Grown in South Dakota. Agron. J. 102:1535-1541.
Mamani Pati, E.M., D.E. Clay, C.G. Carlson, and S.A. Clay. 2009. Calculating soil organic
carbon maintenance using stable and isotopic approaches: A review. P. 189-216.
In E. Lichtfouse (ed.). Sustainable Agricultural Reviews: Sociology, Organic
Farming, Climate Change and Soil Science, Springer.
McNairn, H., Protz, R. 1993. Mapping corn residue cover on agricultural fields in Oxford
county, Ontario, using thematic mapper. Canadian Journal of Remote Sensing 19: 152-
159.
NASA 2010. NASA jet propulsion laboratory SWIR-ASTER user advisory.
(accessed online 14
th
August, 2010)
Progress in Biomass and Bioenergy Production
332
Pacheco, A. and McNairn, H. 2010. Evaluating multispectral remote sensing and spectral
unmixing analysis for crop residue mapping, Remote Sensing of Environment, 114:
2219-2228.
Rouse, J., Haas, R., Schell, J., Deering, D., and Harlan, J.C. 1974. Monitoring the vernal
advancements and retrogradation of natural vegetation. NASA/GSFC, Greenbelt,
MD.
Serbin G., Craig T., Daughtry C.S.T., Hunt Jr., E. R., Brown, D.I., McCarty, G.W. 2009a.
Effect of soil spectral properties on remote sensing of crop residue cover. Soil
Science of America Journal 73: 1545-1558.
Serbin G., Daughtry, C.S.T., Hunt Jr., R., Reeves J., Brown D.I. 2009b. Effect of soil
composition and mineralogy on remote sensing of crop residue cover. Remote
Sensing of Environment 113: 224-238.
Serbin, G., Hunt Jr., E. R., Daughtry, C.S.T., McCarty, G. W., Doraiswamy P. C. 2009c. An
improved ASTER index for remote sensing of crop residue. Remote Sensing 2009
1: 971-991.
Thoma, D., Gupta, C., Bauer, E. 2004. Evaluation of optical remote sensing models for crop
residue cover assessment. Journal of Soil and Water Conservation 59: 224-233.
USGS. 2007. Earth Observing 1 (EO-1), Sensors-Hyperion. eo1.usgs.gov/hyperion.php
(Accessed 30
th
May, 2010). EROS data center, USGS, Sioux Falls, SD.
Wang Y., Lyapustin, A. I., Privette, J. L., Cook, R. B., SanthanaVannan, S. K., Vermote, E.
F., Schaaf, C.L. 2010. Assessment of biases in MODIS surface reflectance due to
Lambertian approximation. Remote Sensing of Environment 114: 2791–2801.
Wollenhaupt, N. 1993. Estimating residue : line transect method. G1570. MU Extension.
Available at
18
Activated Carbon from Waste Biomass
Elisabeth Schröder
1
, Klaus Thomauske
1
, Benjamin Oechsler
1
,
Sabrina Herberger
1
, Sabine Baur
1
and Andreas Hornung
2
1
Institute for Nuclear and Energy Technologies, Karlsruhe Institute of Technology (KIT)
2
European Bioenergy Research Institute (EBRI), Aston University, Birmingham
1
Germany
2
United Kingdom
1. Introduction
As a result of environmental requirements in many countries and new areas of application
the demand on activated carbon is still growing. Due to the unavailability of the main basic
materials like hard coal, wood or coconut shells in many countries other biomass matters
were tested for their appropriateness of activated carbon production.
The objective of this experimental work is the conversion of waste biomass into activated
carbon. Waste biomass like straw matters, olive stones, nut shells, coffee grounds and spent
grain is converted thermally in two steps. First the biomass undergoes a pyrolysis process at
500°C–600°C in nitrogen atmosphere. The gaseous and liquid pyrolysis products can be
used energetically either for heating the facilities or for electricity production.
Second, the solid residue, the char, is treated in an activation process at 800°C–1000°C in
steam atmosphere in order to enhance the char surface area which was analyzed by
standard BET method. The increase of surface area depends on the type of biomass and on
the activation parameters. The production methods were investigated in lab-scale facilities
whereas a pilot scale reactor was designed for the transformation of the discontinuous
activation process to a continuous production process.
The use of agricultural by-products for activated carbon production as well as the influence of
ash content, pyrolysis and activation conditions on the activated carbon quality is investigated
by many authors. The high ash content of rice straw makes it difficult to achieve a sufficiently
high surface area (Ahmedna et al., 2000). The influence of a one step and a two step thermal
treatment of rice straw in CO
2
atmosphere is discussed in (Yun et al., 2001). The two step
treatment leads to higher surface areas than the one step treatment which correspond to the
own results. Higher temperatures of physical activation in CO
2
atmosphere leads to pore
widening which causes an increase of mesopores. Physical activation by the use of an
oxidizing gas like steam or CO
2
results in carbons with low surface area whereas chemical
activation enhances the carbon surface area (Ahmedna et al., 2000). Chemical activation of rice
husks and rice straw is investigated in (Guo et al., 2002; Oh & Park, 2002). The impregnation of
rice precursors with KOH or NaOH enhances the surface area. In addition the activation
temperature can be lowered. Washing rice straw with alkaline solutions like NaOH allows to
reduce the ash content as shown in Table 1 and (Huang et al., 2001). Carbonisation and
activation of pretreated rice straw leads to higher surface areas than of non-treated straw
Progress in Biomass and Bioenergy Production
334
matters but only in a certain range of washing time and temperature due to the effect that
lignin and hemicelluloses are dissolved as well which leads to the reduction of straw carbon
content (Finch & Redlick 1969; Sun et al. 2001). Ash extraction of straw matters is also
discussed in (Di Blasi et al., 2000; Jensen et al., 2001a, 2001b). Activated carbons from olive
stones and other waste biomass matters are given in (Daifullah & Girgis, 2003). High porosity
can be attained by the use of phosphoric acid prior to heat treatment. Olive stones as precursor
are also investigated in (El-Sheikh et al., 2004). They point out the microporous structure of
their carbons which were activated in both steam and CO
2
atmosphere. Pretreatment of olive
stones with hydrogen peroxide has a negative effect on porosity and surface area. The
influence of gas atmosphere on the formation of mesopores in olive stone chars is investigated
in (Gonzalez, 1994; Molina-Sabio, 1996). CO
2
activation leads to larger micropore volume than
steam activation. Here, pore widening is the predominant effect. Compared to CO
2
activation
chemical activation of olive stones with of ZnCl leads to higher surface areas with a high
amount of micropores (Lopez-Gonzalez, 1980). Highly microporous carbons with high surface
areas are produced by chemical activation of hazelnut, walnut and almond shells and of
apricot stones (Aygün, et al., 2003). Pistachio shells and fir wood were investigated in (Wu et
al., 2005) by both physical and chemical activation. Chemical activation and the influence of
KOH and NaOH on the formation of micropores of loquat stones is reported in (Sütcü &
Demiral, 2009). High surface areas are attained with KOH and an increase of chemical agent
leads to an increase of surface area. The influence of pyrolysis conditions on pore generation is
investigated by pyrolysis of oil palm shells under both, nitrogen and vacuum (Qipeng & Aik,
2008). It is shown that vacuum pyrolysis avoids pore blocking which results in higher surface
areas. The effect of binders and pressing conditions on the production of granulated activated
carbons are worked out in (Ahmedna et al., 2000; Pendyal et al., 1999). Straw matters and
binders from agricultural byproducts like molasses from sugarcane and sugar beet, corn syrup
and coal tar were mixed and pressed prior to pyrolysis and CO
2
activation. Molasses as binder
leads to lower hardness and higher ash content of the activated carbons than corn syrup or
coal tar.
Also chemical activation leads to highly microporous activated carbons with high surface
areas this work considers steam activation which is regarded be a low cost method for
technical use.
2. Experimental method of biomass pyrolysis and char activation
The experiments on pyrolysis and activation of waste biomass matters were run in lab-scale
facilities. The advantage of these small-scale equipments is that the experiments could be
run very quickly without long heat-up times and with one operating person. Only small
amounts of biomass were needed and the operation conditions could be changed quite
easily. Not many efforts had to be made in gas cleaning procedure due to the low exhaust
gas flow. The screening test to figure out the optimal char residence time in the activation
facility was a one or two day work with an output of 6 – 10 data points. The description of
the lab-scale experiments is given in detail for both, pyrolysis and activation activities.
2.1 Biomass properties
For the generation of activated carbon from waste biomass more than 12 different waste
biomass matters were investigated. The properties of some of the investigated types of
biomass are given in Table 1.
Activated Carbon from Waste Biomass
335
C H O N S Cl Ash
*
H
2
O
Rice straw untreated
39.6 4.6 36.4 0.7 0.1 0.2 18.3 8
Rice straw pretreated
42.4 5.9 n.m 0.76 n.m n.m 3.6 None
Olive stones
48 5.6 n.m <1 n.m n.m 5 4
Wheat straw
44.1 6 44.9 0.5 0.2 0.7 7.9 9.8
Wheat straw pellets
43.1 5.9 45.5 1 n.m n.m ~8 6.5
Walnut shells
50.7 6 n.m n.m n.m n.m 0.9 10.7
Pistachio shells
43.7 5.9 n.m n.m n.m n.m 0.8 Dry
Table 1. Elemental analysis of different types of biomass based on dry matters (wt%).
*Appendix C.7 Alkali Deposit Investigation Samples Alkali Deposits Found in Biomass
Power Plants: A Preliminary Investigation of Their Extent and Nature National Renewable
Energy Laboratory Subcontract TZ-2-11226-1; n.m.: not measured
2.2 Lab-scale pyrolysis
The pyrolysis experiments were run in a “pocket“-reactor which was originally designed for
fast pyrolysis experiments and which was reconverted to slow pyrolysis. Heating of
biomass at low heating rates of 5-10 K/min was considered to be better than fast heating
rates with respect to activated carbon production. A scheme of the reactor is shown in Fig. 1.
Fig. 1. Scheme of the pyrolysis reactor. Four pockets are connected in parallel and wrapped
round with an electric heater. The width of the pockets was 5 mm.
The pockets altogether were filled with about 100 g of biomass. The feed was heated by a
flow of hot nitrogen and additionally by electric heaters which were fixed to the walls of
each pocket. The pyrolysis temperature was varied but it had only a marginal influence on
the quality of the activated carbon because the biomass was not completely devolatilized
after pyrolysis. The reason is that activation took place at higher temperature than pyrolysis
therefore the entire devolatilization had been realized in the activation step. The
disadvantage of incomplete pyrolysis is that some oils which are produced in the activation
step require an additional cooling and filter system. The primary pyrolysis gases were
cooled in a gas cooler to 5 °C and the oils were collected in order to use them as binder
material for the production of granulated activated carbon. After the run of the experiments
the char was taken out of the pockets and the mass balance was established.
The total amounts of the pyrolysis products char, tar and gas of the investigated biomass
matters are given in Table 2:
Progress in Biomass and Bioenergy Production
336
Biomass Char [wt% dm] Tar [wt% dm] Gas [wt% dm]
Rice straw
27 40 33
Rice straw washed
*
19 30-40 50-40
Wheat straw
28 22 50
Wheat straw pellets
32 33 35
Olive stones crashed
30 49 21
Pistachio shells
29 36 35
Walnut shells
31 29 40
Coconut shells
33 40 27
Coffee grounds
23 53 24
Spent grain
29 20 51
Beech wood (525 °C)
+
24 46 30
Coconut press residue
27 51 22
Rape seed
17 63 20
Table 2. Yields of pyrolysis products based on dry biomass matter. The pyrolysis
temperature was 600 °C, the heating rate amounted to 10 K/min.
*
Based on washed and
dried straw.
+
Pyrolysis temperature was 525°C.
The influence of heating rate on the pyrolysis product yields is shown in Table 3. The
pyrolysis temperature was set to 600 °C for some biomass matters whereas the heating rate
amounted to 30 K/min.
Biomass Char [wt% dm] Tar [wt% dm] Gas [wt% dm]
Rice straw washed
24 36 40
Wheat straw pellets
31 25 44
Pistachio shells
24 54 22
Table 3. Yields of pyrolysis products. The pyrolysis was run at 600 °C, the heating rate
amounted to 30 K/min.
As shown from Tables 2 and 3 the tar yield increases if the heating rate is enhanced
whereas the char yield slightly decreases. From the aspect of using the tars/oils for energy
production in a combined heat and power plant the higher heating rate is more
reasonable. The influence of pyrolysis heating rate on the surface area of activated carbon
is marginal in this range. A negative effect on the activated carbon quality can be detected
at heating rates of more than 250 K/min. For optimization reasons, the amount and
quality of the liquid pyrolysis products may be a decision criterion for higher heating
rates.
2.3 Lab-scale activation
The activation experiments were run in a reaction tube which was installed in an oven. The
scheme of the activation lab-scale facility is shown in Fig. 2.
Activated Carbon from Waste Biomass
337
Fig. 2. Scheme of the activation reactor. The reaction tube can be passed through by steam
flow. The case where the char is inserted has a porous bottom and can be removed from the
tube.
The activation reactor consists of a tube furnace which can be heated to 1100°C. Inside of the
furnace a tube with a small case at the bottom is inserted. The case contains the char and has
a porous bottom to ensure, that the incoming gas (nitrogen or steam) flows through the char
bed. The tube can be taken out of the oven. In the beginning of the experiment 5–10 g of char
were inserted into the case with the porous bottom. Afterwards the case was fixed to the
tube. The tube was then inserted into the hot furnace and the char was kept under nitrogen
atmosphere. When the desired char temperature was reached the nitrogen flow was
substituted by steam flow. After some minutes of reacting time, the steam flow was
switched off, the tube was taken out of the reactor and cooled to ambient temperature under
nitrogen atmosphere. The char mass was recorded and a sample of char was taken out of the
case for surface analysis. The remaining char was again inserted into the oven for the next
time interval. In this way the surface area of the char could be recorded as function of the
conversion rate, i.e. actual char mass/initial char mass.
In the hot steam atmosphere the char got partially oxidized which lead to the loss of char
mass and the production of gaseous products like H
2
, CO and CO
2
. Higher amounts of
gaseous long-chain hydrocarbons were produced during the heat-up interval of the char as
a result of incomplete pyrolysis at 600 °C. These gases may be of interest in terms of
energetic utilization in order to rise the economy of the activated carbon production chain.
One way of enhancing the calorific value of the exhaust gases may be a catalytic reforming
process as reported in (Hornung et al., 2009a; Hornung et al., 2009b).
As a result of partial oxidation under steam atmosphere, the surface area of the char
increases which is shown in Fig. 3-14. The surface area created by the chemical reactions in
the steam atmosphere reaches a maximum. Higher char conversion leads to diminishing
surface areas due to the lack of carbon. In the final stage, only ash remains.
Some of the char yields which remained at maximum surface area are given in Table 4 for
rice straw and olive stones.
Progress in Biomass and Bioenergy Production
338
Time [min]
Rice straw [wt%]
Act. Temp.: 800 °C
Olive stones [wt%]
Act. Temp.: 750 °C
30
55 70
45
50 60
60
45 50
90
40 30
Table 4. Char yield as function of activation time for different biomass matters based on the
dry initial char mass.
2.4 Surface measurement – BET method
The surface area of pyrolysis char and activated carbon is measured by standard BET–
method (Bunauer, Emmett, Teller) with the automatically operating measurement technique
NOVA 4000e from Quantachrome Partikelmesstechnik GmbH. The char is exposed in
nitrogen atmosphere at the boiling temperature of liquid nitrogen. The amount of nitrogen
molecules which are adsorbed in a monolayer on the particles´ surface specify the surface
area. In addition pore size analysis and pore volume measurements are made with this
technology (Klank, 2006).
2.5 Activation results
The following diagrams show the BET surface area as function of conversion rate, i.e. loss of
char mass resulting from steam activation. The values are based on dry initial char mass.
The initial char was produced in the lab-scale pyrolysis reactor by the use of various
biomass matters. As shown from the diagrams the surface area increases with increasing
conversion rate. At conversion rates of more than 80 wt% the surface area diminishes due to
the lack of carbon.
Fig. 3 and 4 show the influence of conversion rate on the formation of surface area and the
influence of activation temperature on activation time. The higher the activation
temperature the lower the resulting activation time for the accessibility of a high surface
areas. This example is given for crashed olive stones, but can be observed at all the other
investigated biomass matters. Fig. 5-14 give a summary of the biomass type investigation for
the applicability of activated carbon production.
From Fig. 3 to 14 it is shown that any kind of nut shell is appropriate for activated carbon
production. Straw materials end up with surface areas around 800 m
2
/g which is the
minimum value that commercially available activated carbons provide.
Activated carbon from rice straw with sufficient quality can only be attained if the straw
matter is washed in alkaline solution like NaOH prior to the thermal treatment in order to
extract the inorganic compounds (Finch, 1969). Intermediate surface areas can be attained
with olive stones, spent grain, coffee grounds and sunflower shells. Due to the low
feedstock price activated carbon which is made from these materials seems to have the most
economic perspective.
The residence time of the biomass in the pyrolysis reactor averaged 1 hour at a heating rate
of 10 K/min. A rotary kiln reactor which is described in (Hornung et al., 2005; Hornung &
Seifert, 2006) was tested for pyrolysis of wheat straw pellets and rape seeds. Here the
pyrolysis was run at heating rates of 30 K/min.
Activated Carbon from Waste Biomass
339
Fig. 3. Active surface of crashed olive stones compared with prevalent raw materials.
Fig. 4. Influence of activation temperature on activation time in the case of crashed olive
stones.
Fig. 5. Wheat straw
Progress in Biomass and Bioenergy Production
340
Fig. 6. Washed rice straw
Fig. 7. Pistachio shells
Fig. 8. Walnut shells. The steam flow was 0,5 l/min.
Activated Carbon from Waste Biomass
341
Fig. 9. Coconut shells
Fig. 10. Sunflower shells
Fig. 11. Coffee waste
Progress in Biomass and Bioenergy Production
342
Fig. 12. Spent grain
Fig. 13. Rape seed
Fig. 14. Oak fruit
Activated Carbon from Waste Biomass
343
Within this heating range the influence of heating rate on the activated carbon quality is
negligible. Lower residence times i.e. 10 – 20 min should be chosen for economic reasons.
For this the use of the rotary kiln reactor (Hornung et al., 2005, 2006) is suitable.
The residence time of char in the activation step is given as function of conversion rate in
following diagrams, Fig. 15 and 16.
Fig. 15. Activation time as function of conversion rate.
Fig. 16. Activation time as function of conversion rate.
In Fig. 15 the values of walnut shells and pistachio shells belong to 800°C activation
temperature except the lower pistachio values which correspond to the activation
temperature of 900°C. The activation time was varying from experiment to experiment.
The reason for this might have been local effects due to inhomogeneous flow through of
the small fixed bed. But nevertheless, experiments with wheat straw pellets exhibits that
the char residence time needs to be in the range of 60 - 75 min. These results in
combination with the lab-scale pyrolysis experiments are helpful to determine the
production parameters of activated carbon from a special type of biomass in a continuous
production process.