progress in biomass and bioenergy production
Bạn đang xem bản rút gọn của tài liệu. Xem và tải ngay bản đầy đủ của tài liệu tại đây (24.24 MB, 456 trang )
PROGRESS
IN BIOMASS AND
BIOENERGY PRODUCTION
Edited by S. Shahid Shaukat
Progress in Biomass and Bioenergy Production
Edited by S. Shahid Shaukat
Published by InTech
Janeza Trdine 9, 51000 Rijeka, Croatia
Copyright © 2011 InTech
All chapters are Open Access articles distributed under the Creative Commons
Non Commercial Share Alike Attribution 3.0 license, which permits to copy,
distribute, transmit, and adapt the work in any medium, so long as the original
work is properly cited. After this work has been published by InTech, authors
have the right to republish it, in whole or part, in any publication of which they
are the author, and to make other personal use of the work. Any republication,
referencing or personal use of the work must explicitly identify the original source.
Statements and opinions expressed in the chapters are these of the individual contributors
and not necessarily those of the editors or publisher. No responsibility is accepted
for the accuracy of information contained in the published articles. The publisher
assumes no responsibility for any damage or injury to persons or property arising out
of the use of any materials, instructions, methods or ideas contained in the book.
Publishing Process Manager Niksa Mandic
Technical Editor Teodora Smiljanic
Cover Designer Jan Hyrat
Image Copyright Mikael Goransson, 2010. Used under license from Shutterstock.com
First published July, 2011
Printed in Croatia
A free online edition of this book is available at www.intechopen.com
Additional hard copies can be obtained from
Progress in Biomass and Bioenergy Production, Edited by S. Shahid Shaukat
p. cm.
ISBN 978-953-307-491-7
free online editions of InTech
Books and Journals can be found at
www.intechopen.com
Contents
Preface IX
Part 1 Gasification and Pyrolysis 1
Chapter 1 Scale-Up of a Cold Flow Model of
FICFB Biomass Gasification Process to an
Industrial Pilot Plant – Example of Dynamic Similarity 3
Jernej Mele
Chapter 2 Second Law Analysis of Bubbling
Fluidized Bed Gasifier for Biomass Gasification 21
B. Fakhim and B. Farhanieh
Chapter 3 Thermal Plasma Gasification of Biomass 39
Milan Hrabovsky
Chapter 4 Numerical Investigation of Hybrid-Stabilized
Argon-Water Electric Arc Used for Biomass Gasification 63
J. Jeništa, H. Takana, H. Nishiyama, M. Bartlová, V. Aubrecht,
P. Křenek, M. Hrabovský, T. Kavka, V. Sember and A. Mašláni
Part 2 Biomass Production 89
Chapter 5 A Simple Analytical Model for Remote
Assessment of the Dynamics of Biomass Accumulation 91
Janis Abolins and Janis Gravitis
Chapter 6 Assessment of Forest Aboveground
Biomass Stocks and Dynamics with Inventory
Data, Remotely Sensed Imagery and Geostatistics 107
Helder Viana, Domingos Lopes and José Aranha
Part 3 Metal Biosorption and Reduction 131
Chapter 7 Hexavalent Chromium
Removal by a Paecilomyces sp Fungal 133
Juan F. Cárdenas-González and Ismael Acosta-Rodríguez
VI Contents
Chapter 8 Biosorption of Metals: State of the Art,
General Features, and Potential Applications
for Environmental and Technological Processes 151
Robson C. Oliveira, Mauricio C. Palmieri and Oswaldo Garcia Jr.
Part 4 Waste Water Treatment 177
Chapter 9 Investigation of Different Control
Strategies for the Waste Water Treatment Plant 179
Hicham EL Bahja, Othman Bakka and Pastora Vega Cruz
Part 5 Characterization of
Biomass, Pretreatment and Recovery 195
Chapter 10 Preparation and
Characterization of Bio-Oil from Biomass 197
Yufu Xu, Xianguo Hu, Wendong Li and Yinyan Shi
Chapter 11 Combined Microwave - Acid
Pretreatment of the Biomass 223
Adina-Elena Segneanu, Corina Amalia Macarie,
Raluca Oana Pop and Ionel Balcu
Chapter 12 Relationship between Microbial C,
Microbial N and Microbial DNA Extracts
During Municipal Solid Waste Composting Process 239
Bouzaiane Olfa, Saidi Neila, Ben Ayed Leila,
Jedidi Naceur and Hassen Abdennaceur
Chapter 13 Characterization of Activated
Carbons Produced from Oleaster Stones 253
Hale Sütcü
Chapter 14 Effect of the Presence of Subtituted
Urea and also Ammonia as Nitrogen Source
in Cultivied Medium on Chlorella’s Lipid Content 273
Anondho Wijanarko
Chapter 15 Recovery of Ammonia and
Ketones from Biomass Wastes 283
Eri Fumoto, Teruoki Tago and Takao Masuda
Chapter 16 Characterization of Biomass as
Non Conventional Fuels by Thermal Techniques 299
Osvalda Senneca
Chapter 17 Estimating Nonharvested Crop
Residue Cover Dynamics Using Remote Sensing 325
V.P. Obade, D.E. Clay, C.G. Carlson,
K. Dalsted, B. Wylie, C. Ren and S.A. Clay
Contents VII
Chapter 18 Activated Carbon from Waste Biomass 333
Elisabeth Schröder, Klaus Thomauske, Benjamin Oechsler,
Sabrina Herberger, Sabine Baur and Andreas Hornung
Part 6 Fuel Production 357
Chapter 19 Ethanol and Hydrogen
Production with Thermophilic
Bacteria from Sugars and Complex Biomass 359
Maney Sveinsdottir,
Margret Audur Sigurbjornsdottir and Johann Orlygsson
Chapter 20 Analysis of Process Configurations for
Bioethanol Production from Microalgal Biomass 395
Razif Harun, Boyin Liu and Michael K. Danquah
Chapter 21 Microbial Conversion of
Biomass: A Review of Microbial Fuel Cells 409
Cagil Ozansoy and Ruby Heard
Part 7 Bio-Economic 427
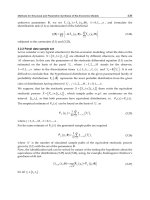
Chapter 22 Methods for Structural and
Parametric Synthesis of Bio-Economic Models 429
Darya V. Filatova
Preface
The fossil fuels that are principally used to provide energy today are in limited
quantity, they are diminishing at an alarming rate, and their worldwide supplies will
eventually be exhausted. Fossil fuels provide approximately 60 percent of the world’s
global electric power. Carbon dioxide levels in the atmosphere will continue to rise
unless other cleaner sources of energy are explored. Biomass has the potential to
become one of the major global primary energy source in the years to come. Biomass is
the source of bioenergy which is produced by burning biomass or biomass fuels and
provides cleanest energy matrix. Biomass, currently the most important source of
energy, is organic matter which can be in the form of leaves, wood pieces, grasses,
twigs, seeds and all other forms that plants and animals can assume whether living or
recently dead. Often biomass has to be converted to usable fuel. This book addresses
the challenges encountered in providing biomass and bioenergy. The book explores
some of the fundamental aspects of biomass in the context of energy, which include:
biomass types, biomass production system, biomass characteristics, recalcitrance, and
biomass conversion technologies. The natural resistance of plant cell walls to microbial
and enzymatic breakdown together is known as biomass recalcitrance. This
characteristic of plant contributes to increased cost of lignocellulose conversion. Some
of the articles included here address this issue. Besides exploring the topics of biomass
and bioenergy, the book also deals with such diverse topics as biosorption, waste
water treatment, fuel production including ethanol and hydrogen, and bio-economics.
The book is divided into seven sections which contain different number of chapters.
Section I includes papers on Gasification and pyrolysis. The first Chapter by Jernej
Mele presents a cold-flow model of FICFB biomass gasification process and its scale-
up to industrial pilot plant. In Chapter 2, B. Fakhim and B. Farhanieh focus on Second
Law analysis of bubbling fluidized bed gasification. Chapter 3 written by Milan
Hrabovsky elucidates some new results on the production of syngas through thermal
plasma technique, using gasification as well as pyrolysis. Chapter 4 authored by Jiri
Jenista provides a numerical investigation of hybrid-stabilzed argon-water electric arc
used for biomass gasification.
The Section II of the book covers biomass production and includes two chapters. In
Chapter 5 Janis Abolins and Janis Gravitis present a simple analytical model for
remote assessment of the dynamics of biomass accumulation. H. Viana, D. Lopes
X Preface
and J. Aranha, in Chapter 6 suggest a methodology for assessment of forest above
ground biomass and dynamics using remote sensing and geostatistical modelling.
Section III which contains three chapters deals with Metal Biosorption and Reduction.
Chapter 7 by J. F. Cardenas-Gonzalez and I. Acosta-Rodriguez describe a technique of
removal of hexavalent chromium using a strain of the fungus Paecilomyces sp. Chapter
8 presents a comprehensive review of biosorption of metals by R.C. Oliveira and C.
Palmieri which includes general features of the biosorption phenomenon as well as
potential applications for environmental and technological processes. Chapter 9
authored by Zhu Guocai examines reduction of manganese ores using biomass as
reductant. Section IV that deals with Wastewater treatment contains two chapters.
Chapter 10 by Nima Badkoubi and H. Jazayeri-Rad attempts to investigate the
parameters of wastewater treatment plant using extended Kalman filters (EKF) and
some constrained methods. In Chapter 11 Dr. P. Vega discussed different control
strategies for wastewater treatment. Section V, a large section, devoted to
Characterization of biomass, pre-treatment, recovery and recalcitrance, comprises of
seven chapters. Chapter 12 written by Yufu Xu, Xianguo Hu, Wendong Li and Yinyan
Shi provides an elaborated review on Preparation and Characterization of Bio-oil from
biomass. The investigation on bio-oils led to the conclusion that the bio-oils present
bright prospects as an alternative renewable energy source instead of the popular
fossil fuels. In Chapter 13 S. Adena-Elena focuses on Combined microwave-acid
pretreatment of the biomass. Chapter 14 by Olfa Bouzaiane investigates the
relationships of C, N and DNA content of municipal solid waste during the
composting process. In Chapter 15 Hale Sütcü characterizes activated carbon
produced from Oleaster stones. In Chapter 16 by A. Wijanarko, the effect of
substituted urea and ammonia in the growth medium on the lipid content of Chlorella
is investigated.
Chapter 17 by E. Fumoto, T. Tago and T. Masuda focuses on the recovery of ammonia
and ketones from biomass waste. Recovery of ammonia is achieved through adsorption
while that of ketones through catalytic cracking process. Chapter 18 written by O.
Senneca characterizes biomass as nonconventional fuels by thermal techniques and
presents a comprehensive protocol for the same. Section VI contains articles on Fuel
production: ethanol and hydrogen. In Chapter 19 V.P. Obade, D.E. Clay, C.G. Carlson, K.
Dalsted, B. Wylie, C. Ren and S.A. Clay provide the Principles and Applications of using
remote sensing of nonharvested crop residue cover. In Chapter 20 Elisabeth Schröder
discusses activated carbon production from waste biomass. In Chapter 21 M.
Sveinsdottir, M.A. Sigurbjornsdottir and J. Orlygsson deal with the production of
ethanol and hydrogen using thermophilic bateria from sugars and complex biomass.
Harun Razif and M.K. Danquah in Chapter 22 focus on the analysis of process
configuration for bioethanol production from microalgal biomass. Chapter 23 by R.
Heard and C.R. Ozansoy reviews the Microbial conversion of biomass concentrating on
microbial fuel cells.
Preface XI
Section VII contains one Chapter on Bio-economics. Chapter 24 written by D.V.
Filatova and M. Grzywaczewski presents structural and parametric synthesis of bio-
economic models using stochastic differential equations. Estimation procedures
involved Monte Carlo simulation. The strength of the book rests more or less on all
the contributions, my sincere thanks are due to all the authors for providing their in
depth individual studies or comprehensive overviews of their research areas and the
state-of-art in their fields and meeting the various deadlines.
I would like to express my gratitude to the faculty members of the Institute of
Environmental Studies, University of Karachi and to postgraduate students and Prof.
Dr. Moinuddin Ahmed (Foreign Faculty) of Ecological Research Laboratory, Federal
Urdu University, Karachi, for some useful discussions and moral support. Finally, I
would like to thank Ms Ana Pantar, Publishing Process Manager and Mr. Niksa
Mandić, Publishing Process Manager, InTech Open Access Publisher, Croatia for
bearing with me with delays and being generously helpful throughout the process of
putting this book together.
May 2011
Dr. S. Shahid Shaukat
Institute of Environmental Studies
University of Karachi, Karachi
Pakistan
Part 1
Gasification and Pyrolysis
1
Scale-Up of a Cold Flow Model of FICFB
Biomass Gasification Process to an Industrial
Pilot Plant – Example of Dynamic Similarity
Jernej Mele
Faculty of mechanical engineering/Bosio d.o.o.
Slovenia
1. Introduction
In this chapter we are introducing the research of particles hydrodynamics in a cold flow
model of Fast Internal Circulating Fluidized Bed (FICFB) biomass gasification process and
its scale-up to industrial pilot plant. A laboratory unit has been made for the purposes of
experimental research. The laboratory unit is three times smaller than the later pilot plant.
For a reliable observation of the flow process, similar flow conditions must be created in the
laboratory unit and the pilot plant. The results of the laboratory model will be similar to
those of the actual device if geometry, flow and Reynolds numbers are the same. Therefore,
there is no need to bring a full-scale gasificator into the laboratory and actually test it. This is
an example of "dynamic similarity".
FICFB biomass gasification is a process for producing high caloric synthesis gas (syngas)
from solid Hydrocarbons. The basic idea is to separate syngas from flue gas, and due to the
separation we have a gasification zone for endothermic reactions and a riser for exothermic
reactions. The bed material circulates between these two zones and serves as a heat carrier
and a catalyst.
While researching the 250kW fluidized bed gasification pilot plant certain questions
concerning particle dynamics in gas flows control arose. There is a zone where fluidized bed
conditions are made with superheated steam, pneumatic transport with hot air and a pair of
secondary gas inlets of CO
2
. These particle flows are difficult to describe with mathematical
models. This is the main reason why the three-times smaller cold-flow laboratory unit has
been made. The hydrodynamics of particles will be studied in the air flow at arbitrary
conditions. Flow conditions in the laboratory unit and pilot plant must be similar for a
reliable evaluation of the process in the pilot plant.
2. Laboratory unit
The laboratory unit is a device three times smaller than the pilot plant. Its main purpose is to
simulate the hydrodynamic process of FICFB gasification in a cold flow. It is made from
stainless steel and in the case of the parts that are of greatest interest to the present study is
made of glass, so that the particle behaviour may be observed. Fig. 1 shows a model of
laboratory unit. Its main elements are:
Progress in Biomass and Bioenergy Production
4
- Reactor (A),
- Riser (B),
- Cyclone (C),
- Siphon (D),
- Chute (E),
- Gas distributor (J
1
and J
2
),
- Auxiliary inlets (I
1
and I
2
).
Fig. 1. 3D model of laboratory unit
Firstly, let us look at the process. There are two gas distributors at the bottom of the reactor
and riser, through which air is blown vertically. The pneumatic transport of the particles
takes place in the riser, where they are separated from the air flow in cyclone and finally
gathered in siphon. The second auxiliary inlet acts to fluidize the gathered particles and
transport them to the reactor. Here, the fluidized bed is created with the upward blowing
air. From here, the particles are transported to the riser through the chute and the speed of
transportation is regulated by means of the first auxiliary inlet.
Scale-Up of a Cold Flow Model of FICFB Biomass Gasification
Process to an Industrial Pilot Plant – Example of Dynamic Similarity
5
Laboratory unit Pilot plant
D
g
as,1
[mm] 100 300
D
g
as,2
[mm] 190 600
D
comb
[mm] 50 150
H
comb
[mm] 1500 4500
Table 1. Main dimensions of laboratory unit and pilot plant
We are primarily interested in how to establish a stationary and self-sustainable process. In
the laboratory unit there are glass parts through which the process in course can be directly
observed. However, in the hot flow model we will not be able to see what happens inside
the pilot plant, and therefore our control system must be able to initiate the process, keep it
in a stationary state and halt it on the basis of measured data such as relative pressure and
flow velocities. For this mater, our laboratory unit consists of 7 pressure and 2 flow velocity
measuring points. Fig. 2 details the positions of the pressure places.
Fig. 2. Openings for the measuring of relative pressure
Progress in Biomass and Bioenergy Production
6
Trough experiments on the laboratory unit the effectiveness of elements will be studied so
as to enable the correction and improvement of any construction flaws they contain. Fig. 3
shows the laboratory unit that will be used for studying the flow process. There are 7 places
for pressure, 2 for temperature and 2 for gas flow measurements. For the proper operation
of our solid flow system it is vital that the particles are maintained in dynamic suspension as
settling down the particles can clog both the measuring openings and injection nozzles.
Thus it is essential to design such systems with special care. All measurements involving the
risk of clogging the measuring opening must be taken outside the solid flow zone if possible
– gas flow velocity measurements with the Pitot tube must be taken in the gas pipeline
before gas enters thru distributor. It is highly desirable for all measuring openings to be
small and positioned rectangular to the direction of flow (Nicastro & Glicksman, 1982).
Fig. 3. Laboratory unit
2.1 Distributor
For the distributor 3 metal nets with openings of 225 μm have been used, with ceramic wool
of 8mm placed in between as shown in fig. 4. We tried to achieve a sufficient pressure drop
as to attain equal flow through the openings. According to Agarwal recommendation (Kunii
& Levenspiel, 1991; Nicastro & Glicksman, 1982), the pressure drop across distributors must
Scale-Up of a Cold Flow Model of FICFB Biomass Gasification
Process to an Industrial Pilot Plant – Example of Dynamic Similarity
7
be 10 % of the pressure drop across the bed, with a minimum of 35 mm H
2
O. With this we
are in approximate agreement. At higher pressure drops across the distributor we get more
particulate or smooth fluidization with less channelling, slugging and fluctuation in density.
The pressure drop across the distributor is shown in fig. 5.
Fig. 4. Distributor structure
0
10
20
30
40
50
60
036912
v
gas
[m/s]
p
1,2
[mbar]
Fig. 5. Pressure drop across the distributor with blowing of air
2.2 Cyclone
In our case, the cyclone separator is placed behind the riser to separate the particles from the
air flow. It has to be able to separate particles larger than 50 μm. For these conditions these
particles are considered large as cyclones are often used for the removal of particles of about
10 μm diameter or larger from air streams. Our model is shown in fig. 6.
Progress in Biomass and Bioenergy Production
8
Fig. 6. The characteristic dimensions of cyclone
We dimensioned our cyclone according to Perry (Perry, 1988). D
p,50
is the particle size at
which 50 % of solids of a given size are collected by the cyclone.
()
,50
9
gcyc
p
s
gpg
B
D
Nv
η
π
ρρ
⋅⋅
=
⋅⋅⋅ −
(1)
By rearranging the equation (1), we obtain the following expression:
()
2
,50
9
p
s
gpg
cyc
g
DNv
B
π
ρρ
η
⋅⋅ ⋅ ⋅ −
=
⋅
(2)
The width of the cyclone entering the opening and the characteristic diameter are correlated
by the following expression:
4
c
y
c
cyc
D
B =
(3)
The diameter of our cyclone is 150 mm. Smaller particles, which are not separated in cyclone
are being collected in a filter placed on the cyclone gas exit.
Scale-Up of a Cold Flow Model of FICFB Biomass Gasification
Process to an Industrial Pilot Plant – Example of Dynamic Similarity
9
3. Basic equations for describing the fluidized state and similarity of flows
3.1 Reynolds number
The goal herein is to compare flows in the laboratory unit to those in the pilot plant. In order
for the two flows to be similar they must have the same geometry and equal Reynolds
numbers. When comparing fluid behaviour at homologous points in a model and a full-
scale flow, the following holds:
Re(laboratory unit) = Re(Scale-up pilot plant)
The Reynolds number of particles can be determined by the following equation (Kunii &
Levenspiel, 1991):
Re
pg g
p
g
Dv
ρ
η
⋅⋅
= (4)
For achieving the required similarity, the following conditions must be also fulfilled:
,
22
,,
gar
gg g
ar
g
ar
p
p
vv
ρρ
=
⋅⋅
(5)
3.2 Minimal fluidizing velocity
The fluidization state starts when the drag force of by upward moving gas equals the weight
of the particles (Oman, 2005)
2
_
1
2
gp
x
ppg
FCAv
ρ
=⋅ ⋅ ⋅ ⋅
(6)
or
()()()
1
ttmf mfsg
c
g
pA A L
g
ερρ
Δ⋅ = ⋅ − −
(7)
By rearranging equation (7), for minimum fluidizing conditions we find the following
expression (Kunii & Levenspiel, 1991),
()( )
1
mf
mf s g
m
f
c
p
g
Lg
ερρ
Δ
=− −
(8)
Voidage in fluidized bed ε
mf
is larger than in the packed bed and it can be estimated
experimentally from a random ladling sample. For small particles and low Reynolds
numbers the viscous energy losses predominate and the equation simplifies to (Kunii &
Levenspiel, 1991):
()
()
2
2
150
1
sp
pg mf
mf
g
m
f
D
vg
ρρ ε
η
ε
Φ⋅
−
=⋅⋅⋅
−
(9)
for Re
p
< 20
Progress in Biomass and Bioenergy Production
10
For large particles only the kinetic energy losses need to be considered:
3
()
1,75
sp p g
m
f
m
f
g
D
vg
ρρ
ε
η
Φ⋅ −
=⋅ ⋅⋅ (10)
for Re
p
> 1000.
If Φ
S
and ε
mf
are unknown, the following modifications suggested by Wen and Yu (Kunii &
Levenspiel, 1991) are used:
22
1
11
mf
Smf
ε
ε
−
≅
Φ⋅
(11)
3
1
14
Smf
ε
≅
Φ⋅
(12)
Equations (9) and (10) can now be simplified to:
()
2
1650
ppg
mf
g
Dg
v
ρρ
η
⋅−⋅
=
⋅
(13)
for Re
p
< 20
()
24,5
ppg
mf
g
Dg
v
ρρ
ρ
⋅⋅ −
=
⋅
(14)
for Re
p
> 1000.
3.3 Terminal velocity
The upper limit of gas flow rate is approximated by the terminal (free fall) velocity of the
particles, which can be estimated from the fluid mechanics (Kunii & Levenspiel, 1991):
4()
3
ppg
t
gx
gD
v
C
ρρ
ρ
⋅⋅ ⋅ −
=
⋅⋅
(15)
There are spherical and non-spherical particle shapes in the bed and each of them has a
different C
x
value. If we combine equations (4) and (15) we get the velocity independent
group:
()
3
2
2
4
Re
3
pgpg
xp
g
gD
C
ρρρ
η
⋅⋅ ⋅ ⋅ −
=
⋅
(16)
An alternative way of finding v
t
for spherical particles uses analytical expressions for the
drag coefficient C
x
(Kunii & Levenspiel, 1991).
24
Re
x
p
C =
for Re
p
< 0,4 (17)
Scale-Up of a Cold Flow Model of FICFB Biomass Gasification
Process to an Industrial Pilot Plant – Example of Dynamic Similarity
11
10
Re
x
p
C = for 0,4< Re
p
<500 (18)
0,43
x
C = for 500<Re
p
<200000 (19)
But still no simple expression can represent the experimental findings for the entire range of
Reynolds numbers, so by replacing these values C
x
in equation (16) we obtain:
()
2
18
pg p
t
g
g
D
v
ρρ
η
−⋅⋅
=
⋅
(20)
for Re
p
< 0,4
()
2
2
3
4
225
pg
t
p
gg
g
vD
ρρ
ηρ
−⋅
=⋅ ⋅
⋅
(21)
for 0,4 < Re
p
< 500
and
3,1 ( )
ppg
t
g
Dg
v
ρρ
ρ
⋅⋅⋅ −
=
(22)
for 500 < Re
p
< 200000.
3.4 Determining density
In the pilot plant we will have multiple gas mixtures at different temperatures due to
chemical reactions. For our calculations the density for these mixtures will be determined by
the following equation (Oman et al., 2006 ):
1
i
g
i
i
w
ρ
ρ
−
=
(23)
To calculate the density of the gas mixture at an arbitrary temperature and an arbitrary
pressure the density under normal condition must be calculated according to equation (24),
with the obtained value being converted to density at the required parameters:
,
,
,
gar
n
gar g
n
g
ar
p
T
pT
ρρ
=⋅ ⋅
(24)
3.5 Pressure drops
With increased gas velocity of the small solid particles across the bed a characteristic state
occurs. Pressure drop starts to increase, reaching its maximum value Δp
mf
at minimum
fluidization velocity v
mf
. At this point only part of the bed is fluidized. When the bed is fully
fluidized (at v
mff
), the pressure drop is reduced to Δp
mff
and is almost constant until gas
reaches terminal velocity. If the velocity is still increasing, the particles start transporting
Progress in Biomass and Bioenergy Production
12
pneumatically and pressure drop reduces rapidly to 0. By rearranging equation (8), we
obtain the following expression (Kunii & Levenspiel, 1991):
()( )
1
m
f
m
f
s
g
m
f
pg
L
ερρ
Δ=− − ⋅⋅ (25)
The expression can also be extended to the fully fluidized state (Kaewklum & Kuprianov,
2008):
()()
1
m
ff
m
ff
s
g
m
ff
pg
L
ερρ
Δ=− −⋅⋅ (26)
Fig. 7. The change in pressure drop relative to gas velocity for Not-too-Small Uniformly
Sized Particles (Kunii & Levenspiel, 1991)
A somewhat different differential pressure characteristic occurs with a wide size
distribution of particles, which are usually present in industrial processes. When the gas
velocity increases through the bed of solids, the smaller particles start to fluidize and slip
into the void spaces between the larger particles, while the larger particles remain stationary
(Kunii & Levenspiel, 1991) (see Fig. 8). However, after a full fluidization of bed material
(v
g
>v
mff
), with increasing air velocity, pressure drop mainly remains constant.
Fig. 8. The change in pressure drop relative to gas velocity for Wide Size Distribution of
Particles (Kunii & Levenspiel, 1991)
Scale-Up of a Cold Flow Model of FICFB Biomass Gasification
Process to an Industrial Pilot Plant – Example of Dynamic Similarity
13
3.6 Mass flows and conservation of mass
For a regular flow process we have to ensure proper gas flows at the inlets. Through
defining minimal fluidizing and terminal velocities, we can estimate the mass flow of the air
reactor and riser by applying the following relations:
2
_
4
tube
mg g g
D
v
π
ϕρ
⋅
=⋅⋅ (27)
_
_
m
g
Vg
g
ϕ
ϕ
ρ
= (28)
It is extremely important to ensure that there are no mass losses between the ventilator and
the reactor. It can be assumed:
2
2
,2
,
44
gas
tube
g g ref
D
D
vv
π
π
⋅
⋅
⋅=⋅
(29)
4. Calculation analyses
On the basis of the previously-mentioned equations, we can make an estimation of flow
conditions in the reactor and riser. We have made a tabular comparison of physical
properties between the laboratory unit and pilot plant in tables 2 and 3. The comparison is
based on the established equality of Reynolds numbers. As mentioned in chapter 3.1. “In
order for two flows to be similar they must have the same geometry and equal Reynolds
numbers”. In the laboratory unit, flows will be made with upward-blowing air at room
temperature whereas in the pilot plant the fluid bed will be made with inlet of superheated
steam and pneumatic transport with hot air blowing at 550 °C.
Reactor
Laboratory
unit
Pilot plant
Gas Air Steam / Syngas
T [°C] 30 550 / 800
D
p
[μm] 200 600
ρ
p
[kg/m
3
] 8250 3025
ρ
g
[kg/m
3
] 1,204 0,288 / 0,192
η
g
[Pas] 1,8·10-5 3,1·10-5 / 4,6·10-5
v
Re<20
[m/s] 0,11 0,21 / 0,14
v
Re>1000
[m/s] 0,75 1,58 / 1,95
Φ
m
[kg/h] 6,4 158,9
Φ
V
[m
3
/h] 5,4 548,5
Re
p
9,8 9,0 /4,9
Table 2. Physical properties of gas in Reactor
In the meantime endothermic chemical reactions of pyrolisys, a water-gas-shift reaction will
take place in the reactor while exothermic combustion occurs in the riser. Flue gases will