Supply Chain Management Part 2 potx
Bạn đang xem bản rút gọn của tài liệu. Xem và tải ngay bản đầy đủ của tài liệu tại đây (1.76 MB, 40 trang )
Integrating Lean, Agile, Resilience and Green Paradigms
in Supply Chain Management (LARG_SCM)
31
The ability to recover from the disturbance occurrence is related to development of
responsiveness capabilities through flexibility and redundancy (Rice & Caniato, 2003).
Flexibility is related to the investments in infrastructure and resources before they actually
are needed, e.g., multi-skilled workforce, designing production systems that can
accommodate multiple products, or adopting sourcing strategies to allow transparent
switching of suppliers. Redundancy is concerned to maintaining capacity to respond to
disruptions in the supply network, largely through investments in capital and capacity prior
to the point of need, e.g., excess of capacity requirements, committing to contracts for
material supply (buying capacity whether it is used or not), or maintaining a dedicated
transportation fleet. Rice and Cianato (2003) differentiated flexibility from redundancy in
the following way: redundancy capacity may or may not be used; it is this additional
capacity that would be used to replace the capacity loss caused by a disruption; flexibility,
on the other hand, entails restructure previously existing capacity.
Tang (2006) propose the use of robust supply chain strategies to enable a firm to deploy the
associated contingency plans efficiently and effectively when facing a disruption, making
the supply chain firm become more resilient. This author proposes strategies based on: i)
postponement; ii) strategic stock; iii) flexible supply base; iv) make-and-buy trade-off; v)
economic supply incentives; vi) flexible transportation; vii) revenue management; viii)
dynamic assortment planning; ix) silent product rollover. Christopher and Peck (2004)
proposes the following principles to design resilient supply chains: i) selecting supply chain
strategies that keep several options open; ii) re-examining the ‘efficiency vs. redundancy’
trade off; iii) developing collaborative working; iv) developing visibility; v) improving
supply chain velocity and acceleration. Iakovou et al. (2007) refer the following resilience
interventions: i) flexible sourcing; ii) demand-based management; iii) strategic emergency
stock (dual inventory management policy that differentiates regular business uncertainties
from the disturbances, using on the one hand safety stocks to absorb normal business
fluctuations, and on the other hand, keeping a strategic emergency stock); iv) total supply
chain visibility; and v) process and knowledge back-up.
2.4 Green
Environmentally sustainable green supply chain management has emerged as
organizational philosophy to achieve corporate profit and market share objectives by
reducing environmental risks and impacts while improving ecological efficiency of these
organizations and their partners (Zhu et al., 2008; Rao, 2005 ). Changes in government
policies, such as the Waste Electrical and Electronic Equipment directive in European Union
(Barroso & Machado, 2005; Gottberg, 2006), had make the industry responsible for post-
consumer disposal of products, forcing the implementation of sustainable operations across
the supply chain. At the same time, the increased pressure from community and
environmentally-conscious consumers forces the manufacturers to effectively integrate
environmental concerns into their management practices (Zhu et al., 2008).
It is necessary to integrate the organizational environmental management practices into the
entire supply chain to achieve a sustainable supply chain and maintain competitive
advantage (Zhu et al., 2008; Linton et al., 2007). The green supply chain management
practices should cover all the supply chain activities, from green purchasing to integrate life-
cycle management, through to manufacturer, customer, and closing the loop with reverse
logistics (Zhu et al., 2008).
Supply Chain Management
32
According to Bowen et al. (2001) green supply practices include: i) greening the supply
process - representing adaptations to supplier management activities, including
collaboration with suppliers to eliminate packaging and implementing recycling initiatives;
ii) product-based green supply - managing the by-products of supplied inputs such as
packing; iii) advanced green supply - proactive approaches such as the use of environmental
criteria in risk-sharing, evaluation of buyer performance and joint clean technology
programs with suppliers.
The greening of supply chain is also influenced by the following production processes
characteristics (Sarkis, 2003): i) process’ capability to use certain materials; ii) possibility to
integrate reusable or remanufactured components into the system (which would require
disassembly capacities); and iii) design for waste minimization (energy, water, raw
materials, and non-product output).
Eco-design is defined as the development of products more durable and energy efficient,
avoiding the use of toxic materials and easily disassembled for recycling (Gottberg et al.,
2006). It provides opportunities to minimize waste and improve the resource consumption
efficiency through modifications in product size, serviceable life, recyclability and utilization
characteristics.However, the eco-design strategy presents some potential disadvantages
including: high level of obsolete products in fashion driven markets, increased complexity
and increased risk of failure, among others (Gottberg et al., 2006).
The reverse logistics focuses primarily on the return of recyclable or reusable products and
materials into the forward supply chain (Sarkis, 2003). To reintroduced recycled materials,
components and products into the downstream production and distribution systems, it is
necessary to integrate reverse material and information flows in the supply chain. Due to
the reverse material flow, traditional production planning and inventory management
methods have limited applicability in remanufacturing systems (Srivastava, 2007).
Therefore, it is necessary to consider the existence of the returned items that are not yet
remanufactured, remanufactured items and manufactured items.
Distribution and transportation operations networks are also important operational
characteristics that will affect the green supply chain (Sarkis, 2003). With the rapid increase
of long-distance trade, supply chains are increasingly covering larger distances, consuming
significantly more fossil-fuel energy for transportation and emitting much more carbon
dioxide than a few decades ago (Venkat & Wakeland, 2006) . Lean supply chains typically
have lower emissions due to reduced inventory being held internally at each company, but
the frequent replenishment generally tends to increase emissions. As distances increase, it is
quite possible for lean and green to be in conflict, which may require additional
modifications to the supply chain (perhaps moving it away from the ideal lean
configuration) if emissions are to be minimized (Venkat & Wakeland, 2006). Therefore, lean
may be green in some cases, but not in others.
According to Srivastava (2007) green supply chain management can reduce the ecological
impact of industrial activity without sacrificing quality, cost, reliability, performance or
energy utilization efficiency; meeting environmental regulations to not only minimizing
ecological damage, but also leading to overall economic profit.
2.5 Paradigms characterization
Although some authors (Vonderembse et al., 2006; Naylor et al., 1999; Christopher & Towill,
2000; Agarwal et al., 2006) provide an overview and comparison between lean and agile
Integrating Lean, Agile, Resilience and Green Paradigms
in Supply Chain Management (LARG_SCM)
33
supply paradigms they don’t consider the resilient and green paradigms. To fulfil this
situation, the characterization of resilient and green supply chains was added to the
framework proposed by Vonderembse et al. (2006). Table 1 presents the characterization of
lean, agile, resilient and green supply chains in what is concerned to purpose,
manufacturing focus, alliance type, organizational structure, supplier involvement,
inventory strategy, lead time, and product design.
From Table 1, it is possible to identify differences between lean, agile, resilient and green
paradigms; for example, lean, agile and green practices promote inventory minimization,
but resilience demands the existence of strategic inventory buffers. Although, there are some
“overlapping” characteristics that suggest that these paradigms should be developed
simultaneously for supply chain performance improvement. According to Naylor et al.
(1999) leanness and agility should not be considered in isolation; instead they should be
integrated. The lean paradigm deployment in supply chain management produce significant
improvements in resource productivity, reducing the amount of energy, water, raw
materials, and non-product output associated with production processes; minimizing the
ecological impact of industrial activity (Larson & Greenwood, 2004). According to
Christopher and Peck (2004) resilience implies flexibility and agility; therefore, for the
development of a resilient supply chain, it is necessary to develop agility attributes.
Lean Agile Resilient Green
Purpose
Focus on cost
reduction and
flexibility, for
already available
products, through
continuous elimina-
tion of waste or
non-value added
activities across the
chain
(a)
Understands
customer
requirements by
interfacing with
customers and
market and being
adaptable to
future changes
(a)
Ability to return
to its ori
g
inal state
or to a new one,
more desirable,
after experiencing
a disturbance,
avoiding the
occurrence of
failures modes
Focus on
sustainable
development and
on reduction of
ecological impact of
industrial activity
Manufacturi
ng focus
Maintain high
average utilization
rate
(a)
. It uses
j
ust in
time practices,
“pulling” the goods
through the system
based on demand
(b)
Has the ability to
respond quickly
to varying
customer needs
(mass
customization), it
deploys excess
buffer capacity to
respond to
market
requirements
(a)
The emphasis is
on flexibility
(minimal batch
sizes and capacity
redundancies)
improving supply
chain
responsiveness.
The schedule
planning is based
on shared
information
(d)
Focus on efficiency
and waste
reduction for
environmental
benefit and
developing of re-
manufacturing
capabilities to
integrate
reusable/remanufa
ctured components
(i)
Alliances
(with
suppliers
May participate in
traditional alliances
such as
Exploits a
dynamic type of
alliance known
Supply chain
partners join an
alliance network
Inter-or
g
anizational
collaboration
involving
Supply Chain Management
34
and
customers)
partnerships and
joint ventures at the
operating level
(a)
.
The demand
information is
spread along the
supply chain
(b)
as a ‘‘virtual
organization’’ for
product design
(a)
. It promotes
the market place
visibility
to develop
security practices,
share
knowledge
(e)
and
increasing
demand
visibility
(d)
transferring or/and
disseminating
green knowledge to
partners
(l)
and
customer
cooperation
(f)
Organizatio
nal
structure
Uses a static
organizational
structure with few
levels in the
hierarchy
(a)
Create virtual
organizations
with partners
that vary with
different product
offerings that
change
frequently
(a)
Create a supply
chain risk
management
culture
(d)
Create an internal
environmental
management
s
y
stem and develop
environmental
criteria for risk-
sharing
(h)
Approach to
choosing
suppliers
Supplier attributes
involve low cost
and high quality
(a)
Supplier
attributes involve
speed, flexibility,
and quality
(a)
Flexible sourcing
(c; e)
Green purchasing
(f;
h)
Inventory
strategy
Generates high
turns and
minimizes
inventory
throughout the
chain
(a)
Make in response
to customer
demand
(a)
Strategic
emergency stock
in potential
critical points
(c; d; e)
Introduce reusable/
remanufactured
parts in material
inventory
(j)
. Reduce
replenishment
frequencies to
decrease carbon
dioxide
emissions
(k)
. Reduce
redundant
materials
(m)
Lead time
f
ocus
Shorten lead-time
as long as it does
not increase cost
(a)
Invest
aggressively in
ways to reduce
lead times
(a)
Reduce lead-
time
(c; d)
and use
flexible
transportation
systems
(c; e)
Reduce
transportation lead
time as long it does
not increase carbon
dioxide emissions
(k)
Product
design
strategy
Maximize
performance and
minimize cost
(a)
Design products
to meet
individual
customer needs
(a)
Postponement
(c)
Eco-design and life
cycle for evaluating
ecological risks and
impact
(f; g)
Legend: (a) Vonderembse et al. (2006); (b) Melton (2005); (c) Tang (2006); (d) Christopher &
Peck (2004); (e) Iakovou et al. (2007); (f) Zhu et al. (2008); (g) Gottberg et al. (2006); (h)
Bowen et al. (2001); (i) Sarkis (2003); (j) Srivastava (2007; (k) Venkat & Wakeland (2006); (l)
Cheng et al. (2008); (m) Darnall et al. (2008)
Table 1. Lean, agile, resilient and green characterization.
Integrating Lean, Agile, Resilience and Green Paradigms
in Supply Chain Management (LARG_SCM)
35
3. Deployment of LARG_SCM
3.1 Supply chain management practices and attributes
According to Morash (2001) supply chain management paradigms or strategies should be
supported on suitable supply chain management practices. Li et al. (2005) defined supply
chain management practices as the set of activities undertaken by an organization to
promote effective management of its supply chain. Some authors also deploy supply chain
management practices in a set of sub-practices, or activities or even in tools. From table 1 is
possible to infer the following practices for each one of the paradigms:
• Lean practices: inventory minimization, higher resources utilization rate, information
spreading trought the network, just-in-time practices, and shorter lead times;
• Agile practices: inventory in response to demand, excess buffer capacity, quick
response to consumer needs, total market place visibility, dynamic alliances, supplier
speed, flexibility and quality, and shorter lead times;
• Resilient practices: strategic inventory, capacity buffers, demand visibility, small
batches sizes, responsiveness, risk sharing, and flexible transportation;
• Green practices: reduction of redundant and unnecessary materials, reduction of
replenishment frequency, integration of the reverse material and information flow in
the supply chain, environmental risk sharing, waste minimization, reduction of
transportation lead time, efficiency of resource consumption;
Supply chain management practices are enablers to achieve supply chain capabilities or core
competences. Morash et al. (1996) defined supply chain capabilities or distinctive competencies
as those attributes, abilities, organizational processes, knowledge, and skills that allow a firm
to achieve superior performance and sustained competitive advantage over competitors.
Therefore the supply chain practices, through the constitution of capabilities, have a direct
effect on supply chain performance. In this chapter the word “supply chain attribute” is used
to describe a distinctive characteristics or capabilities associated to the management of supply
chains. These characteristics are related to the supply chain features that can be managed
through the implementation of supply chain management practices. The attributes values may
have a nominal properties (e.g. a product is reusable or not), ordinary properties (e.g. the
integration level between two supply chain entities is higher or lower than the average) or
cardinal properties (i.e. the attribute can be compute, like the production lead time).
In this chapter the following supply chain attributes were considered: “capacity surplus”,
“replenishment frequency”, “information frequency”, “integration level”, “inventory level”,
“production lead time”, and “transportation lead time”. The attributes value can be altered
by the deployment of the different supply chain paradigms. Supply chain attributes are key
aspects of the supply chain strategies and determine the entire supply chain behaviour, so
the supply chain attributes will enable the measuring of supply chain performance.
3.2 Supply chain performance
To develop an efficient and effective supply chain, it is necessary to assess its performance.
Performance measures should provide the organization an overview of how they and their
supply chain are sustainable and competitive (Gunasekaran, 2001). Several authors discuss
which performance indicators are the key metrics for lean and agile supply chains (Nailor et
al., 1999; Argwal et al., 2006; Christopher & Towill, 2000; Mason-Jones at al., 2000). Kainuma &
Tawara (2006) refer that “there are a lot of metrics for evaluating the performance of supply
chains. However, they may be aggregated as lead time, customer service, cost, and quality”.
Supply Chain Management
36
Christopher & Towill, (2000) discuss the differences in market focus between the lean and agile
paradigms using market winners (essential requisites for winning) and market qualifiers
(essential requisites to sustain competitiveness). These authors consider that when cost is a
market winner and quality, lead time and service level are market qualifiers, the lean
paradigm is more powerful to sustain supply chain performance. When service level
(availability in the right place at the right time) is a prime requirement for winning and cost,
quality and lead time are market qualifiers, agility is a critical dimension. In the resilient
paradigm, the focus is on recovery the desired values of the states of a system (characterized
by a service level and a certain quality) within an acceptable time period and cost. Hence, for
resilient supply chains, the cost and time are critical performance indicators. The green
paradigm is concerned with the minimization of the negative environmental impacts in the
supply chain; however this minimization cannot be done to the detriment of supply chain
performance in quality, cost, service level and time.
In this perspective, it is possible to state that the critical dimensions for each paradigm are:
cost for lean; service level for agile; time and cost for resilient. Therefore in this chapter,
“cost”, “service level” and “lead time” were selected as key performance indicators to
evaluate the effect of each paradigm in the supply chain performance. Quality was not
considered in this analysis since is a prerequisite for lean, agile, resilient and green
paradigms to sustain the supply chain performance.
To evaluate the effect of the paradigms deployment in supply chain management, it
necessary to establish the relationship between the supply chain attributes (derived from the
paradigms deployment) with the selected key performance indicators. Figure 1 contains a
diagram with the relationships between supply chain performance indicators and attributes.
Fig. 1. Performance indicator and supply chain attributes relationships.
A causal diagram was selected to capture the supply chain dynamics. With this diagram, it
is possible to visualize how the supply chain attributes affect the performance indicators. A
positive link means that the two nodes move in the same direction, i.e., if the node in which
Integrating Lean, Agile, Resilience and Green Paradigms
in Supply Chain Management (LARG_SCM)
37
the link start decreases, the other node also decreases (if all else remains equal). In the
negative link, the nodes changes in opposite directions, i.e., an increase will cause a decrease
in another node (if all else remains equal) (Sterman, 2000).
To construct the cause-effect diagram it was supposed that the supply chain attributes, which
are the consequence of the policies implementation, are directly responsible for the supply
chain performance measures value. For example, the “replenishment frequency” (a supply
chain attribute) will establish the value of the performance measures “service level” and
“cost”, since more frequent deliveries imply a higher distribution cost, leading to higher
supply chain costs
The key performance indicator “service level” is affected positively by the “replenishment
frequency” (it increases the capacity to fulfil rapidly the material needs in supply chain)
(Holweg, 2005), “capacity surplus” (a slack in resources will increases the capacity for extra
orders production) (Holweg, 2005) and “integration level” (the ability to co-ordinate
operations and workflow at different tiers of the supply chain allow to respond to changes
in customers requirements) ( Gunasekaran, 2008). An increasing of “integration level” will
lead to a high frequency of information sharing between supply chain entities; it will make
possible a high “replenishment frequency”. The lead-time reduction improves the “service
level” (Agarwal et al., 2007).
The “inventory level” has two opposite effects in the “service level” (the mark +/- is used to
represent this causal relation in Figure 1). Since it increases materials availability, reducing
the stock-out ratio, a higher “service level” is expected (Jeffery et al., 2008). However, high
inventory levels also generate uncertainties (Van der Vorst & Beulens, 2002) leaving the
supply chain more vulnerable to sudden changes (Marley, 2006) and therefore reducing the
service level in volatile conditions. This apparent contradict behavior is also present when
an increasing in the “integration level” occurs, which may lead to an improvement in the
“service level”. However, the “inventory level” is affected negatively by the “integration
level” (since it increases the supply chain visibility, minimizing the need of material
buffers), improving the “service level”.
The key performance indicator “cost” is affected positively by the “capacity surplus” and
“inventory level”, since they involve the maintenance of resources that have not being used.
An increase in the “replenishment frequency” also increases the “cost”, due to the frequent
transport of small quantities. To reduce “transportation time” premium services may be
used; usually these services are more expensive. The “production lead time” affects
“positively” the cost (Towill, 1996).
Finally, the key performance indicator “lead time” is positively affected by the “production
lead time” and “transportation time”.
4. LARG_SCM practices and supply chain attributes inter-relationship
Conceptual model
The tradeoffs between lean, agile, resilient, and green supply chain management paradigms
(LARG_SCM) must be understood to help companies and supply chains to become more
efficient, streamlined, and sustainable. To this end, it is necessary to develop a deep
understanding of the relationships (conflicts and commitments) between the lean, agile,
resilient and green paradigms, exploring and researching they contribute for the sustainable
competitiveness of the overall production systems in the supply chain. Causal diagrams
may be used to represent the relationships between each paradigm practices and supply
chain attributes.
Supply Chain Management
38
4.1 Lean practices vs. supply chain attributes
Lean practices are characterized by (see Table 1): inventory minimization, higher resources
utilization rate, information spreading throught the network, just-in-time practices,
traditional alliances and shorter lead times. Figure 2 was drawn to infer the lean practices
impact in the supply chain performance - the diagram shows the relationships between the
lean practices and the supply chain chain performance.
Fig. 2. Lean practices and supply chain performance relationships.
This figure may be better understood having in mind the following interpretation:
• The “inventory level” is affected negatively by the inventory minimization (a higher
level of inventory minimization provokes a lower level of inventory).
• The “integration level” is positively related to the level of trust, openness and profit
sharing of the traditional alliances in lean supply chains.
• The “information frequency” is improved by information spreading throught the
network.
• The implementation of just in time practices increases the “replenishment frequency”.
• The lean paradigm is characterized by a higher utilization rate of the supply chain
resources causing a decrease in the supply chain “capacity surplus”.
• The reduction of lead time affects negatively the “production and transportation lead
times” (an increment level of lead time reduction provokes a reduction production and
transportation lead times).
4.2 Agile practices vs. supply chain attributes
It is possible to conclude that the main agile supply chain practices are (see Table 1):
inventory in response to demand, excess buffer capacity, quick response to consumer needs,
total market place visibility, dynamic alliances, supplier speed, flexibility and quality, and
shorter lead times. Figure 3 shows the relationships between the supply chain agile
attributes and the supply chain performance:
• The “inventory level” is affected negatively by the inventory in response to customer
demand (if the inventory is designed to respond to costumer needs, then lower levels of
Integrating Lean, Agile, Resilience and Green Paradigms
in Supply Chain Management (LARG_SCM)
39
inventory in supply chain are expected) and by the supplier flexibility, speed and
quality (if the supplier have higher levels of flexibility, speed and quality the need of
inventory buffers is low, which may lead to lower inventory levels).
• The “information frequency” is improved by eventual increasing in the supply chain
visibility.
• The “integration level” is positively related to the existence of dynamic alliances in the
agile supply chains.
• The quick response to customer needs increases the “replenishment frequency”.
• The agile paradigm prescribes the existence of a capacity excess in the supply chain
resources provoking an increasing in “capacity surplus”.
• The reduction of lead time affects negatively the “production and transportation lead
times” (an increment level of lead time reduction provokes a reduction in production
and transportation lead times).
Fig. 3. Agile attributes and supply chain performance relationships.
4.3 Resilient practices vs. supply chain attributes
From Table 1, it is possible to verify that the main resilient supply chain practices are:
strategic inventory, capacity buffers, demand visibility, small batches sizes, responsiveness,
risk sharing, and flexible transportation. Figure 4 contains a diagram with the relationships
between the supply chain resilient attributes and the supply chain performance:
• The “inventory level” is affected positively by the strategic stock policies (the
constitution of strategic inventory buffers in supply chain increases the inventory
levels).
• The “information frequency” is improved by the increasing in the demand visibility.
• The “integration level” is positively related to the risk sharing strategies in the resilient
supply chains. A higher level of responsiveness increases the “replenishment
frequency”.
Supply Chain Management
40
• The resilience practices prescribe the existence of supply chain capacity buffers
provoking an increasing in “capacity surplus”.
• The utilization of small batch sizes allows the reduction of the “production lead time”.
The flexible transport strategy contributes to a reduction in the “transportation lead
time”.
Fig. 4. Resilient practices and supply chain performance relationships.
4.4 Green practices vs. supply chain attributes
From Table 1, the main green supply chain practices were identified as: reduction of
redundant and unnecessary materials, reduction of replenishment frequency, integration of
the reverse material and information flow in the supply chain, environmental risk sharing,
waste minimization, reduction of transportation lead time, efficiency of resource
consumption. Figure 5 contains a diagram with the relationships between the supply chain
green attributes and the supply chain performance:
• The “inventory level” is affected negatively by the reduction of redundant and
unnecessary materials in the supply chain.
• The “integration level” is positively related to the development of environmental risk
sharing strategies and to the level of reverse material and information flow integration
in the supply chain.
• It was not found evidences in literature that supports the influence of green supply
chain practices on “information frequency”.
• The higher level of replenishment frequencies reduction decreases the “replenishment
frequency”.
• The green practices prescribe the efficiency of resources consumption contributing to
supply chain “capacity surplus” reduction.
• The waste minimizations contribute negatively the “production lead time” (an
increment in waste minimizations provokes a reduction in the production lead times).
The reduction of transport lead time, without an increment in dioxide carbon emissions,
contributes to a reduction in the “transportation time”.
Integrating Lean, Agile, Resilience and Green Paradigms
in Supply Chain Management (LARG_SCM)
41
Fig. 5. Green practices and supply chain performance relationships.
4.5 LARG_SCM practices vs. supply chain attributes
To provide the necessary understanding of lean, agile, resilient and green paradigms
divergences and commitments an overlap of the diagrams with the relationships between
the different supply chain practices and the supply chain paradigms was developed. Figure
6 integrates the paradigms practices and supply chain performance relationships. From the
causal diagram, it is possible to verify that some supply chain attributes are positively
affected by all paradigms. All paradigms practices contribute to:
• “Information frequency” increasing.
• “Integration level” increasing.
• “Production lead time” reduction.
• “Transportation lead time” reduction.
For the others supply chain attributes, the paradigms implementation result in different
directions. The divergences related to the “capacity surplus” are the following:
• The lean and green paradigms prescribe a reduction in the supply chain capacity
buffers, in order to reduce the unnecessary wastes and promoting the efficiency of
resource consumption.
• The agile and resilient paradigms prescribe an increase in the capacity surplus to
increase the supply chain ability to respond to changes in customer’s needs and to
possible disturbances.
Another divergence is related to the “replenishment frequency”:
• The lean, agile and resilient paradigms prescribe an increase in the replenishment
frequency in order to respond quickly to costumer’s needs and increase the supply
chain responsiveness.
• The green paradigm prescribes a reduction in replenishment frequency to reduce
transportation emissions, promoting the transport consolidation.
The third divergence between paradigms is related to the “inventory level”:
• The lean, agile and green strategies prescribe a reduction in the inventory level.
• The resilient strategy promotes the constitution of strategic inventory buffers.
Supply Chain Management
42
Fig. 6. Conceptual model with lean, agile, resilient and green practices and supply chain
performance.
Table 2 shows an overview of main synergies and divergences between the paradigms
under study. There are evidences that the lean, agile, resilient and green paradigms are
complemented by each others. The implementation of these paradigms in the supply chain
creates synergies in the way that some supply chain attributes should be managed, namely,
“information frequency”, “integration level”, “production lead time” and “transportation
lead time”. However, the impact of each paradigm implementation in the characteristics
Paradigms
Supply chain attributes
Lean Agile Resilient Green
Information frequency
↑ ↑ ↑
–
Integration level
↑ ↑ ↑ ↑
Production lead time
↓ ↓ ↓ ↓
Transportation lead time
↓ ↓ ↓ ↓
Synergies
Capacity surplus
↓ ↑ ↑ ↓
Inventory level
↓ ↓ ↑ ↓
Replenishment frequency
↑ ↑ ↑ ↓
Divergences
Legend: ↑ increase; ↓ decrease; – without consequence;
Table 2. LARG_SCM synergies and divergences overview.
Integrating Lean, Agile, Resilience and Green Paradigms
in Supply Chain Management (LARG_SCM)
43
magnitude may be different. For example, the lean paradigm seeks compulsively the
reduction of production and transportation lead times to promote the total lead time
reduction and minimizing the total waste. However, the resilient paradigm, although it
prescribes this reduction in lead times, it is not so compulsive, since the objective is to
increase the supply chain visibility and capability to respond to unexpected events.
There are some apparent divergences in the application of the paradigms; namely, in what is
concerned to the “capacity surplus”, “replenishment frequency” and “inventory level”. The
capacity surplus is an attribute of agile and resilient supply chains, since this buffer in
capacity allow to respond to changes in customers needs or to unexpected events. This does
not mean that supply chain should have an enormous capacity surplus; that would be
unacceptable in terms of cost and efficiency. However, existence of redundancies in critical
processes should be considered in conjugation with lean and green paradigm
implementation. The same question arises with the inventory level (which is another type of
redundancy). The presence of high inventory levels may hide the causes of a poor supply
chain performance and generate materials obsolescence; for that reason, the lean, agile and
green paradigms prescribe the minimization of inventory levels. Even so, if the inventory of
critical materials is maintained in low levels, the supply chain will be more vulnerable to
unexpected events that affect these materials supply. Other conflict is related to the
replenishment frequency, which should be improved to minimize wastes and increase
supply chain responsiveness and adaptation. However, an increase in the replenishment
frequency may be obtained trough the numerous deliveries of small quantities to supply
chain entities, increasing the number of expeditions and consequently increasing the dioxide
carbon emissions due to transportation. The green supply chain prescribes a reduction in the
delivery frequency in order to reduce dioxide carbon emissions. However, this could be
achieved, through not only the delivery frequency, but using other strategies as the selection
of transport modes with low dioxide carbon emission, reducing geographic distances
between entities, and transport consolidation, among others.
5. Conclusion
This paper investigated the possibility to merge lean, agile, resilient and green paradigms in
the supply chain management (LARG_SCM). These four paradigms have the same global
purpose: to satisfy the customer needs, at the lowest possible cost to all members in the
supply chain. The principal difference between paradigms is the purpose: the lean supply
chain seeks waste minimization; the agile supply chain is focused on rapid responding to
market changes; the resilient supply chain as the ability to respond efficiently to
disturbances; and the green supply chain pretends to minimize environmental impacts.
A state-of-the-art literature review was performed to: i) characterize and identifing the main
supply chain practices of each paradigm; ii) to support the development of a conceptual
model focused on the integration of lean, agile, resilient and green practices and supply
chain attributes. The main objective was to identify supply chain attributes that should be
managed to obtain: the necessary organizational agility; to speed-up the bridging between
states that require more or less degree of resilience; to preserve the dynamic aspects of the
lean paradigm and; to assure its harmonization with the ecologic and environmental aspects
that production processes may attend.
Supply Chain Management
44
5.1 Our results
The conceptual model development and analysis showed that some supply chain attributes
are positively related to all paradigms creating synergies among them. All paradigms
practices were found to contribute to: “information frequency” increasing, “integration
level” increasing, “production lead time” reduction, and “transportation lead time”
reduction. However, there are some apparent divergences in the application of the
paradigms; namely, in what is concerned to the “capacity surplus”, “inventory level” and
“replenishment frequency”. However, “capacity surplus” and “inventory level” increases
may provide the supply chain with added agility and resilience characteristics, needed to
respond to changes in costumer needs and unexpected events. The reduction of the
“replenishment frequency” appears to be related to the concerns of reduction dioxide
carbon emissions in the supply chain.
5.2 What is new and future research?
The identification of the conceptual relations among LARG_SCM paradigms is a
contribution that we hope to become a step forward in the development of a new theoretical
approaches and empirical research in supply chain management field. The conceptual
model presented in this chapter provides a holistic perspective towards the investigation of
the integration of lean, agile, resilience and green paradigms in supply chain management.
It represent the first effort to “drill down” the key attributes related to lean, agile, resilience
and green paradigms deployment in a supply chain context, providing links between
supply chain attributes, paradigms and supply chain performance.
Therefore this chapter scientific contribution is twofold: first, it contributes for research on
supply chain management by providing links between the deployment of LARG_SCM
paradigms and supply chain performance; and second, it identifies synergies and
divergences between the paradigms. From the managerial point of view, since it provides
the links between supply chain paradigms with supply chain performance, it gives to
supply chain manager’s insights on how the adoption of paradigms will affect their
network, and how it can increase the supply chain performance.
Despite the important contribution of this chapter, limitations of the study should be noted.
The conceptual model was developed using anecdotal and empirical evidences present in
the literature and no validation where performed. It is necessary to conduct further
empirical research concerning to the deployment of lean, agile, resilience and green
paradigms in supply chain management, both in terms of testing the model herein proposed
and to the greater understanding of this discipline.
6. Acknowledgements
This research is funded by Fundação para a Ciência e Tecnologia (Project MIT-Pt/EDAM-
IASC/0033/2008 and Project PTDC/EME-GIN/68400/2006). Helena Carvalho was
supported by a PhD fellowship from Fundação para a Ciência e Tecnologia
(SFRH/BD/43984/2008).
7. References
Adamides, E. D.; Karacapilidis, N.; Pylarinou, H. & Koumanakos, D. (2008). Supporting
collaboration in the development and management of lean supply networks.
Production Planning & Control, Vol. 19, No. 1, pp. 35-52
Integrating Lean, Agile, Resilience and Green Paradigms
in Supply Chain Management (LARG_SCM)
45
Agarwal, A.; Shankar, R. & Tiwari, M. K. (2006). Modeling the metrics of lean, agile and
leagile supply chain: An ANP-based approach. European Journal of Operational
Research , Vol. 173, pp. 211-225
Agarwal, A.; Shankar, R. & Tiwari, M. (2007). Modeling agility of supply chain. Industrial
Marketing Management, Vol. 36, No. 4, pp. 443-457
Anand, G. & Kodali, R. (2008). A conceptual framework for lean supply chain and its
implementation. International Journal of Value Chain Management, Vol. 2, No. 3, pp.
313-357
Azevedo, S.G. ; Machado, V. H., Barroso A. P. & V. Cruz-Machado 2008. Supply Chain
Vulnerability: Environment Changes and Dependencies. International Journal of
Logistics and Transport, Vol. 1, No.1, pp. 41-55
Baramichai, M.; Zimmers Jr., E. W. & Marangos, C. A. (2007). Agile supply chain
transformation matrix: an integrated tool for creating an agile enterprise. Supply
Chain Management: An International Journal, Vol. 12, No. 5, pp. 334-348
Barroso, A. P. & Machado, V. H. (2005). Sistemas de Gestão Logística de Resíduos em
Portugal. Investigação Operacional, Vol. 25, pp. 179-94
Bowen, F. E.; Cousine, P. D.; Lamming, R. C. & Faruk, A. C. (2001). Horse for courses:
Explaining the gap between the theory and practice of green supply. Greener
Management International, (Autumn), pp. 41-59.
Cheng, J H, Yeh, C H & Tu, C W. (2008) .Trust and knowledge sharing in green supply
chains. Supply Chain Management, Vol. 13, No.4, pp. 283-295
Christopher, M. & Peck, M. (2004). Building the Resilient Supply Chain. International Journal
of Logistics Management, Vol. 15, No. 2, pp. 1-14
Christopher, M. & Rutherford, C. (2004). Creating Supply Chain Resilience Through Agile
Six Sigma. Critical Eye, (June-August), pp. 24-28
Christopher, M. & Towill, D. R. (2000). Supply chain migration from lean and functional to
agile and customized. Supply Chain Management: An International Journal, Vol. 5, No.
4, pp. 206-213
Christopher, M. (2000). The agile supply chain, competing in volatile markets. Industrial
Marketing Management, Vol. 29, No. 1, pp. 37-44
Cox, A. & Chicksand, D. (2005). The Limits of Lean Management Thinking: Multiple
Retailers and Food and Farming Supply Chains. European Management Journal, Vol.
23, No. 6, pp. 648-662
Craighead, C.W. ; Blackhurst, J. ; Rungtusanatham, M.J. & Handfield, R. B. (2007). The
Severity of Supply Chain Disruptions: Design Characteristics and Mitigation
Capabilities. Decision Sciences, Vol. 38, No. 1, pp. 131-156
Darnall, N., Jolley, G. J. & Handfield, R. (2008). Environmental Management Systems and
Green Supply Chain Management: Complements for Sustainability. Business
Strategy and the Environment, Vol. 18, No. 1, pp. 30-45
Glickman, T. S. & White, S.C. (2006). Security, visibility and resilience: the keys to mitigating
supply chain vulnerabilities. International Journal of Logistics Systems and
Management, Vol. 2, No. 2, pp. 107-119
Gottberg, A., Morris, J.; Pollard, S.; Mark-Herbert, C. & Cook, M. (2006). Producer
responsibility, waste minimisation and the WEEE Directive: Case studies in eco-
Supply Chain Management
46
design from the European lighting sector. Science of the Total Environment, Vol. 359,
No. 1/3, pp. 38-56
Gunasekaran, A.; Patel, C. & Tirtiroglu, E. (2001). Performance measures and metrics in a
supply chain environment. International Journal of Operations & Production
Management, Vol. 21, No. 1/2, pp. 71-87
Gunasekaran, A.; Laib, K. & Cheng, T. C. E. (2008). Responsive supply chain: A competitive
strategy in a networked economy. Omega, Vol. 36, No. 4, pp. 549-564
Haimes, Y. Y. (2006). On the Definition of Vulnerabilities in Measuring Risks to
Infrastructures. Risk Analysis, Vol. 26, No. 2, pp. 293 -296
Hines, P.; Holweg M. & Rich, N. (2004). Learning to evolve A review of contemporary lean
thinking. International Journal of Operations & Production Management, Vol. 24, No.
10, pp. 994-1011
Holweg, M. (2005). An investigation into supplier responsiveness: empirical evidence from
the automotive industry. International Journal of Logistics Management, Vol. 16, No. 1,
pp. 96-11
Hong, P.; Kwon, H. & Roh, J. J. (2009). Implementation of strategic green orientation in
supply chain: An empirical study of manufacturing firms. European Journal of
Innovation Management, Vol. 12, No. 4, pp. 512-532
Iakovou, E.; Vlachos, D. & Xanthopoulos, A. (2007). An analytical methodological
framework for the optimal design of resilient supply chains. International Journal of
Logistics Economics and Globalisation, Vol. 1, No. 1, pp. 1-20
Jeffery, M. M.; Butler, R.J. & Malone, L. C. (2008). Determining a cost-effective customer
service level. Supply Chain Management: An International Journal, Vol. 13, No. 3, pp.
225-232
Kainuma, Y. & Tawara, N. (2006). A multiple attribute utility theory approach to lean and
green supply chain management. International Journal of Production Economics,
Vol. 101, No. 1, pp. 99-108
Larson T. & Greenwood, R. (2004). Perfect Complements: Synergies between Lean
Production and Eco-Sustainability Initiatives. Environmental Quality Management,
Vol. 13, No. 4, pp. 27-36
Li, S. ; Rao, S. ; Ragu-Nathan, T. S. & Ragu-Nathan, B. (2005). Development and validation of
a measurement instrument for studying supply chain management practices.
Journal of Operations Management, Vol. 23, No. 6, 618-641
Linton, J. D.; Klassen R. & Jayaraman, V. (2007). Sustainable supply chains: An introduction.
Journal of Operations Management, Vol. 25, No. 6, pp. 1075-1082
Marley, K. A. (2006). Mitigating supply chain disruptions: essays on lean management,
interactive complexity and tight coupling. Doctoral Dissertation, Ohio State
University, Business Administration, 2006
Mason-Jones, R., Naylor J. B. & Towill, D. (2000). Engineering the Leagile Supply Chain,
International Journal of Agile Management Systems, Vol. 2, No. 1, pp. 54-61
Melton, T. (2005). The benefits of lean manufacturing what lean thinking has to offer the
process industries. Chemical Engineering Research and Design, Vol. 83, No. 6, pp. 662-
673
Integrating Lean, Agile, Resilience and Green Paradigms
in Supply Chain Management (LARG_SCM)
47
Morash, E.A., (2001). Supply chain strategies, capabilities, and performance. Transportation
Journal, Vol. 41, No. 1, pp. 37-54
Morash, E.A., Droge, C. & Vickery, S. (1996). Strategic logistics capabilities for competitive
advantage and firm success. Journal of Business Logistics, Vol. 17, No. 1, pp.1-22
Naylor, B.J.; Naim, M. M. & Berry, D. (1999). Leagility: Integrating the lean and agile
manufacturing paradigms in the total supply chain. International Journal of
Production Economics, Vol. 62, No. 1/2, pp. 107-118
Naylor, J. B.; Naim, M. M. & Berry, D. (1999). Leagility: Integrating the lean and agile
manufacturing paradigms in the total supply chain. International Journal of
Production Economics, Vol. 62, No. 10, pp. 107-118
Ohno, T. (1998). The Toyota Production System. Productivity Press, Portland, 1998
Peck, H. (2005). Drivers of supply chain vulnerability: an integrated framework. International
Journal of Physical Distribution & Logistics Management, Vol. 35, No. 4, pp. 210-232
Rao, P. & Holt, D. (2005). Do green supply chains lead to competitiveness and economic
performance? International Journal of Operations & Production Management, Vol. 25,
No. 9, pp. 898-916
Reichhart, A. & Holweg, M. (2007). Lean distribution: concepts, contributions, conflicts.
International Journal of Production Research, Vol. 45, No. 16, pp. 3699-3722
Rice, B. F. & Caniato (2003). Building a secure and resilient supply network. Supply Chain
Management Review, Vol. 7, No. 5, pp 22-30
Rosič, H.; Bauer, G. & Jammernegg, W. (2009). A Framework for Economic and
Environmental Sustainability and Resilience of Supply Chains. In Rapid Modelling
for Increasing Competitiveness, Reiner, G., pp. 91-104, Springer, New York
Sarkis, J. (2003). A strategic decision framework for green supply chain management. Journal
of Cleaner Production, Vol. 11, No. 4, pp. 397-409
Sheffi, Y. & Rice, J. B. (2005). A supply chain view of the resilient enterprise. Sloan
Management Review, Vol. 47, No. 1, pp. 41-48
Srivastava, S. K. (2007). Green supply-chain management: A state-of the- art literature
review. International Journal of Management Reviews, Vol. 9, No. 1, pp. 53-80
Sterman, J. (2000). Business Dynamics: Systems Thinking and Modeling for a Complex
World, New York: McGraw-Hill
Tang, C. S. (2006). Robust strategies for mitigating supply chain disruptions. International
Journal of Logistics Research and Applications: A Leading Journal of Supply Chain
Management, Vol. 9, No. 1, pp. 33
Towill, D. R. (1996). Time compression and supply chain management – a guided tour.
Supply Chain Management: An International Journal, Vol. 1, No. 1, pp. 15–27
Van der Vorst J.G.A.J. & Beulens, A.J.M. (2002). Identifying sources of uncertainty to
generate supply chain redesign strategies. International Journal of Physical
Distribution & Logistics Management, Vol. 32, No. 6, pp. 409- 430
Venkat, K. & Wakeland, W. (2006). Is Lean Necessarily Green? Proceedings of the 50th Annual
Meeting of the ISSS (International Society for the Systems Sciences)
Vonderembse, M. A.; Uppal, M.; Huang, S. H. & Dismukes, J. P. (2006). Designing supply
chains: Towards theory development. International Journal of Production Economics,
Vol. 100, No. 2, pp. 223-238
Supply Chain Management
48
Womack, J. P.; Jones, D. T. & Roos, D. (1991). The Machine That Changed the World : The
Story of Lean Production, Harper Perennial
Zhu, Q.; Sarkis, J. & Lai, K. (2008). Confirmation of a measurement model for green supply
chain management practices implementation. International Journal of Production
Economics, Vol. 111, No. 2, pp. 261-273
3
A Hybrid Fuzzy Approach to Bullwhip
Effect in Supply Chain Networks
Hakan Tozan and Ozalp Vayvay
Turkish Naval Academy, Marmara University
Turkey
1. Introduction
Today all small and medium size enterprises, companies and even countries (either in
private, public or military domain) in the national and international business area are
continuously performing activities to provide capabilities for satisfying customer needs (i.e.,
demand) those indeed include many sophisticated interrelated functions and processes such
as decision making, management, new product development, production, marketing,
logistics, finance, quality control and etc. which, all together compose dynamic, complex
and chaotic structures called supply chain networks (SCNs). These complex structures with
all interrelated functions have to be designed and managed perfectly pointing us to the well-
known term SCN management (SCNM). Due to the complex information flow in these
systems; which consists of cumulative data about costs parameters, production activities,
inventory systems and levels, logistic activities and many other related processes, we may
unwaveringly express that the performance of a successful SCN directly related to the
constant, accurate and appropriate demand information flow as this vital flow of
information inarguably influences all decision making processes in all stages of SCNs.
A well-known phenomenon of SCNs called the “Bullwhip or Whiplash Effect” (BWE) is the
variability of the demand information between the stages of the SCN and the increase in this
variability as the demand data moves upstream from the customer to the following stages of
the SCN engendering undesirable excess inventory levels, defective labor force, cost
increases, overload errors in production activities and etc. From 1952 till now many studies
have been done about BWE. However very few of them interested in fuzzy and neuro-fuzzy
system (NFS) approaches to BWE such as Carlssson and Fuller (1999, 2001, 2002, 2004) and
Efendigil et al. (2008).
Making accurate and appropriate estimation about future in decision making process is the
leading activity providing bases for almost every managerial applications including SCNs.
Demand forecasting and decision making are among the key activities that directly affect
the SCN performance. To smoothen the undesirable variability of demand through the
stages of SCN due to the chaotic nature of SCN system, appropriate demand forecasting is
vital. As demand pattern varies due to the field of activity and architecture of SCNs,
determining the appropriate forecasting model and adequate order/demand decision
process for system interested in is snarl. As the nature of forecasting and decision making
contains uncertainty or vagueness of the human judgment, they perfectly fit for the
Supply Chain Management
50
applications of fuzzy logic (FL) (Kahraman, 2006), artificial neural networks (ANNs) and;
more specifically, the combination of these two complementary technologies (i.e.; NFS). The
FL; which was introduced by Zadeh in 1965 with his pioneer work “Fuzzy Sets”, can simply
be defined as “a form of mathematical logic in which truth can assume a continuum of
values between 0 and 1” ( 2009). On the contrary to
crisp (discrete) sets which divide the given universe of discourse in to basic two groups as
members and nonmembers, FL has the capability of processing data using partial set
membership functions which makes FL a strong device for impersonating the ambiguous
and uncertain linguistic knowledge (Kahraman, 2006). The advantage of approximating
system behavior where analytic functions or numerical relations do not exist provide
opportunity to fuzzy set theory for becoming an important problem modeling and solution
technique which also bring along the usage of FL successfully in many fields of scientific
researches, industrial and military applications such as control systems, decision making,
pattern recognition, system modeling and etc. (Ross, 2004). Due to the perfect harmony of
forecasting nature and fuzzy set theory, studies related to fuzzy forecasting is pretty much
in the literature (see Kahraman, 2006). Fuzzy regression (FR) forecasting models are also
among the successful applications fuzzy forecasting models. Contrary to the enormous
literature about determining the appropriate forecasting and order/production decision
models in SCNs, relatively few of them interested in fuzzy or neuro-fuzzy approaches.
The aim of this chapter is to carry out a literature review about the BWE, to provide a brief
overview about FL, NFS, FR forecasting model and to introduce the proposed conjoint
hybrid approach made up of an ANFIS based demand decision process together and FR
forecasting model.
2. Basic literature
In this section at first, a basic review of literature about BWE is given and the fuzzy
approach related studies about BWE is overviewed after that.
2.1 Bullwhip literature
The first academic research on BWE grounds on Jay W. Forrester (1958, 1961). In his pioneer
work Forrester, using a simple four echelon SCN simulation (retailer, wholesaler, distributor
and factory) discovered the existence of the ‘demand amplification’ which later denominated
as BWE (Lee et al., 1997a, 1997b). He argued about the causes and suggested same ideas to
control the BWE. He concluded that the decision making process and time delays in each
phase of SCN and the factory capabilities could be the main reasons of the demand
amplification through the chain from the retailer to the factory (upstream through the chain)
as; any increase in customer demand at any point of time causes increases in retailers demand
from the wholesaler, the wholesalers demand from distributor and in the same manner, the
distributors demand from the factory. But in each, the amount of the demand accrual rate
amplifies not only by taking account the real demand increases but also possible future
increases causing inessential excessive inventory levels. Forrester also analyze the effect of
advertising factor and saw that it also influences the system by engendering the BWE. He, as a
solution, emphasized on the importance of knowledge about the system and suggested that
the key fact for handling the BWE is to understand the whole SCN system.
A Hybrid Fuzzy Approach to Bullwhip Effect in Supply Chain Networks
51
Burbidge (1961); thought his study was about production and inventory control, also
interested in demand amplification. In 1984, he concluded that an increase in demand
variability would occur in every transfer of demand information if demands are carried over
a series of inventories using “stock control ordering”. This definition is accepted to be the
“first thorough definition” of BWE (Miragliotta, 2005).
Like Forrester, Sterman (1984, 1989a, 1989b) also focused on the existence and causes of
BWE. He used an experimental four-stage SCN role-playing simulation that simulates the
beer distribution in a simple SCN which is then became a well-known SCN simulation game
that successfully depicts the notion of system dynamics; “The Beer Distribution Game”,
widely used for teaching the behavior, concept and structure of SCN. The model was so
simple but despite to its simplicity, it successfully showed the impact of the decision process
in each echelon on the demand variability. Main objective is to govern echelons by achieving
desired inventory and pipeline levels minimizing the total cost.
Participants of the game try to govern each echelon based on the information available for
making ordering decision in each echelon. In other words, the real demand of customer only
known by retailer who directly gets the customer orders and other echelons only have the
demand information of the predecessor echelons those placed their demand directly to
them. Game begins with the customer demand from the retailer, who tries to fill customer
order from his/her own inventory if available. If demand exceeds the inventory, retailer
placed his/her order to wholesaler. And in the same manner the demand and distribution
processes go on through the SCN system of the game till the factory level where beers
produced to meet the demand of distributor. The decision process in each echelon is based
on the actual and desired inventory levels, current and expected demand; and finally, the
desired and real level of items in pipeline.
Sterman; by analyzing the decision methodology of the participants, found out that,
participants; instead of focusing on system delays and nonlinearities, focus on their current
and target inventory levels ignoring the amount of orders placed but not received which
then cause the demand and inventory enlargements that raises upstream from customer to
factory. He also concluded that “anchoring and adjustment” heuristic (which is used for
simulating the demand decision process of each echelon) is inconsequent as this heuristic is
lack of sensibility to delays and repercussions of SCN system or; as to generalize, lack of
“System Thinking” (Sterman 2000). With his simple beer SCN simulation game, he exposed
general characteristics of SCN dynamics and; as Forrester, emphasized on irrational decision
making process (via “misperception of feedback”) which is one of the main causes of and
reason for the rise of BWE.
Forrester’s model also used by Towill (1991, 1992) and Wikner et al.(1991). Using the
Forrester’s model with additional quantitative measures, Towill analyzed the S.C. systems
by applying system dynamics models. System dynamics defined by Towill (1993a, 1993b) as
“A methodology for modeling an redesign of manufacturing, business and similar systems which are
part man, part machine”. He concluded that one of the reasons of demand amplification is
time delays relevant to ‘value added’ or ‘idle’ operations. With an industrial example, he
showed that via integration of decision mechanisms in SCN systems improvement could be
achieved (both for demand amplifications and stock levels through the system). He also
mentioned that this is still the case when MRP II capacity planning is conjoined to JIT flow
shop control.
Supply Chain Management
52
Wikner, Towill and Naim (1991); taking Forrester three echelon model as base, compared
several methods of resolving dynamic performance of distribution systems. Though they
suggested that Forrester’s model is “far from optimal”, they use it to evaluate their proposed
systems. In the study authors tried to gain improvement by;
• eliminating echelons,
• altering decision rules for providing improvement,
• abating delays,
• arranging system ordering parameters and,
• constructing a smooth information flow.
In conclusion, they emphasized on the importance of smooth, better information flow
through the whole chain and reducing delays, as these solutions have dominant impact for
BWE reduction rather than improvement of ordering system.
Later Towill (1993a, 1993b) showed the influence of servo theory and cybernetics on the
system dynamics and via examination he suggested that the input-output analysis is
important for model building in system dynamics.
An important analysis in BWE history is made by Lee et al. in 1997 which than would light
the way to many other studies (including their following studies) specially related to causes,
quantification and also handling tools of the phenomenon (1997a, 1997b, 2002, 2004).
Focusing on the operational causes of the problem and proving the existence by
documentary evidences provided from several companies from different sectors (such as
their well-known cases P&G and Hewlett-Packard), they declared four major causes and
triggers of BWE as i.) demand signal processing (forecast updating), ii.) rationing game, iii.)
order batching, iv.) price fluctuation.
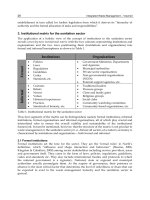
Lee et al. (1997a) after proposing sources of BWE also proposed activities that can be used to
mitigate the impact of these sources as summarized in the following table. Differently from
Sterman and Forrester who generally declared that irrational behaviors of decision makers
in SC is the main reason of BWE; the study of Lee; demonstrated that BWE is an outcome of
the strategic interactions among rational SCN members; i.e., their attitudes inside the SCN
constitution (see Table 1).
Though they are outnumbered relatively to others, researches about quantification of BWE can
be considered as another category in the research area of this phenomenon. In general, most
preferred system for quantifying BWE is computing demand variance or standard deviation
ratios of two subsequent stages of SCN for their ability of easily capturing and displaying the
scale of BWE. But studies that used cost parameters are also attract attention. Among the
studies which tried to quantify BWE Metters’ (1997) and Chen’s (1998, 1999, 2000a, 2000b)
studies are the remarkable ones. From the cost-profit perspective of quality management,
Metters quantified BWE using costs arisen from BWE through the chain. Simulating a two-
staged SCN model, he focused on demand variance, forecast errors and demand seasonality.
Analyzing the model under several circumstances, he showed the effect of BWE on
profitability and demonstrated that profit improvement can be achieved via BWE reduction.
As this study directly shows the monetary impact of BWE on company profitability, it
deservedly captured considerable attention from the managerial point of view.
Chen et al.(1998, 1999, 2000a, 2000b) studied the effects of forecasting, lead times and
information sharing on BWE quantified as a ratio of demand variances of two consequent
stages of simple SCN system. They showed order variances in the upstream echelon will be
amplified if upstream echelons demand decisions are renewed systematically using the
monitored values of predecessor downstream echelons orders periodically and even
A Hybrid Fuzzy Approach to Bullwhip Effect in Supply Chain Networks
53
Causes of
Bullwhip
Information Sharing Channel
Alignment
Operational Efficiency
Demand
Forecast
Update
-Understanding
system dynamics
-Use of point-of-sale
data (POS)
-Electronic data
interchange (EDI)
-Computer-assisted
Ordering (CAO)
-Vendor-managed
inventory (VMI)
-Discount for
information
sharing
-Consumer direct
-Lead time reduction
-Echelon-based inventory
control
Order
Batching
-EDI
-Internet Ordering
-Discount for
truck-load
assortment
-Delivery
appointments
-Consolidating
-Logistic
outsourcing
-Reduction in fixed cost of
ordering by EDI or
electronic commerce
-CAO
Price
Fluctuation
-Continuous
replenishment
program
-Everyday low
cost
-Everyday low price
-Activity-based costing
Shortage
Gaming
-Sharing sales,
capacity and
inventory data
-Allocation based
on past sales
Table 1. A Framework for Supply Chain Coordination Initiatives (Lee, 1997a)
thought the customer demand data is available for all echelons (i.e. centralized demand
information), the forecasting technique and inventory system used is unique in each echelon
through whole chain, the BWE will exist (1998, 2000a). In brief, Chen et al. constructed a two
stage SCN model in which moving average technique is used for analyzing the unknown
demand pattern essential for the inventory system that is operated (i.e. order-up-to policy)
and developed a lower bound (a function of demand correlation, lead time and number of
observations) on order variances placed by retailer concerning customer demand and
developed their findings to multistage models. Despite the drawbacks described above and
model simplicity, the study of Chen et al. introduced same executive overlook to quantified
BWE adducing the effects of forecasting.
Later authors analyzed the effects of exponential smoothing forecasting technique on BWE
for i.d.d. and linear trend demand cases (2000b). The study was very similar to their
previous one. This time, the forecasting method used to predict the future demand of
customer by the retailer was exponential smoothing. As a result of their study, they
conclude following managerial insights:
• the size of demand variability directly influenced from the forecasting technique used
to predict future demand variances and from the form of the demand pattern,
• BWE occurs when retailer updates the order-up-to point according to the periodically
computed forecast values,
• The longer the lead time greater the demand variability,
• Smothering the demand forecast with more demand information will decrease BWE.
Supply Chain Management
54
Gavirneni et al. (1999), Cachon et al. (2000), Kefeng et al.(2001) are the others who looked at
the problem from the point of information sharing and its value. Gavirneni et al. betrayed
the importance of information sharing in inventory control using, uniform and exponential
demand patterns. Cachon and Fisher examining a simple SCN with two stages and
stochastic stationary demand, compared the value of information sharing between the case
in which only demand information available and the case in which both demand and
inventory information are available. Their research results from their model showed that
there is no remarkable difference between the analyzed cases. Later in his study of US
industrial level data in 2005, Cachon et al. absorbed that; contrary to general understanding
of BWE, demand variability does not always increase as one move up though the stages of
SCN because of production smoothing attitude of manufacturers arisen from marginal costs
and seasonality. Kefeng et al. analytically examined the improvement of coordination and
appropriate forecasting in SCN. They presented their results for non-stationary, serially
correlated demand and stationary one-lag demand before and after collaboration. The
outcomes of the study showed that even under non-trendy and non-seasonal demand BWE
exists and also the adaptation of forecasting method to the demand pattern and information
sharing notably reduces BWE. So, they keynoted the importance of effective communication
between the stages of SCN and consistent forecasting.
Kimbrough et al. (2002) looked thorough to SCN and BWE from a different perspective.
They analyzed effectiveness of artificial agents in a beer game simulation model and
investigated their ability of mitigating BWE through the system. They found out that agents
have the effective ability of playing beer game. The study exposed that agents are capable
of finding optimal policies (if there exists) or good policies (where analytical solutions are
not available) that eliminates BWE tracking demand pattern under the assumptions of the
model. Kimbrought and his coauthors study was important as it brought a different
perfective to the solution of the problem from the point of computer aided decision models
such as artificial intelligence and NF systems.
Towill, with other researchers such as Disney, Dejonckheere and Geary, have made several
more important studies from the control theory approach (CTA) related to BWE which also
are served as basis to many other researches (Towill et al. 2003; Dejonkheere et al. 2002,
2003, 2004; Disney et al. 2003a, 2003b, 2004, 2006).
From 2003 up till recent years other than Towill’s, Dejonkheere’s, Disney’s and Geary’s
studies there is a remarkable increase in the research of BWE. Among these most
considerable ones can be summarized as follow.
Aviv (2003), Alwan et al. (2003), So et al. (2003), Zhang (2004), and Liu et al. (2007) analyzed
the phenomenon using stationary demand modeling the process as an ARMA type.
Modeling demand as first order ARMA process, Aviv performed an adaptive replenishment
policy, Alwan et al., Zhang and Liu et al. analyzed the forecasting procedures displaying the
effects of moving average (MA), exponentially weighted moving average (EWMA) and
minimum mean squared error (MMSE) forecasting models and, So et al. focused on lead
times in a simple two phased model. Later Zhang (2005); again modeling customer demand
as first order AR (i.e., AR(1)) process and using MMSE forecasting model, showed that
delayed demand information reduces BWE.
Machuca et al. (2004) and Wu et al. (2005) studied on the effects of information sharing to
BWE. Machuca et al. focused on the usage of EDI in SCN systems. A simple definition of
EDI is given by The American Standards Institute as “the transmission, in a standard syntax,
of unambiguous information of business or strategic significance between computers of
A Hybrid Fuzzy Approach to Bullwhip Effect in Supply Chain Networks
55
independent organizations”. As the smooth, correct and on-time information sharing is
essential for SCN systems, usage of EDI provides rapid inter-organization coordination
standardizing electronic communication (i.e., exchange of routine business data computer to
computer), lead time reduction reducing the clerical process and reduction in the inventory
costs due to the improvement of trading partner relationship, expedited supply cycle and
enhanced inter-organizational relationship. Based on the idea that usage of EDI reduces the
information delays, Machuca et al. analyzed the SCN system both as a whole and for
individual echelons and showed that a reduction in BWE and related cost (especially costs
driven by inventory) can be achieved with the usage of EDI, thought it did not completely
eliminate the BWE in SCN systems.
Wu et al. (2005) used the beer game and analyzed the phenomenon from information
sharing together with organizational learning perspective. Thought the study looked at the
problem only in managerial view, the outcomes displayed that when organizational training
and learning combined and coordinated thought data sharing and communication
reduction in order oscillation could be achieved.
Makui et al. (2007) used a well known mathematical term; the Lyapunov exponent in their
study and quantified BWE in terms of this exponent and; differently from the study of Boute
et al. (2007) that importance of lead times in order smoothing, expressed the negative effect
of lead times in terms of LPE. Based on the Chen et al.’s (1998) work, Makui et al. quantified
and measured BWE for centralized and decentralized information cases in a two echelon
SCN model and exposed the results with a simple numerical example. Authors’ stated that
the Lyapunov exponent; which may use for quantification of the irregularities of non-linear
system dynamics, may also be use for quantifying BWE if LPE is sensed as a factor for
expanding an error term of a system.
Like Makui et al. (2007) Hwarng et.al (2008) also used Lyapunov exponents in his work for
quantify system chaos in SCNs and similar to BWE discovered the “chaos-amplification”. The
study; different from the previous recognized acknowledgment that points the main cause of
system variability as the external unpredictable conditions, showed that exogenous factors
such as demand together with related endogenous factors such as lead times and information
flow may also generate chaotic behavior in SCN system. Based on this findings, Hwarng
concluded that for effective management in chaotic SCN systems, the interactions between
exogenous and endogenous factors have to be understood as well as the effects of various SCN
factors on the system behavior for reducing system chaos and inventory variability.
Sohn et al. (2008), Wright et al. (2008), Saeed (2008), Sucky (2009) and Reiner et al. (2009) are
the other researches who investigated mainly the effects of forecasting on BWE in their
researches. Sohn et al.; using Monte Carlo simulation that simulates various conditions of
market environment in SCN, aimed to suggest the appropriate information sharing policy
together with appropriate forecasting method for multi-generation products of high-tech
industry via which, customer satisfaction and net profit would be maximized considering
the factors such as seasonality, supplier’s capacity and price sensitivity of multi-generation
products. Thought the study does not directly related to BWE, the research area and finding
set a light to forecasting methods appropriate for specific information policies in SCNs for
the cases such as the environmental factors like seasonality and price sensitivity exists.
Wright et al. (2008) expanded Stermans model and investigated BWE under different
ordering policies and forecasting methods (Hold’s and Brown’s Method) separately and in
combination. Based on the results Wright concluded that, forecasts which are made in