Energy Technology and Management Part 2 potx
Bạn đang xem bản rút gọn của tài liệu. Xem và tải ngay bản đầy đủ của tài liệu tại đây (808.69 KB, 20 trang )
Centralizing the Power Saving Mode for 802.11 Infrastructure Networks 9
Distribution Pr
0
α = 1 α = 2 α = 3 α = 4 α = 5
DET 0 0 0 0 0
UNI 0.5 0 0 0 0
EXP 0.3679 0.1353 0.0498 0.0183 0.0067
PAR (k=1/3) 0.2963 0.0787 0.0315 0.0156 0.0089
Table 3. Empty probability vs. scaling factor under different traffic distributions.
number of simultaneous wake-ups. Since γ
j
s are integers, we can compute the least common
multiple (LCM) for all the elements of each Γ
∗
candidate. Note that the LCM gives the minimal
number of BIs for which two or more clients wake up simultaneously. Therefore, a larger LCM
means a smaller number of simultaneous wake-ups. We therefore choose the best Γ based on
the largest LCM and denote it as Γ
∗
i
.
In the second sub-step, given (β
i
, Γ
∗
i
), i = 1, ,n + 1, we select the best Γ from the Γ
∗
i
s
that minimizes simultaneous wake-up. The criterion is based on the largest spread of their
elements from one another which is measured by the ratio of the standard deviation and the
mean of the elements in Γ
∗
i
. Therefore, Γ
∗
is given by the Γ
∗
i
that gives the highest ratio, and
β
∗
is the corresponding β
i
.
Step 3 (Determining Θ
∗
) The final step determines Θ
∗
based on the Γ
∗
obtained in the last step.
The motivation is to mitigate the possible unfairness in the frame buffering delay experienced
by the clients. We assign a smaller θ
∗
j
to the client with a larger γ
∗
j
. In this way, the client
that wakes up less frequently will have a higher priority to retrieve its frames during channel
contention. To do so, we assign the default value to s
j
if its γ
∗
j
is the largest (i.e. θ
∗
j
= 31).
We then increase other clients’ θ
j
by
Θ
when their γ
∗
j
decrease. They are given by θ
∗
j
=
31 +
Θ
(max
∀j
(γ
∗
j
) − γ
∗
j
).
5.2 The optimal wake-up schedule
Besides the main algorithm, the AP in C-PSM may also obtain the optimal wake-up schedule
(WS). This optional step is to schedule the first wake-up times of the clients, so that the
maximal number of waking clients at one BI epoch is minimized. The optimization problem
is given by
min
r
: max
ν=0,1,2,
N(ν, r, Γ
∗
). (3)
The vector r presents the sequence of the first wake-up times where the client s
j
first wakes
up at the r
j
th BI epoch and r
j
∈ [0, LCM(Γ
∗
) − 1] is an integer. The function N(ν, r, Γ
∗
) is
the number of waking clients at the νth BI epoch when the clients wake up according to r
and LI
∗
. WS consists of the optimal solution denoted as r
∗
which will further decrease the
simultaneous wake-ups if two or more elements of Γ
∗
are the same or have the same common
factor.
Since the optimization problem (3) can be decomposed into a series of wake-up scheduling
problems (WSPs) (Lin et al., 2006), we solve it by developing an algorithm based on the
stepwise solving method for WSP.
When a new PSM-enabled client s
j
joins an infrastructure network (including a set of m clients,
S)intheνth BI epoch, WSP is formulated to minimize the maximal number of wake-up clients
11
Centralizing the Power Saving Mode for 802.11 Infrastructure Networks
10 Will-be-set-by-IN-TECH
in the following BI epoches. The optimization problem of WSP is given by
min
k
j
(ν)
: max
u=1,2,
{N(ν + u)} (4)
where N
(ν + u) is the number of waking clients at the (ν + u)th BI epoch and the wake-up
counter k
j
(ν) records the remaining BIs that the client s
j
will wake up. Moreover, N(ν + u)
equals to
∑
i∈S∪j
w
i
(ν + u) where the wake-up indicator w
i
(ν + u) is 1 if s
i
wakes up at the
(ν
+ u)th BI epoch; otherwise, it is 0. Given the LI parameter of each client γ
i
,0≤ k
i
(ν) ≤
γ
i
− 1, i ∈S∪j, the stepwise solving method (Lin et al., 2006) can calculate k
∗
j
(ν), the optimal
wake-up counter of s
j
. And k
∗
j
(ν) is a function f (j, γ
j
, m, w
i
(ν), k
i
(ν), γ
i
), i = 1, . . . , m.Itis
easy to see that k
∗
j
(ν) is the optimal first wake-up time of s
j
when ν = 0, i.e. r
∗
j
= k
∗
j
(0).
According to Γ
∗
, our algorithm obtains k
∗
j
(0) for each client at ν = 0. Therefore, we determines
WS as r
∗
=[k
∗
1
(0), ,k
∗
c
(0)]. The client s
j
first wakes up optimally at the r
∗
j
th BI epoch,
∀j = 1, . . . , c. For example, if r
∗
j
= 1, s
j
will miss the first beacon frame at the beginning
of simulation but wake up for the first time after β
∗
. The detail steps of our algorithm for
obtaining r
∗
is given below:
1. Initialize the following variables: ν
= 0, S = {s
1
}, m = 1, w
1
(ν)=1, k
1
(ν)=0, r
∗
1
= 0
and j
= 2.
2. If j
> c, return r
∗
and exit; else, go to step 3.
3. Find the optimal wake up time of s
j
, where
k
∗
j
(ν)=f (j, γ
∗
j
, m, w
i
(ν), k
i
(ν), γ
∗
i
), i = 1, . . . , m.
4. Update variables: r
∗
j
= k
∗
j
(ν), m = m + 1 and S = S∪s
j
.
5. If r
∗
j
= 0, then w
j
(ν)=1; else, w
j
(ν)=0.
6. Increase j by 1 and go back to step 2.
6. Performance evaluation
We evaluate the performance of C-PSM and compare it with the PSM with default parameters
(which is referred to as standard PSM or S-PSM). We do not compare C-PSM with other
user-centric/AP-centric PSM schemes, because the design objectives and the study scopes
are different. For example, C-PSM improves energy efficiency for all clients, whereas the
user-centric PSM schemes consider only a single client. On the other hand, C-PSM is
standard-compliant, but most AP-centric schemes are not compatible with the PSM scheme.
6.1 Evaluation methodology
In order to evaluate the effectiveness of different components of C-PSM, we examine three
different versions. The first one is a “full version” which includes the optional optimal
wake-up sequence discussed in the last section. The other two, Scheme-1 and Scheme-2, on
the other hand, exclude this option and adopt the default congestion window size. Moreover,
Scheme-2 adopts the default Γ value. To sum up, we compare the following schemes in
reference to S-PSM.
1. C-PSM: β
∗
, Γ
∗
, Θ
∗
, r
∗
;
12
Energy Technology and Management
Centralizing the Power Saving Mode for 802.11 Infrastructure Networks 11
2. Scheme-1: β
∗
, Γ
∗
, θ
j
= 31, r
j
= 0;
3. Scheme-2: β
∗
, γ
j
= 1, θ
j
= 31, r
j
= 0;
4. S-PSM: β
= 100ms, γ
j
= 1, θ
j
= 31, r
j
= 0.
We use the following four performance indices for comparing C-PSM, Scheme-1, and
Scheme-2 against S-PSM: power saving (index η
P
), throughput (index η
T
), energy efficiency
(index η
T/P
), and frame buffering delay (index η
D
). The notations with a superscript S − PSM
refers to S-PSM, whereas that without refer to C-PSM, Scheme-1, or Scheme-2. For easy
comparison, a positive value indicates improvement over S-PSM.
η
P
=(P
S−PS M
− P)/P
S−PS M
× 100%,
η
T
=(T − T
S−PS M
)/T
S−PS M
× 100%,
η
T/P
=(R
T/P
− R
S−PS M
T/P
)/R
S−PS M
T/P
× 100%,
η
D
=
1
c
×
c
∑
j=1
(d
S−PS M
j
− d
j
)/d
S−PS M
j
× 100%.
6.2 Two clients
We first evaluate C-PSM in the two-client system. Given Δ =[15; 25]ms, the AP obtains the
optimal parameters of C-PSM under different traffic distributions, as shown in Table 4.
Δ(ms) distribution β
∗
(ms) Γ
∗
Θ
∗
r
∗
[15;25] DET 10 [2;3] [39;31] [0;0]
UNI 26 [1;2] [39;31] [0;0]
EXP,PAR 38 [1;2] [39;31] [0;0]
[20;30;30] DET 16 [1;2;2] [39;31;31] [0;0;1]
UNI 30 [1;2;2] [39;31;31] [0;0;1]
EXP,PAR 46 [1;2;2] [39;31;31] [0;0;1]
Table 4. Optimal parameters of C-PSM (
β
= 2ms and
Θ
= 8).
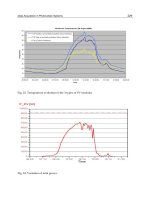
(a) Total power, P. (b) Total energy efficiency, R
T/P
.
Fig. 3. A comparison of the four PSM schemes with Δ =[15; 25]ms.
13
Centralizing the Power Saving Mode for 802.11 Infrastructure Networks
12 Will-be-set-by-IN-TECH
Figure 3 depicts that C-PSM outperforms S-PSM on saving energy and improving energy
efficiency under different distributions. C-PSM achieves lowest P and highest R
T/P
among
the four schemes. Scheme-1 performs a little worse than C-PSM, since it does not adopt Θ
∗
.
Comparing with scheme-1, scheme-2 increases power and decreases energy efficiency, since it
does not use Γ
∗
. Adopting β
∗
, Scheme-2 still outperforms S-PSM under all traffic distributions
except the DET distribution. Scheme-2 is the worst under deterministic traffic, because two
clients wake up every β
∗
= 10ms and they both waste energy on the frequent unnecessary
wake-ups. Note that, the WS is not adopted, since r
∗
is a zero vector when γ
j
(∀j) are relative
prime. In this case, all clients wake up at the beginning of simulation.
index, % scheme DET UNI EXP PAR
η
P
C-PSM 25.41 28.75 29.73 28.13
Scheme-1 24.91 27.28 27.53 26.47
Scheme-2 -20.82 17.52 21.10 16.48
η
T/P
C-PSM 34.63 41.18 43.01 39.76
Scheme-1 33.71 38.33 38.65 36.57
Scheme-2 -16.88 21.95 27.38 20.30
η
D
C-PSM 82.33 68.79 54.80 54.18
Scheme-1 82.08 68.15 53.07 53.56
Scheme-2 94.54 79.79 69.88 68.75
η
T
C-PSM 0.41 0.59 0.50 0.45
Scheme-1 0.40 0.60 0.48 0.42
Scheme-2 0.43 0.58 0.50 0.47
Table 5. Indices of C-PSM, Scheme-1 and Scheme-2, Δ =[15; 25]ms.
As shown in Table 5, all indices of C-PSM are positive and the improvements of C-PSM over
S-PSM are significant under different distributions. For example, compared with S-PSM,
C-PSM reduces power consumption by 29.37%, improves energy efficiency by 43.01% and
reduces average buffering delay by 54.8% under the EXP distribution of traffic. We also find
that C-PSM has largest η
P
and η
T/P
. That is, C-PSM which employs β
∗
, Γ
∗
and Θ
∗
together,
performs the best in saving power and increasing energy efficiency.
In C-PSM, the benefit of adopting β
∗
and Γ
∗
is significant whereas the improvement due to Θ
∗
is minor. Scheme-1 using β
∗
and Γ
∗
has obtained large positive indices. Its indices are slightly
less than C-PSM’s indices. For example, the energy efficiency is improved by 38% while the
η
T/P
of C-PSM is 43.01%. Therefore, the usage of Θ
∗
is helpful to save energy but not much.
Moreover, β
∗
and Γ
∗
jointly play the major roles in improving PSM performance. In contrast,
the PSM performance greatly degrades without using Γ
∗
. The η
P
and η
T/P
of Scheme-2 are
much smaller than the ones of C-PSM and Scheme-1. Scheme-2 therefore is worse than these
two schemes. It is even worse than S-PSM, because of its negative indices under the DET
distribution of traffic.
Next, we compare C-PSM and S-PSM under the EXP distribution of traffic. As shown in
Figure 4(a), the AP buffering delay is shortest in C-PSM, whereas it is longest in S-PSM.
Consequently, the clients using C-PSM can return to sleep mode earlier, because the frames
with shorter buffering delay are retrieved faster than those in S-PSM. Moreover, C-PSM
improves the fairness of clients, since it greatly decreases the delay difference of the two
clients. C-PSM speeds up the retrieval of frames in the fast client, because the delay of s
1
is one sixth of that in S-PSM. At the same time, it does not degrade the slow client, since the
14
Energy Technology and Management
Centralizing the Power Saving Mode for 802.11 Infrastructure Networks 13
(a) The AP buffering delay. (b) The ratios of unnecessary wake-ups and
simultaneous wake-ups.
(c) The collision ratios.
Fig. 4. A comparison of the four schemes under the EXP distribution with Δ =[15; 25]ms.
delay of s
2
reduces a little. Figure 4(b) shows that C-PSM greatly reduces the chances that two
clients simultaneously wake up to compete for channel, since its R
bB/B,2
is lowest. In contrast,
S-PSM lets two clients wake up simultaneously at a large proportion of BI epochs, since its
R
bB/B,2
is near 1. The clients using C-PSM spend less time on channel contention, consume
less energy on idle mode and then achieve higher energy efficiency.
Figure 4 illustrates that C-PSM and Scheme-1 have similar performance metrics. The collision
ratios of PS-Poll and data frames in C-PSM are less than those in Scheme-1. It means that Θ
∗
is useful for reducing channel collisions. That is why C-PSM performs better than Scheme-1
with slightly higher indices.
Scheme-2 outperforms S-PSM under the EXP distribution of traffic, since it achieves shorter
AP buffering delay and less simultaneous wake-up ratio than S-PSM. Scheme-2 is less
energy-efficient than C-PSM and Scheme-1, because it spends more energy on unnecessary
wake-ups and channel contention. The clients in Scheme-1 frequently wake up every β
∗
but
nearly 20% of wake-ups are unnecessary while the unnecessary wake-ups ratio is less than
10% in C-PSM. Without using Γ
∗
, the clients in Scheme-2 spend more energy on idle mode
15
Centralizing the Power Saving Mode for 802.11 Infrastructure Networks
14 Will-be-set-by-IN-TECH
when they simultaneously wake up to compete channel with a higher probability. Shown in
Figure 4(b), they are involved in channel contention at 68% of BIs, i.e. R
bB/B,2
= 68% while
the R
bB/B,2
in C-PSM is only 40%. Furthermore, the collision ratios in Scheme-2 are higher
than those in C-PSM and Scheme-1, shown in Figure 4(c). For example, the PS-Poll collision
ratio in Scheme-2 is the highest, nearly 1.5 times of that in C-PSM. Therefore, the clients in
Scheme-2 have to spend more energy to handle the collisions. On the other hand, Scheme-2
has shorter delay for the slow client s
2
than C-PSM and Scheme-2. However, its benefit is too
small to affect the performance.
Additionally, the collision ratios of ACK are almost zero in Figure 4(c). The reason is that an
awaken client always returns ACK after it has finished receiving a data frame and a SIFS has
elapsed. The channel is rarely occupied by the other client or the AP within such a short SIFS.
Therefore, ACKs rarely suffer from collisions especially when c
= 2. If the number of clients
increases, the probability of ACK collisions will increase as the channel contention intensifies.
6.3 More than two clients
We have applied C-PSM to a network with more than two clients. Firstly, we evaluate C-PSM
when the number of clients is 3 and two clients have the same mean of inter-frame arrival
times. According to Δ
=[20; 30; 30] where ρ = 13.18% < 30%, the main algorithm obtains the
optimal parameters of C-PSM, also shown in Table 4. Note that when the elements of Γ
∗
are
not relative prime numbers or even the same, C-PSM must adopt WS. In this case, γ
∗
2
and γ
∗
3
have a greatest common divisor 2, and then C-PSM uses WS, i.e., r
∗
=[0; 0; 1]. s
1
and s
2
wake
up at the beginning of simulation while s
3
defers the first wake-up time for one BI.
index, % scheme DET UNI EXP PAR
η
P
C-PSM 36.38 39.08 36.78 36.31
C-PSM not WS 29.00 30.08 26.43 27.33
η
T/P
C-PSM 59.86 65.92 59.11 58.00
C-PSM not WS 43.22 44.56 36.73 38.41
η
D
C-PSM 84.00 68.69 52.16 51.98
C-PSM not WS 81.80 64.62 45.23 46.37
η
T
C-PSM 1.71 1.08 0.60 0.63
C-PSM not WS 1.69 1.07 0.59 0.58
Table 6. Indices of C-PSM with/without WS, Δ =[20; 30; 30]ms.
The positive indices in Table 6 show that C-PSM outperforms S-PSM in terms of power saving,
energy efficiency and AP buffering delay while keeping or slightly increasing throughput
in the three-client network. For example, C-PSM reduces power consumption by 36.78%,
improves the energy efficiency by 59.11% and shortens the average buffering delay by 52.16%
under the EXP distribution of traffic while total throughput remains almost the same. On the
other hand, the indices of C-PSM without WS are less than the ones of C-PSM under all traffic
distributions. For example, without using WS, the η
T/P
Of C-PSM is decreased at most by
22% under the EXP distribution of traffic. Therefore, WS is much helpful to improve energy
efficiency when the symmetric clients exist.
Next, we compare the simulation results of C-PSM, C-PSM without WS and S-PSM to explain
the above findings. As an example, we study these three schemes under the EXP distribution
of traffic.
16
Energy Technology and Management
Centralizing the Power Saving Mode for 802.11 Infrastructure Networks 15
metrics C-PSM C-PSM not WS S-PSM
P (Watt) 0.8242 0.9591 1.3037
T (10
5
bps) 4.7538 4.7536 4.7257
R
T/P
(10
5
bpJ) 5.7675 4.9563 3.6248
d
1
(ms) 34.4 36.3 234.2
d
2
(ms) 55.8 63.2 84.5
d
3
(ms) 54.9 64.7 87.4
R
c/t
1.44% 1.78% 2.14%
R
u/w
10.06% 10.66% 4.86%
R
bB/B,2
83.83% 10.47% 7.64%
R
bB/B,3
0 39.05% 92.29%
Table 7. A comparison of three schemes under the EXP distribution with Δ =[20; 30; 30]ms.
C-PSM saves energy by shortening the period of channel contention, shown in Table 7. All the
clients’ frame buffering delays of C-PSM are smaller than those of other two schemes. That
is, each client can receive its buffered frames most quickly and then enter to sleep instead of
spending much energy and time on idle mode during channel contention. C-PSM also saves
energy by reducing channel contentions. It totally avoids all-client simultaneous wake-ups
and R
bB/B,3
is zero. On the other hand, in S-PSM, three clients wake up together to receive data
in almost all BIs and R
bB/B,3
is as high as 92.29%. At the same time, C-PSM consumes a small
amount of energy on unnecessary wake-ups, since the total ratio of unnecessary wake-ups
R
u/w
is near 10%. It also decreases the channel collisions where the total ratio of collisions
R
c/t
is reduced by about one-third. From what has been discussed above, C-PSM outperforms
S-PSM.
C-PSM without WS obviously outperforms S-PSM but is worse than C-PSM. Without using
WS, the total power increases, the total energy efficiency decreases and three awaken clients
compete for receiving data in 39.05% of BIs. However, C-PSM can totally avoid the situation
of all-client simultaneous wake-ups. On the other hand, the R
bB/B,2
in the C-PSM without
WS is smaller than the one in C-PSM. It is helpful to save energy but does not determine the
energy consumption of all clients. The reason is that more energy is consumed on channel
contention when all of three clients wake up simultaneously. In a global view, C-PSM saves
more energy and achieves higher energy efficiency after using r
∗
. Therefore, WS is helpful to
improve energy efficiency, because the number of clients which wake up at the same beacon
epoch has been minimized.
Furthermore, we find that C-PSM is applicable for a large scale network and saves more
energy when the number of clients increases. These two sets of simulations evaluate the
performance of our scheme when the number of PSM-enabled clients increases up to 20.
In the first set of simulations, we let δ
j
= 10c(ms), j = 1, ,c. The total amount of traffic
of all symmetric clients will not change with c, and the total arrival rate of frames λ always
equals 100 frames per second. The traffic workload is light, when ρ
= 11.3% < 30%. Under
light traffic, S-PSM can save energy, since the average power of each client is always lower
than its idle power. For example in Figure 5, P
S−PS M
is much less than the c times of client’s
idle power under the EXP distribution of traffic. C-PSM scheme can further reduce energy
consumption, since the power difference between P
S−PS M
and P
C−PS M
is always larger than
zero. Moreover, this power difference increases with c. Therefore, C-PSM saves more energy
when the number of clients increases.
17
Centralizing the Power Saving Mode for 802.11 Infrastructure Networks
16 Will-be-set-by-IN-TECH
Fig. 5. Total power verses c under the EXP distribution with δ
j
= 10c(ms).
Index,% T
j
c=2 c=4 c=8 c=12 c=16 c=20
η
P
DET 22.30 63.75 79.20 71.54 75.52 72.98
UNI 45.37 72.52 78.82 70.58 71.74 72.22
EXP 51.09 70.33 76.07 70.98 72.27 72.14
PAR 50.76 70.43 76.68 69.77 70.91 70.33
η
R
T/P
DET 29.07 177.76 396.05 263.65 325.31 286.14
UNI 83.50 265.28 384.96 251.95 270.96 281.65
EXP 105.04 238.69 327.07 257.23 277.64 281.02
PAR 103.89 239.39 338.50 241.89 260.80 255.76
η
D
DET 92.35 87.63 85.78 87.47 90.18 89.21
UNI 73.94 70.37 84.07 85.57 87.28 88.11
EXP 64.09 70.89 82.68 85.02 87.04 88.43
PAR 62.93 69.48 82.25 85.78 87.10 88.19
η
T
DET 0.29 0.70 3.17 3.51 4.10 4.32
UNI 0.24 0.40 2.72 3.55 4.83 6.02
EXP 0.29 0.48 2.19 3.68 4.73 6.14
PAR 0.40 0.37 2.27 3.36 4.94 5.55
Table 8. The indices of C-PSM verses the number of clients when δ
j
= 10c(ms), j = 1, ,c.
Table 8 has shown that C-PSM achieves significant improvements of four main metrics in a
large network. For example, the indices of η
P
, η
T/P
and η
D
in are as high as 76.07%, 327.07%
and 82.68% individually when c
= 8 under the EXP distribution of traffic. C-PSM scheme also
improves clients’ throughput in a large network, since η
T
increases slightly with the number
of clients.
In the second set of simulations, we let δ
j
= 10 + 5j(ms), j = 1, ,c. The total packet arrival
rate λ increases with the number of clients where ρ increases from 13.18% to 49.51%. When
c
≥ 8, the traffic is not light any more, since ρ ≥ 32%.
We firstly find that C-PSM has a wider applicability than the standard PSM. It is effective
to save energy when the network supports many clients whose workload is not light. For
18
Energy Technology and Management
Centralizing the Power Saving Mode for 802.11 Infrastructure Networks 17
Fig. 6. Total power verses c under the EXP distribution with δ
j
= 10 + 5j(ms), j = 1, . . . , c.
example in Figure 6 under the EXP distribution of traffic, P
S−PS M
is much close to the total
power of c idle clients, when c
≥ 8. It is obvious that these clients are too busy to sleep
and S-PSM cannot save much energy. After using C-PSM, P
C−PS M
is much less than the
total power of c idle clients even when c increases to 20. That is, C-PSM is still effective to
save energy even when the network workload is as high as ρ
≈ 50%. Moreover, C-PSM
saves more energy when the number of clients increases, since that the power difference
P
S−PS M
− P
C−PS M
increases with c. Although not shown here, the similar simulation results
are obtained under other traffic distributions.
Index,% T
j
c=2 c=4 c=8 c=12 c=16 c=20
η
P
DET 1.01 29.04 42.17 44.31 51.49 52.71
UNI 21.93 37.81 44.29 37.34 51.98 50.97
EXP 28.98 39.73 44.20 36.01 49.44 43.89
PAR 25.64 37.59 44.19 35.65 48.85 43.49
η
R
T/P
DET 0.55 55.54 132.72 174.52 248.45 286.48
UNI 28.79 76.14 138.29 137.83 245.38 255.72
EXP 41.51 75.73 124.41 115.23 201.97 172.88
PAR 35.07 71.90 126.80 114.65 203.60 173.49
η
D
DET 96.60 94.98 95.59 93.39 94.00 91.36
UNI 76.05 79.90 85.27 85.56 86.88 85.72
EXP 66.12 69.74 77.41 77.21 79.52 76.21
PAR 65.05 69.82 77.69 77.10 79.66 76.30
η
T
DET 0.45 10.38 34.58 52.88 69.04 82.76
UNI 0.55 9.54 32.75 49.03 65.84 74.41
EXP 0.49 5.91 25.23 37.74 52.68 53.12
PAR 0.43 7.29 26.58 38.13 55.28 54.56
Table 9. The indices of C-PSM verses the number of clients when δ
j
= 10 + 5j(ms),
j
= 1, . . . , c.
19
Centralizing the Power Saving Mode for 802.11 Infrastructure Networks
18 Will-be-set-by-IN-TECH
Table 9 also shows that C-PSM scheme outperforms S-PSM on saving power, improving
energy efficiency, shortening delay and increasing throughput. When the traffic is not light
(i.e. c
≥ 8), C-PSM improves energy efficiency a lot, since it not only reduces power
consumption but also increases throughput greatly. For example, compared with S-PSM,
C-PSM saves 49.44% of power, increases 52.68% of throughput and then finally achieves
201.97% higher energy efficiency in the sixteen-client system under the EXP distribution of
traffic.
6.4 Effects of power consumption model on C-PSM
The power profile of wireless device has a great impact on the performance of energy-saving
scheme using sleeping (Nedevschi et al., 2008). This profile includes the power consumption
of client in transmission, reception, idle mode, sleeping mode and mode transition (when
the client wakes up from sleeping mode to active mode), as well as the wake-up time.
Additionally, the energy consumed on client’s wake-up is the product of wake-up power
3
and wake-up time. The set of these above parameters are defined as a power consumption
model in this chapter.
We adopt model
A (Feeney & Nilsson, 2001; Margi, 2006) in our simulator, which
is widely used. Model
A is comparable to the hardware characteristics of many
popular wireless interface cards. The ratio of transmission power to reception power
in model
A is approximately 160% which is similar to the ratioes of ORiNOCO
11a/b/g ComboCard (Proxim Wireless Corporation, 2006a), ORiNOCO 11a/b/g PCI
card (Proxim Wireless Corporation, 2006b), CISCO AIRONET 802.11A/B/G Wireless Cardbus
adapter (Cisco Systems, Inc., 2004), CISCO AIRONET 350 Series Wireless LAN Client
Adapters (Cisco Systems, Inc., 2005) and Aironet’s PC4800 PCMCIA NIC (Ebert et al., 2002).
The reception power is near to the idle power in model
A which is the same in CISCO
AIRONET 802.11A/B/G Wireless Cardbus adapter (Cisco Systems, Inc., 2004) and Aironet’s
PC4800 PCMCIA NIC (Ebert et al., 2002). Moreover, the sleep power is about an order
of magnitude lower than the idle power in model
A. The ratio of idle power to sleep
power denoted as R
I/S
equals to 1167% which is common in many popular wireless network
interface cards.
State model A model B model C model D model E
Transmission power 1.4W 1.65W 0.75W 1.3W 0.85W
Reception power 0.9W 1.4W 0.75W 0.95W 0.85W
Idle power 0.7W 1.15W 0.75W 0.79W 0.85W
Sleeping power 0.06W 0.045W 0.05W 0.17W 0.005W
R
I/S
1167% 2556% 1500% 468% 17000%
Wake-up power 0.7*2W 1.15*2W 0.75W 0.51W 0.85*2W
Wake-up Time 2ms 2ms 2ms 13ms 2ms
Wake-up Energy 0.003J 0.005J 0.0015J 0.0066J 0.0034J
Table 10. Five power consumption models.
Next, we compare model
A with other power consumption models model B (Jung & Vaidya,
2002; Simunic et al., 2000), model
C (Anastasi et al., 2007; Krashinsky & Balakrishnan, 2005),
model
D (Jeong et al., 2004) and model E(C-Guys, Inc., 2004) listed in Table 10. In order to study
3
During the mode transition, the client’s power consumption is near or higher than transmission
power (Stemm & Katz, 1997). It could be estimated as two times of idle power (Jung & Vaidya, 2002),
for example the models
A, B and E.
20
Energy Technology and Management
Centralizing the Power Saving Mode for 802.11 Infrastructure Networks 19
the effects of power consumption model on the performance of C-PSM, we deploy S-PSM and
C-PSM in the two-client network (Δ
=[15; 25]ms) (shown in section 4) under the five different
power consumption models.
The improvements of C-PSM over S-PSM mainly depend on the wake-up energy consumption
and R
I/S
. Comparing the power saving index η
P
and the energy efficiency index η
R
T/P
in
Table 11, C-PSM outperforms S-PSM greatly with the highest indices in model
C, since the
wake-up energy consumption is minimal and R
I/S
is as high as 1500%. Model C and model A
has the similar R
I/S
over 1000%, the indices of η
P
and η
R
T/P
decrease with the wake-up energy
consumption. When the energy consumption is the same like model
A and model E, the indices
increase with R
I/S
. That is, the advantages of C-PSM over S-PSM is more outstanding when
the wake-up energy consumption decreases and R
I/S
increases. Model D achieves the worst
performance, since it has the maximal wake-up energy consumption and the lowest R
I/S
.
For example, C-PSM is worse than S-PSM with negative indices under the DET distribution.
Therefore, C-PSM is not efficient when clients consume much energy on waking up or the
sleeping power is close to the idle power.
Index T
j
A B C D E
η
P
DET 26.16 30.86 46.46 -4.86 38.44
UNI 27.72 32.32 42.12 5.65 38.73
EXP 28.99 33.72 39.63 12.69 39.58
PAR 29.56 34.37 40.31 13.02 40.30
η
R
T/P
DET 36.25 45.52 87.91 -4.05 63.44
UNI 39.01 48.46 73.58 6.48 63.98
EXP 41.29 51.37 66.17 14.91 66.04
PAR 42.30 52.71 67.93 15.24 67.91
Table 11. Indices of C-PSM in different power consumption models when c = 2, Δ =[15; 25].
7. Conclusions and future works
We propose the centralized PSM (C-PSM) to increase the energy efficiency of all wireless
clients in an infrastructure wireless network. C-PSM is traffic-aware and inherits the
operations of standard PSM except for using optimal parameters. According to the traffic
characteristics, C-PSM instructs the AP to compute the optimal beacon interval, optimal
listen intervals, optimal minimal congestion windows and optimal sequence of first wake-up
times. C-PSM achieves the significant improvements over standard PSM because (1) the
jointly optimized intervals can reduce unnecessary wake-ups and channel contentions which
collectively translate into the energy saving and reduction in the buffering delay; (2) the
optimal minimal congestion windows are effective to balance the delay among clients; and
(3) the first wake-up times reduce the simultaneous wake-ups to alleviate channel contention.
Moreover, C-PSM has a wider applicability than S-PSM. It is effective even when the workload
of the network is not light. The improvements of C-PSM over S-PSM increases when the
number of clients increases, the wake-up energy consumption decreases or the ratio of idle
power to sleep power increases. In future works, we will further improve optimization
algorithms and extend C-PSM to support more traffic models.
21
Centralizing the Power Saving Mode for 802.11 Infrastructure Networks
20 Will-be-set-by-IN-TECH
8. Acknowledgement
We acknowledge the financial support from the Fundamental Research Funds for the Central
Universities of the Republic of China (No.2010121066) and the National Defense Basic
Scientific Research Program of China under Grant (B1420110155).
9. References
Anastasi, G., Conti, M., Gregori, E. & Passarella, A. (2004). A performance study of
power-saving polices for Wi-Fi hotspots, The International Journal of Computer and
Telecommunications Networking 45(3): 295–318.
Anastasi, G., Conti, M., Gregori, E. & Passarella, A. (2007). 802.11 power-saving mode for
mobile computing in Wi-Fi hotspots: Limitations, enhancements and open issues,
ACM/Springer Wireless Networks .
Belghith, A., Belghith, A. & Molnar, M. (2007). Enhancing psm efficiencies in infrastructure
802.11 networks, International Journal of Computing and Information Sciences (IJCIS)
5(1): 13–23.
Berkeley, U., LBL, USC/ISI & PARC, X. (1996). The network simulator - ns-2, http://www.
isi.edu/nsnam/ns/.
C-Guys, Inc. (2004). SD-Link 11b specifications, />c-guysusa/wwwroot/SD-Link11b.html.
Chiang, M. & Bell, J. (2004). Balancing supply and demand of bandwidth in wireless cellular
networks: Utility maximization over powers and rates, Proc. IEEE INFOCOM.
Cisco Systems, Inc. (2004). Data sheet of cisco aironet 802.11a/b/g wireless cardbus adapter,
/>Cisco Systems, Inc. (2005). Cisco Aironet Wireless LAN Client Adapters Installation and
Configuration Guide (Technical Specifications).
Ebert, J., Aier, S., Kofahl, G., Becker, A., Burns, B. & Wolisz, A. (2002). Measurement
and simulation of the energy consumption of an WLAN interface, Technical report,
Technical University Berlin, Telecommunication Networks Group.
Feeney, L. & Nilsson, M. (2001). Investigating the energy consumption of a wireless network
interface in an ad hoc networking environment, Proc. IEEE INFOCOM.
Gao, Y., Zeng, Z. & Kumar, P. R. (2010). Joint random access and power selection for maximal
throughput in wireless networks, Proc. IEEE INFOCOM.
Gast, M. (2005). 802.11 Wireless Networks: The Definitive Guide, 2 edn, O’Reilly Media, Inc.
Guha, S., Chau, C. K. & Basu, P. (2010). Green wave: Latency and capacity-efficient sleep
scheduling for wireless networks, Proc. IEEE INFOCOM.
He, Y., Yuan, R., Ma, X., Li, J. & Wang, C. (2007). Scheduled PSM for minimizing energy in
wireless lans, Proc. IEEE ICNP.
Jeong, Y., Park, J., Ma, J. & Kim, D. (2004). An enhanced power save mode for ieee
802.11 station in ad hoc networks, Proc. IFIP International Federation for Information,
pp. 414–420.
Jung, E. & Vaidya, N. H. (2002). An energy efficient MAC protocol for wireless LANs, Proc.
IEEE INFOCOM.
Krashinsky, R. & Balakrishnan, H. (2005). Minimizing energy for wireless web access with
bounded slowdown, Wireless Networks 11: 135–148.
22
Energy Technology and Management
Centralizing the Power Saving Mode for 802.11 Infrastructure Networks 21
Lee, J., Rosenberg, C. & Chong, E. (2006). Energy efficient schedulers in wireless networks:
design and optimization, Mobile Networks and Applications 11(3).
Lei, H. & Nilsson, A. (2007). Queuing analysis of power management in the IEEE 802.11 based
wireless lans, IEEE Transactions on Wireless Communications 6(4).
Lin, H., Huang, S. & Jan, R. (2006). A power-saving scheduling for infrastructure-mode 802.11
wireless LANs, Computer Communications 29: 3483–3492.
Margi, C. (2006). Energy Consumption Trade-offs in Power Constrained Networks, PhD thesis,
University of California Santa Cruz.
MATLAB Central (2003). IEEE 802.11a WLAN model, />matlabcentral/fileexchange/3540.
MATLAB Central (2009). 802.11b PHY matlab code, />matlabcentral/fileexchange/3213/.
Narseo, V. R., Pan, H., Jon, C. & Andrew, R. (2010). Exhausting battery statistics-
understanding the energy demands on mobile handsets, Proc. MobiHeld.
Nath, S., Anderson, Z. & Seshan, S. (2004). Choosing beacon periods to improve response
times for wireless HTTP clients, Proc. the ACM International Workshop on Mobility
Management and Wireless Access (MobiWac).
Nedevschi, S., Popa, L. & Iannaccone, G. (2008). Reducing networking energy consumption
via sleeping and rate-adaptation, Proc. the 5th USENIX Symposium on Networked
Systems Design and Implementation.
Nuggehalli, P., Srinivasan, V. & Rao, R. (2002). Delay constrained energy efficient transmission
strategies for wireless devices, Proc. IEEE INFOCOM.
Nuggehalli, P., Srinivasan, V. & Rao, R. (2006). Energy efficient transmission scheduling for
delay constrained wireless networks, IEEE Transactions on Wireless Communications
5(3).
Proxim Wireless Corporation (2006a). Data sheet of orinoco 11a/b/g combocard,
/>gComboCard_USHR.pdf.
Proxim Wireless Corporation (2006b). Data sheet of orinoco pci card, xim.
com/downloads/products/cp/DS_0806_11a_b_gPCI_USHR.pdf.
Qiao, D., Choi, S., Jain, A. & Shin, K. (2003). MiSer: An optimal low-energy transmission
strategy for IEEE 802.11a/h, Proc. ACM MOBICOM.
Qiao, D. & Shin, K. (2005). Smart power-saving mode for IEEE 802.11 wireless lans, Proc. IEEE
INFOCOM.
Rozner, E. & Navda, V. (2010). Napman: Network-assisted power management for wifi
devices, Proc. ACM MobiSys.
Simunic, T., Benini, L., Glynn, P. & Micheli, G. (2000). Dynamic power management for
portable systems, Proc. ACM MOBICOM.
Stemm, M. & Katz, R. (1997). Measuring and reducing energy consumption of
network interfaces in hand-held devices, IEICE Transactions on Communications
E80-B(8): 1125–31.
Tan, E., Guo, L., Chen, S. & Zhang, X. (2007). PSM-throttling: Minimizing energy consumption
for bulk data communications in WLANs, Proc. IEEE ICNP.
Tarello, A., Sun, J., Zafer, M. & Modiano, E. (2005). Minimum energy transmission scheduling
subject to deadline constraints, Proc. IEEE WIOPT.
Tyan, H. (2002). Design, realization and evaluation of a component-based compositional
software architecture for network simulation, />23
Centralizing the Power Saving Mode for 802.11 Infrastructure Networks
22 Will-be-set-by-IN-TECH
Wang, J. F., Fang, Y. G. & Wu, D. P. (2006). A power-saving multi-radio multi-channel mac
protocol for wireless local area networks, Proc. IEEE INFOCOM.
Zeng, Z., Gao, Y. & Kumar, P. R. (2011). Sofa: A sleep-optimal fair-attention scheduler for the
power-saving mode of wlans, Proc. IEEE ICDCS.
Zhang, F. & Chanson, S. (2003). Throughput and value maximization in wireless packet
scheduling under energy and time constraints, Proc. IEEE RTSS.
24
Energy Technology and Management
2
A Study on Design of
Fiber-Reinforced Plastic (FRP) Tubes
as Energy Absorption Element in Vehicles
Yuqiu Yang and Hiroyuki Hamada
Kyoto Institute of Technology
Matsugasaki, Sakyo-ku, Kyoto
Japan
1. Introduction
To date, the global automotive industry is arguably the largest and most complex
undertaking in industrial history. However, where cars multiply twice as fast as people, the
automobile accidents old as automobiles themselves increased correspondingly. A car
accident is a road traffic incident which usually involves at least one road vehicle being in
collision with which may result in injury, property damage, sometimes even death at
serious situations. Up to now, road traffic injuries represent about 25% of worldwide injury-
related deaths as the leading cause. Facing the transport safety problem, policymakers in
government of all over the world are doing their efforts e.g. NHTSA of USA. On the other
hand, the automakers are also putting their emphasis in the increasing of the production
quality particularly their crashworthiness and crash compatibility. Till now, many products
including bumper, seat belt, airbag, anti-lock braking system (ABS) are proved useful to
secure the occupant from a collision or a sudden stop and therefore already required as the
mandatory equipments. Additionally, for scientists and engineers, in the late of 1990’s, a
particular international conference and a journal publication on crashworthiness well
known as ICRASH and IJCRASH were formed and provide them a platform to discuss and
present their works in the field of structural crashworthiness and impact biomechanics.
Besides safety, the automobile have another serious problem i.e. pollution. Most
automobiles in use today are propelled by gasoline or diesel. When it runs on the road, it
creates a lot of exhaust gas such as NO
x
that pollute the air and CO
2
which is one major
causes of global warming. With the increasing demands both for energy and environment
protection, economic cooperation (ECO) cars which have high fuel efficiency therefore are
desirable. It is considered that the improvement of the fuel efficiency can be realized by
reducing the vehicle’s weight. For a traditional metallic vehicle, however, it is difficult to
realize both light weight and high crashworthiness. Therefore, people are considered use
new materials system to instead of metal to manufacture next generation automobile. In the
area, fiber reinforced composites (FRPs) are found to be attractive [1-28].
Research into the use of structural components such as bumper for energy management is not
new. As a result, the energy absorbing characteristics of metals are fairly well understood.
However, until the late 1970’s, attempts at understanding the energy absorbing capabilities
Energy Technology and Management
26
and crushing mechanisms of FRPs have been made [1-4]. Most of the existing work on the
energy absorption capability of FRPs has concentrated on the behaviors of the tubular
specimens. In general, FRP tubes do not exhibit the ductile failure mechanism associated with
metals. Instead, the brittle nature of most fibers tends to generate a brittle mode of failure. That
is to say unlike metals, which absorb energy through plastic deformation, most FRP tubes are
found to absorb energy through progressive crushing mode by a combination of multi micro-
fracture and friction [5-10]. It is this fundamental difference which gives rise to the very
distinct energy absorption characteristics of FRPs. As the above researched showing, the
energy absorption capacity of FRP tubes is more attractive than metals. However, the adoption
of composite as energy absorbing structural elements is limited at present. There are many
main reasons. One of them is that the crushing performances and the energy absorption
mechanisms of FRP tubes are complicated as compared to metal. Referring to the energy
absorption capability, there are many important variables. Although a lot of researches have
been done on the inhere materials (reinforced fiber, matrix and the bonding between them) [5,
10, 11-15] and the reinforcement form (roving, cloth, braiding, knitting, chopped, and so on)
[16-24], there is still an urgent need of database from various composite tubes and a complete
understanding of the energy management from the multi micro fractures. Secondly, the
manufacturing cost of a FRP tube is rather higher than that of metal. Cost is considered to be
the key to apply the FRP into practice. Therefore the effects on the cost down are always warm
welcome. Additionally, research on actual application of composites is absent. Apart from the
understanding of the energy absorption capacity of the FRP tubes, a reasonable design such as
the geometry, length, located position and collapse trigger is required to transcend the
experimental stage and cross over to true application studies. Therefore, current studies
elaborate some experiments on this aspect. Three improvement methods including the design
of the bending energy of the tube fronds and the design of the fiber fractures energy were
proposed. Firstly, in this paper, the crushing behavior of FRP tube was linked with the
appearance of the bending behavior of beam. Then mechanism model of a bending beam was
used to simulate the bending fronds of FRP tube. Based on the founding that the bending
energy is related directly to the geometry of transversal cross section, design of the bending
energy though the design of the geometry of the FRP tubes was carried out. In details, a FRP
tube with general square transversal cross section was designed to mimic the circular one
through applying a big radius on the corners. Additionally, a special shape which utilizing
both circular and square geometry in transversal cross section was designed.
Up to now, much of the preceding discussion on the energy absorption capability of FRP tubes
had been carried out to investigate the effects of the internal components and the structures. At
the same time, researchers have found that the energy management has been shown to be
dependent on a number of external factors, for example, strain rate i.e. crushing speed and
collapse trigger mechanism. The influence of strain rate would appear to be one of the most
contentious issues relating to the energy absorption of FRPs [6,9,13,28,30-35]. As an energy
absorption element in automobiles, the crushing performance and the energy management in
dynamic condition is eagerly to be clarified. However, until now there is not a clear
understanding about the relationship between the energy management and crushing speed.
Some authors have reported increases in specific energy absorption (Es, i.e. the absorbed
energy per unit mass of the material) with loading rate, others decreases. Farley [30] observed
a rise in specific energy absorption of up to 35% for carbon-epoxy tubes over a range of
crushing speeds between 0.01 m/s and 12 m/s. However, the energy absorption of carbon-
epoxy tubes with a structure of [0/±θ]
2
was not found to be sensitive to crushing speed and
A Study on Design of Fiber-Reinforced
Plastic (FRP) Tubes as Energy Absorption Element in Vehicles
27
showed no increase. He suggests that energy absorption dependence on crushing speed will
be related to the energy absorbing mechanism which controls the crushing process. If the
mechanism is a function of strain rate then energy absorption will be a function of crushing
speed. Hull [6] supported results of the increased energy management under impact test and
suggested that friction in the crush zone may be another reason why energy absorption varies
with crushing speed. It has been found that frictional effects generate a considerable amount of
heat and it is likely that the magnitude of energy absorbed by this mechanism will vary with
loading rate. Conversely, Mamalis et al. [28,31] report that the energy management of thick
walled random chopped glass mat / polyester tubes exhibited a clear decrease under high
speed crushing (up to 24 m/s). However, there was no clear evidence of such a decrease for
thin-walled (< 4 mm tubes). Similarly to Farley [1], Mamalis et al [28] attribute the differences
in energy absorption under static and dynamic conditions to the changes in the crushing
mechanisms. In particular, the resin was found to become increasingly brittle under elevated
strain rates. Schmueser & Wickcliffe [13] also report that energy management decreased in
dynamic (5-6m/s) tests than in comparable static ones for carbon-epoxy, glass-epoxy and
aramid-epoxy tubes. In some cases, dynamic energy absorption was only approximately 75%
of equivalent static values. Although the above observations may at first sight appear
contradictory, it should be recognized that they are all based on isolated examples of specific
material and geometric configurations. As such, it is difficult to draw any overall conclusions.
In general, the effect of strain rate on the energy absorption capability of a given composite
structure is likely to be a complex function of the particular material system, fiber orientation,
geometry employed and other external factors.
On the other hand, FRP tubes, no matter which components are contained, what
configuration of the fibers is, or under which crushing speed, generally need a collapse
trigger to trigger progressive crushing rather than a sudden catastrophic type of failure.
Progressive crushing is a typical crushing performance of FRP materials in which the
crushing load keeps almost constant during the whole compression process with a relative
high value. However, before progressive crushing forms, there is another important stage,
i.e. the initial crushing period, although the energy absorption during the initial period
some times are ignored in rough calculation the Es values. In the case of without any trigger,
the crushing load of FRP tube increases linearly in initial compression stage. When the
crushing load exceeds the critical strength of the whole tube, catastrophic failures occurs.
Several previous studies have investigated such collapse trigger with some modification at
one end of the tube [3,5,36-39] and found that they performed well in initiating progressive
crushing. The collapse trigger mechanism is to generated high stress concentration at the
modified part from where the fracture is initiated or triggering before the load increase to
the critical strength of the whole tube. Defects of the above triggers are involved extra cost
and difficulty during the assembling procedure because of the angular edge.
2. Foundation thinking for optimization design
2.1 Bending energy
Based on the accident data analysis, it is known that about 70% accidents are from the full
lap and offset impacts. Therefore, such a design of energy absorption structures is carried on
in order to realize the minimum deformation of the cabin for saving the occupant’s space
and a small accelerate when vehicles are involved in crashes. In particular, a tubular
component, termed “Front Side Member”(Fig. 1), is designed to be installed behind the
Energy Technology and Management
28
bumper as a special kind of energy absorption element which can absorb most of the impact
energy through the fracture of itself in the chapter in particularly.
For a FRP tube which was fractured through progressive crushing mode, the energy
absorbing mechanism can be clarified from the observation on the axial cross sections
through the crush zone. Based on the summarized the observation results from the above
reference papers, it is found that FRP absorb energy by multi micro-fractures. A sample
cited from [12, 25] is given in Fig.2. The tube wall was split into pieces of fronds and bend to
both sides of the tube. A wedge of debris was formed by the fractured fiber and resin. Under
the wedge of debris, a central crack propagated. In the bending fronds, the delaminations
and the fiber fractures can be observed. Based on the observations, the total absorbed energy
(U
T
) is considered using formulation (1).
Ts
p
lit cc de bend
ff f
r
UU UUU UU=+++++ (1)
Front panel member
Front side member
Front bumper
reinforcement
Locker part
Instrument panel
Energy absorption structure
Front panel member
Front side member
Front bumper
reinforcement
Locker part
Instrument panel
Front panel member
Front side member
Front bumper
reinforcement
Locker part
Instrument panel
Energy absorption structure
the deformation for saving the occupant’s space
the acceleration experienced by the vehicle during an impact
absorb a lot of energy
progressively
absorb a lot of energy
progressively
Fig. 1. Schematic illustration of energy absorption structure in a vehicle illustrating the
component of front side member
Fig. 2. Observation results on a carbon/PEEK circular tube illustrating multi micro fractures
(cite from reference list [12, 25])
Here,
U
split
is the energy absorbed by splitting the integrated tube wall into pieces of fronds.
U
cc
is the energy for initiation and propagation of the central crack; U
de
is the energy for
A Study on Design of Fiber-Reinforced
Plastic (FRP) Tubes as Energy Absorption Element in Vehicles
29
delaminations; U
bend
is the energy of the bending of fronds; U
ff
is the energy required for
fiber fracture and
U
fr
is the energy associated with friction. Because these fractures occur
simultaneously and they correlate and affect each other, it is difficult to evaluate individual
energy absorption contribution and construct a design criterion.
In these multi-micro fractures, it is noticed that the FRP tubes show the bending behavior as
the essential performance. The propagation of the central crack or delaminations and the
fracture of the fibers or resin are considered to be generated during the bending process.
Therefore, a solution for the design of FRP tube’s energy management was proposed though
design
U
bend
. Here the bending frond is considered as a bending beam by an external force.
The mechanism model for such a beam with a height of l which is pulled by an external
force F is illustrated in Fig.3. The displacement along longitudinal direction is the s and the
y
max
is the maximum distance in y direction. The deformation energy i.e. the bending energy
U
bend
can be express by formula 2.
Fig. 3. Mechanism model for a beam which is pulled by an external force.
2
0
()
2
l
bend
Mx
Udx
EI
=
(2)
Here M is the bending moment of the beam (y trial) and x is any point in x direction from 0
to s displacement. According to the relationship between external force F and y
max
and the
relationship between displacement s and maximum distance y
max
, the bending energy can be
express by formula 3. For the given material (with a modulus
E and a height l) bent to a
displacement compression (s), the bending energy U
bend
is affected directly by the inertia
moment (I). In a word, U
bend
is in a function of I.
2
2
0
2
2
0
2
30
23
max
3
()
2
( )
2
1
( )
23
6
3
l
bend
l
l
F
Ulxdx
EI
F
xldx
EI
F
xl
EI
Fl
EI
and
EIy
F
l
=−
=−
=⋅−
=
=−
Energy Technology and Management
30
2
max
32
3( )
5
22
bend
EI y
EIs
U
ll
⋅⋅
∴= = (3)
An example about the effect of cross section geometry on
I is given in Fig.4. For a given
material with the same section area (
A:50mm
2
) and thickness (t:4mm), making the
structure to have cross section geometry in corner or flat wall shape, different
I would be
obtained. Here the calculation method of
I should be noted. In Fig.4(a), corner geometry is
illustrated (
A: cross section area of 50mm
2
; R: radius of outside of corner 10mm; r: radius
of inside of corner 6mm;
t: thickness 4mm). It is assumed to be split to two parts as outer
and inner fronds during compression process along the broken line located in the middle
of the thickness. The
I of the corner region, i.e.
corner
I can be calculated by formulae (4)
and (5)
corner ( ) ( )zc outer frond in corner geometry zc inner fornd in corner
g
eometr
y
II I=+ (4)
332
44
(/ )
22
28()
( )
16
9( )
zc outer inner frond in corner geometry
Rr
IRr
Rr
π+ −
=−−
π−
(5)
Here, R and r are the radii of the curvatures of the corner. Therefore, r plus thickness (t)
amounts
R. Additionally, for flat wall geometry (Fig.3b, A: cross section area of 50mm
2
; t:
thickness 4mm;
w: length 12.5mm), the I of flat wall, i.e.
f
lat wall
I also can be calculated by (6)
and (7)
( ) ( )
2( ) 2( )
flat wall zc outer frond in flat wall geometry zc inner
f
ornd in
f
lat wall
g
eometr
y
II I== (6)
3
( )
1
12
zc outer / inner frond in flat wall geometry
Iwt=
(7)
From the calculation results listed in the table in Fig.4(c), it is understood that
corner
I (40mm
4
) is bigger than
f
lat wall
I (16.8mm
4
), although they have same cross section area
and thickness. According to formula (3), under the same displacement (s), big bending
energy would be generated in the structure which has the transverse cross section in corner
geometry.
From previous experiences [7, 26-29], it is reported that square or rectangular tubes are
generally less effective at absorbing energy than a comparable circular tube. However,
square or rectangular tubes have the geometrical advantage because their flat wall can
assembled with other component easily. A pure circular tube can be considered as
a combination of four pieces of corner geometry while a pure square or rectangular tube
consists of four pieces of flat wall regions in cross section. I of pure circular tube is quite
different with that of a pure square tube even they have same cross section area
and height. It is considered that much big I in circular geometry is one of the reasons
why circular tube have higher energy absorption capability as compared to square tube.
Based on the above thinking, therefore, the following methods were proposed aiming
improved the energy absorption capacity of square and rectangular tubes, which would
be designed to have reasonable consisting of 4 pieces of flat wall and 4 corners in the
transversal cross section.