Advanced Trends in Wireless Communications Part 3 pdf
Bạn đang xem bản rút gọn của tài liệu. Xem và tải ngay bản đầy đủ của tài liệu tại đây (1.85 MB, 35 trang )
Performance Analysis of Maximal Ratio Diversity Receivers over Generalized Fading Channels 13
where U 2
∑
L
=1
μ
.andΓ(·, ·) is the incomplete gamma function (Gradshteyn & Ryzhik,
2000, eq. 8.350.2). Moreover, using (31), an integral representation of the outage probability
may readily be obtained as
P
out
(γ
th
)=
1
2
−
1
π
∞
0
sin[V(t) −t γ
th
]
W(t)
dt, (37)
where
V
(t)
L
∑
=1
μ
[arctan(A
t )+arctan(B
t )], (38a)
W
(t) t
L
∏
=1
[
1
+ t
2
A
2
1
+ t
2
B
2
]
μ
2
, (38b)
Finally, by integrating (35) term-by-term, a closed form expression for P
out
(γ
th
) may be
obtained a s
P
out
(γ
th
)=
∏
L
j
=1
(A
B
)
−μ
γ
U
th
Γ
(
1 + U
)
Φ
(2L)
2
(
μ
1
, μ
1
, ···, μ
L
, μ
L
,1+ U, −
γ
th
A
1
, −
γ
th
B
1
···,
−
γ
th
A
L
, −
γ
th
B
L
.
(39)
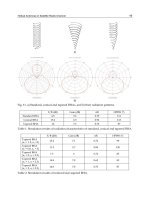
Fig. 5. Outage Probability of dual-branch MRC diversity receivers (L = 2) operating over η-μ
fading channels (Format 1, η
= 2, μ = 1.5) , for different values of δ, as a function of the First
Branch Normalized Outage Threshold
In Figure 5 the outage performance of a dual-branch MRC diversity system versus the
first branch normalized outage threshold
γ
1
/γ
th
illustrated for η = 2, and μ = 1.5. An
exponentially power decay profile with δ
= 0, 0.5, 1 is considered. The outage probability
is plotted for different values of δ and as it is obvious, the outage performance increases as
δ decreases. Note that both the integral representation, given by (36) and the infinite series
representation, given by (37) yield identical results.
59
Performance Analysis of Maximal Ratio Diversity Receivers over Generalized Fading Channels
14 Will-be-set-by-IN-TECH
5.2 Channel capacity
For fading channels, the ergodic channel capacity characterizes the long-term achievable rate
averaged over the fading distribution and depends on the amount of available channel state
information (CSI) at the receiver and transmitter Alouini & Goldsmith (1999a). Two adaptive
transmission schemes are considered: Optimal rate adaptation with constant transmit power
(ORA) and optimal simultaneous power and rate adaptation (OPRA). Under the ORA scheme
that requires only receiver CSI, the capacity is known to be given by Alouini & Goldsmith
(1999a)
C
OR A
=
1
ln 2
∞
0
f
γ
(γ) ln(1 + γ)dγ (40)
In order to obtain an analytical expression of
C
OR A
for the considered DS-CDMA system,
we first make use of the infinite series representations of the PDF of γ given by (28). Then,
by expressing the exponential and the logarithm in terms of Meijer-G functions (Prudnikov
et al., 1986, Eq.(8.4.6.5)), (Prudnikov et al., 1986, Eq. (8.4.6.2)) and applying the result given
in (Prudnikov et al., 1986, Eq. (2.24.1.1)), the following expression for the capacity may be
obtained:
C
OR A
=
C
U
m
ln 2
L
∏
=1
(A
B
)
−μ
∞
∑
k=0
ξ
k
G
1,3
3,2
C
m
1, 1, 1−U−k
1, 0
Γ
(
k + U
)
,
(41)
where G
m,n
p,q
[·] is the Meijer-G function (Gradshteyn & Ryzhik, 2000, Eq. (9.301)). For the
OPRA scheme, the capacity is known to be given by (Alouini & Goldsmith, 1999a, Eq. (7))
C
OPR A
=
∞
γ
0
log
2
γ
γ
0
f
γ
(
γ
)
dγ, (42)
where γ
0
is the cutoff SNR below which transmission is suspended. By substituting (28) to
(42), expressing the logarithm and the exponential in terms of Meijer-G functions (Prudnikov
et al., 1986, Eq.(8.4.6.5)), (Prudnikov et al., 1986, Eq. (8.4.3.1)) and with the help of (Prudnikov
et al., 1986, Eq. (2.24.1.1)),
C
OPR A
may be obtained as
C
OPR A
=
C
U
m
ln 2
L
∏
l=1
(
A
l
B
l
)
−μ
l
∞
∑
k=0
ξ
k
G
0,3
3,2
C
m
γ
0
1, 1, 1−U−k
0, 0
Γ
(
k + U
)
.
(43)
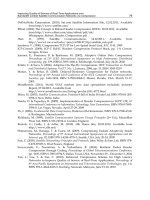
In Figure 6 the average of a triple-branch MRC diversity system under the ORA transmission
scheme, is illustrated versus
γ
1
for η = 2, and μ = 1.5. An exponentially power decay profile
with δ
= 0, 0.5, 1 is considered. The average channel capacity is plotted for different values of
δ and as it is obvious, the capacity improves as δ decreases.
5.3 Average bit error probability
The conditional bit error probability P
e
(γ) in an AWGN channel may be expressed in unified
form as
P
e
(γ)=
Γ(b, aγ)
2Γ( b)
(44)
where a and b are parameters that depend on the specific modulation scheme. For example,
a
= 1 for binary phase shift keying (BPSK) and 1/2 for binary frequency shift keying (BFSK).
Also, b
= 1 for non-coherent BFSK and binary differential PSK (BDPSK) and 1/2 for coherent
60
Advanced Trends in Wireless Communications
Performance Analysis of Maximal Ratio Diversity Receivers over Generalized Fading Channels 15
Fig. 6. Average Channel Capacity of triple-branch MRC diversity receivers (L = 3) operating
over η-μ fading channels, (Format 1, η
= 2, μ = 1.5), under ORA policy, for different values
of δ, as a function of the First Branch Average Input SNR
BFSK/BPSK. The average bit error probability (ABEP) for the considered system may be
obtained by averaging P
e
(γ) over the PDF of γ i.e.,
P
be
=
∞
0
P
e
(γ) f
γ
(γ)dγ. (45)
Using (28) in co njunction with (45) and with the help of (Gradshteyn & Ryzhik, 2000, eq. 6.455)
the ABEP may be obtained as
P
be
=
a
b
C
U+b
m
2Γ( b)
L
∏
=1
(A
B
)
−μ
∞
∑
k=0
2
F
1
1, k
+ U + b; k + U + 1;
1
1 + aC
m
×ξ
k
Γ
(
k + U + b
)
(1 + aC
m
)
k+U+b
Γ
(
k + U + 1
)
, (46)
where
2
F
1
(·) is the Gauss hypergeometric function (Prudnikov et al., 1986, eq. (7.2.1.1)). Also,
by substituting (32) to (45), the ABEP is expressed as a two-fold integral. This expression may
be simplified by performing integration by parts and after some algebraic manipulations as
follows
P
be
=
1
2π
∞
0
cos
[V(t)]
a
b
sin(b arctan(t/a))
(t
2
+ a
2
)
b /2
+ sin[V(t)]
1
−
a
b
cos( b arctan(t/a))
(t
2
+ a
2
)
b /2
dt
W(t)
. (47)
This integral can be efficiently evaluated by means of the G auss-Legendre quadrature
integration rule or by symbolic integration. Finally, an alternative ABEP expression may
61
Performance Analysis of Maximal Ratio Diversity Receivers over Generalized Fading Channels
16 Will-be-set-by-IN-TECH
be obtained b y substituting (35) to (45). By integrating the corresponding infinite series
term-by-term and with the help of (Abramovitz & Stegun, 1964, eq. (6.5.37)), the ABEP may
be obtained in closed form as
P
be
=
Γ
(
U + b
)
∏
L
=1
(A
B
)
−μ
2a
U
Γ(b)Γ(U + 1)
F
(2L)
D
(
U + b, μ
1
, μ
1
, ···, μ
L
, μ
L
; U + 1;
−
1
aA
1
, −
1
aB
1
···, −
1
aA
M
L
, −
1
aB
M
L
. (48)
This expression can be easily evaluated using the integral r epresentation of the Lauricella
function. This representation converges if
1
aA
< 1and
1
aB
< 1, ∀ = 1, L.Toguarantee
that these conditions are always be fulfilled, we may use the following identity (Exton, 1976,
p. 286)
F
(n)
D
(
a, b
1
, ···, b
n
; c; x
1
, ···, x
n
)
=
L
∏
=1
(
1 − x
)
−b
× F
(n)
D
c
− a, b
1
, ···, b
n
; c;
x
1
x
1
−1
,
···,
x
n
x
n
−1
.
(49)
Thus, (48) can be written as
P
s
(e)=
Γ
2
∑
L
i
=1
μ
i
+ b
2Γ( b)Γ(2
∑
L
i
=1
μ
i
+ 1)
M
γ
(a)F
(2L)
D
b
−1, μ
1
, ···μ
L
, μ
1
, ···μ
L
;2
L
∑
i=1
μ
i
+ 1;
1
1 + aA
1
,
···,
1
1 + aA
L
,
1
1 + aB
1
, ···,
1
1 + aB
L
(50)
As it can easily be observed, for BPSK modulation (a
= 1, b = 1/2), (50) reduces to (8), thus
verifying the correctness of our analysis. Finally, it is worth mentioning that in Moschopoulos
(1985), a proof for the uniform convergence of the series in (28) is provided and a bound for the
truncation error is presented. Our conducted n umerical experiments confirmed this bound on
the truncation error and showed that infinite series converge steadily for all the scenarios of
interest, a fact that was also established in Alouini et al. (2001).
6. Conclusions
In this chapter, a thorough performance analysis of MRC diversity receivers operating over
η-μ fading channel was provided. Using the MGF-based approach, we derived closed-form
expressions for a variety of M-ary modulation schemes. Moreover, in order to provide more
insight as to which parameters affect the error performance, asymptotic expressions for the
ASEP were derived. Based on these formulas, we proved that the diversity gain depends
only on the parameter μ in each branch whereas η af fects only the coding gain. Furthermore,
we provided three new analytical expressions for the PDF of the sum of non-identical η-μ
variates. Such expressions are useful to assess the outage performance and the ave rage
channel capacity of MRC diversity receivers under different adaptive transmission schemes.
Finally, based on this PDF-based analysis, alternative expressions for the error performance
of MRC receivers are provided. Various numerically evaluating results are presented that
illustrate the analysis proposed in this chapter.
62
Advanced Trends in Wireless Communications
Performance Analysis of Maximal Ratio Diversity Receivers over Generalized Fading Channels 17
7. References
Abramovitz, M. & Stegun, I. (1964). Handbook of Mathematical Functions with Formulas, Graphs,
and Mathematical Tables, Dover, New York, ISBN 0-486-61272-4.
Adinoyi, A. & A l-Semari, S. (2002). Expression for evaluating performance of BPSK with MRC
in Nakagami fading, IEE Electronics Letters 38(23): 1428–1429.
Alouini, M S., Abdi, A. & Kaveh, M. (2001). Sum of gamma variates and performance of
wireless communication systems over Nakagami-fading channels, IEEE Transactions
on Vehicular Technology 50(6): 1471–1480.
Alouini, M S. & Goldsmith, A. J. (1999a). Capacity of Rayleigh fading channels
under different adaptive transmission and diversity-combining techniques, IEEE
Transactions on Vehicular Technology 48(4): 1165–1181.
Alouini, M S. & Goldsmith, A. J. (1999b). A unified a pproach for calculating the error rates
of linearly modulated signals over generalized fading channels, IEEE Transactions on
Communications 47: 1324–1334.
Asghari, V., da Costa, D. B. & Aissa, S. (2010). Symbol error probability of rectangular QAM
in MRC systems with correlated η-μ fading channels, IEEE Transactions on Vehicular
Technology 59(3): 1497–1497.
da Costa, D. B. & Yacoub, M. D. (2007). Average Channel Capacity for Generalized Fading
Scenarios, IEEE Communications Letters 11( 12): 949–951.
da Costa, D. B. & Yacoub, M. D. (2008). Moment Generating Functions of Generalized Fading
Distributions and Applications, IEEE Communications Letters 12(2): 112–114.
da Costa, D. B. & Yacoub, M. D. (2009). Accurate approximations to the sum of generalized
random variables and applications in the performance analysis of diversity systems,
IEEE Communications Letters 57( 5): 1271–1274.
Efthymoglou, G. P., Aalo, V. A. & Helmken, H. (1997). Performance analysis of coherent
DS-CDMA systems in a Nakagami fading channel with arbitrary parameters, IEEE
Transactions on Vehicular Technology 46(2): 289–297.
Efthymoglou, G. P., Piboongungon, T. & Aalo, V. A. (2006). Performance analysis of coherent
DS-CDMA systems with MRC in Nakagami-m fading channels wi th arbitrary
parameters, IEEE Transactions on Vehicular Technology 55(1): 104–114.
Ermolova, N. (2008). Moment Generating Functions of the Generalized η
− μ and k − μ
Distributions and Their Applications to Performance Evaluations of C ommunication
Systems, IEEE Communications Letters 12(7): 502 – 504.
Ermolova, N. (2009). Useful integrals for performance evaluation of communication systems
in generalized η- μ and κ-μ fading channels, IET Communnications p p. 303–308.
Exton, H. (1976). Multiple Hypergeometric Functions and Applications, Wiley, New York.
Filho, J. C. S. S. & Yacoub, M. D. (2005). Highly a ccurate η-μ ap proximation to sum of
M independent non-identical Hoyt variates, IEEE Antenna and Propagation Letters
4: 436–438.
Gil-Pelaez, J. (1951). Note on the inversion theorem, Biometrika 38: 481–482.
Gradshteyn, I. & Ryzhik, I. M. (2000). Tables of Integrals, Series, and Products, 6 edn, Academic
Press, New York.
Lei, X., Fan, P. & Hao, L. (2007). Exact Symbol Error Probability of General Order Rectangular
QAM with MRC Diversity Reception over Nakagami-m Fading Channels, IEEE
Communications Letters 11(12): 958 – 960.
Morales-Jimenez, D. & Paris, J. F. (2010). Outage probability analysis for η-μ fading channels,
IEEE Communications Letters 14( 6): 521–523.
63
Performance Analysis of Maximal Ratio Diversity Receivers over Generalized Fading Channels
18 Will-be-set-by-IN-TECH
Moschopoulos, P. G. (1985). The distribution of the sum of independent gamma random
variables, Ann. Inst. Statist. Math. (Part A) 37: 541–544.
Peppas, K., Lazarakis, F., Alexandridis, A. & Dangakis, K. (2009). Error performance of digital
modulation schemes with MRC diversity reception over η-μ fading channels, IEEE
Transactions on Wireless Communications 8(10): 4974–4980.
Peppas, K. P., Lazarakis, F., Zervos, T., Alexandridis, A. & Dangakis, K. (2010). Sum of
non-identical independent squared η-μ variates and applications in the performance
analysis of DS-CDMA systems, IEEE Transactions on Wireless Communications
9(9): 2718–2723.
Prudnikov, A. P., Brychkov, Y. A. & Marichev, O. I. (1986). Integrals and Series Volume 3: More
Special Functions, 1 edn, Gordon and Breach Science Publishers.
Radaydeh, R. M. (2007). Average Error Performance of M-ary Modulation Schemes in
Nakagami-q (Hoyt) Fading Channels, IEEE Communications Letters 11(3): 255 – 257.
Saigo, M. & Tuan, V. K. (1992). Some integral representations of multivariate hypergeometric
functions, Rendicoti der Circolo Matematico Di Palermo 61(2): 69–80.
Simon, M. K. & Alouini, M S. (1999). A unified approach to the probability of error
for noncoherent and differentially coherent modulations over generalized fading
channels, IEEE Transactions on Communications 46: 1625–1638.
Simon, M. K. & Alouini, M. S. (2005). Digital Communication over Fading Channels, Wiley.
Srivastava, H. M. & L.Manocha, H. (1984). A Treatise on Generating Functions, Wiley, New York.
Wang, Z. & Yannakis, G. (2003). A simple and general parametrization quantifying
performance in fading channels, IEEE Transactions on Communications
51(8): 1389–1398.
Yacoub, M. D. (2007). The κ-μ and the η-μ distribution, IEEE Antennas and Propagations
Magazine 49(1): 68–81.
64
Advanced Trends in Wireless Communications
4
Humidity Measurements using
Commercial Microwave Links
Noam David, Pinhas Alpert and Hagit Messer
Tel Aviv University
Israel
1. Introduction
Atmospheric humidity strongly affects the economy of nature and has a cardinal part in a
variety of environmental processes (e.g. Allan et al., 1999). As the most influential of
greenhouse gases, it absorbs long-wave terrestrial radiation. Through the water vapour
evaporation and recondensation cycle, it plays a central part in the Earth's energy
redistribution mechanism by transferring heat energy from the surface to the atmosphere.
Meteorological decision-support for weather forecasting is based on atmospheric model
results, the accuracy of which is determined by the quality of its initial conditions or forcing
data. Humidity, in particular, is a critical variable in the initialization of these models. The
Mesoscale Alpine Programme (MAP) which set out to improve prediction of the regional
weather, and specifically rainfall and flooding, concluded that accurate moisture fields for
initialization were of great importance in achieving improved results (Ducrocq et al., 2002).
Humidity measurements are predominantly obtained by either surface stations, radiosondes
or satellite systems. The typical surface station instruments commonly provide only very
local, point, observations, and therefore suffer from low spatial resolution. Moisture though,
is a field with an unusually high variability in the mesoscale as demonstrated, for instance,
by structure functions (Lilly & Gal-Chen, 1983). Compounding this problem is the limited
accessibility to position humidity gauges in heterogeneous terrain, or areas with complex
topography. Satellites allow for a large area to be covered, but are frequently not accurate
enough in measuring surface level moisture while this near-surface moisture is, in most
cases, the important variable for convection. Radiosondes, which are typically launched
only 2-4 times a day, also provide very limited information. Additionally, these monitoring
methods are costly for implementation, deployment and maintenance.
Because of surface perturbation a point measurement close to the surface (for example 2m
from the ground as in a standard meteorological surface station) is not satisfactory for
model initialization. What is ideally required for meteorological modeling purposes is an
area average measurement of near-surface moisture over a box with the scale of the model's
grid and at an altitude of a few tens of meters. Current measuring tools cannot effectively
provide this type of data. The method we present in this chapter provides a unique way of
obtaining precisely this type of measurement. We introduce a technique, originally
published by David et al. (2009), to measure atmospheric humidity using data collected by
wireless communication networks.
Advanced Trends in Wireless Communications
66
2. Humidity monitoring using commercial microwave networks
2.1 Microwave links measurements as a basis for environmental monitoring
The propagation of the electromagnetic beam in the lower atmosphere, at centimeter and
shorter wavelengths, is impaired by various weather phenomena (primarily precipitation,
oxygen, water vapour, snow, mist and fog). The presence of line of sight and Fresnel zone
clearance, propagation phenomena – diffraction, refraction, absorption and scattering – all
affect the electromagnetic channel, causing attenuations to the radio signals (Raghavan,
2003). Thus, wireless communication networks provide built-in environmental monitoring
tools, as was demonstrated for rainfall observations (Messer et al., 2006; Messer, 2007;
Leijnse et al., 2007).
The attenuation of an electromagnetic wave, at requencies of tens of GHz, due to the
interaction with rain droplets is well studied. The common approach relating the
attenuation A [dB km
-1
] with the rain rate R [mm hour
-1
] is the power law model (Olsen at
al., 1978):
A =aR
b
(1)
Where the constants a and b are, in general, functions of wave- frequency, its polarization
and the drop size distribution (Jameson, 1991) . Given measurements of the Received Signal
Level (RSL), the rain induced attenuation A can be estimated and in turn the average rainfall
rate R.
Several works have shown that based on this technique, further applications, concerning
rainfall monitoring, can be achieved (e.g. Zinevich et al., 2008-2009; Goldstein et al., 2009).
Additionally, microwave links have been shown to be applicable for the identification of
melting snow (Upton et al., 2007). An extensive study, concerning the hydrometeorological
application of microwave links, was conducted, where in addition to the ability to measure
precipitation, a Radio Wave Scintillometry-Energy Budget Method (RWS-EBM) to estimate
areal evaporation using a microwave link (radio wave scintillometer) in combination with
an energy budget constraint, was demonstrated (Leijnse, 2007). Zinevich et al. (2010) have
recently discussed the prediction of rainfall measurement errors based on commercial
wireless communication data.
2.2 Wireless communication networks as a water vapour monitoring system
Wireless communication, and in particular cellular networks, are widely distributed,
operating in real time with minimum supervision, and therefore can be considered as
continuous, high resolution humidity observation apparatus.
Environmental monitoring using data from wireless communication networks offers a
completely new approach to quantifying ground level humidity. Since cellular networks
already exist over large regions of the land, including complex topography such as steep
slopes and since the method only requires standard data (saved by the communication
system anyway), the costs are minimal.
Of the various wireless communication systems, we focus on the microwave point-to-point
links which are used for backhaul communication in cellular networks, as they seem to have
the most suitable properties for our purposes: they are static, line-of-sight links, built close
to the ground, and operate in a frequency range of tens of GHz. Built-in facilities enable RSL
measurements to be recorded at different time resolutions according to the different
equipment types (typically, measurements are taken between once per minute to once per
Humidity Measurements using Commercial Microwave Links
67
24 hours). Some systems store only minimum and maximum RSL measurements per 15
minutes intervals. The magnitude resolution also varies for different types of equipment, it
typically ranges between 0.1 dB to a few dB per link. Some of the microwave networks are
equipped with automatic power control systems (however, not the ones used during the
current study), in these cases, the transmitted signal level records should be taken into
account in addition to the RSL measurements. In this research, the wireless system used for
humidity observations has a magnitude resolution of 0.1 dB per link. This communication
network provides attenuation data every few seconds, but only stores one data point per 24
hours (at 03:00 a.m.).The system can be configured to store data at shorter time intervals; it
is a matter of technical definition by the cellular companies. Therefore, it has the potential of
providing moisture observations at high temporal resolution. The length of an average
microwave link is on the order of a few km and tends to be shorter in urban areas and longer
in rural regions. In typical conditions of 1013 hPa pressure, 15 °C temperature and water
vapour density of 7.5 g/m
3
, the attenuation caused to a microwave beam interacting with the
water vapour molecules at a frequency of ~ 22 GHz is roughly around 0.2 dB/km (Rec. ITU-R
P.676-6, 2005, Liebe, 1985). Therefore, perturbations caused by humidity can be detected.
3. Theory and methods
At frequencies of tens of GHz, the main absorbing gases in the lower atmosphere are oxygen
and water vapour. While oxygen has an absorption band around 60 GHz, water vapour has
a resonance line at 22.235 GHz. The information concerning the attenuation and absorption
by atmospheric water vapour and oxygen is based on the pioneering work of Van Vleck
from 1947 (see also Gunn & East, 1954; Bean & Dutton, 1968). Although other atmospheric
molecules have spectral lines in this frequency region, their expected strength is too small to
affect propagation significantly (Raghavan, 2003; Meeks, 1976). As a consequence, an
incident microwave signal, interacting with an H
2
O molecule is attenuated, particularly if its
frequency is close to the molecule's resonant one. Since backhaul links in cellular networks
often operate around frequencies of 22 to 23 GHz, we focus on the 22.235 GHz absorbing
line to monitor the water vapour.
3.1 The refractive index
In case of a homogeneous medium, the velocity of propagation, v, is given by (Raghavan,
2003):
1/2
v('μ')
−
=ε (2)
ε' [Farads/m]- The permittivity of the medium through which the wave propagates.
μ' [Henries/m]- The magnetic inductive capacity of the medium.
In free space, the velocity of light,
c, is known as follows:
00
1/2
c(εμ)
−
= (3)
ε
0
= 8.85×10
−12
[Farads/m]- The permittivity of free space.
μ
0
= 4π×10
−7
[Henries/m] - The magnetic inductive capacity of free space.
The dielectric constant of the medium, ε, which expresses the extent to which a material
concentrates electric flux, is defined as the following ratio: ε'/ε
0
= ε.
Advanced Trends in Wireless Communications
68
μ'/μμ
0
= - The magnetic permeability of the medium.
The refractive index of the medium, n, is defined as the ratio of the velocity in free space to
that in the medium:
c
1/2
n()
v
≡=εμ (4)
Thus, for the propagation medium considered here, the value of μ can be taken as unity and
therefore:
2
n ε
=
(5)
In our case, the dielectric is not perfect (due to absorption) and hence the refractive index
n
is a complex quantity of which
nRe(n)
=
is the real part. The imaginary part, Im(n)
,
represents the absorption.
3.2 The absorption coefficient -
γ
An electromagnetic wave propagating through a medium in the +z direction can be
described as follows (Jackson, 1999):
i(kz ωt)
ˆ
E(z,t) E e η
0
−
=
G
(6)
i(kz ωt)
ˆ
ˆ
B(z,t) B e (z η)
0
−
=
×
G
(7)
The complex amplitudes of the electric field,
E
G
, and the magnetic field , B
G
, are denoted by
E
0
and B
0
, respectively.
η
ˆ
-
Unit vector (in the x-y plane).
k
- The complex wave-number [rad/m].
ω - The angular frequency [rad/sec].
As the electromagnetic wave propagates, it carries energy along with it. The energy flux
density (energy per unit area, per unit time) transported by the fields is given by the
complex Poynting vector
S
G
. The average in time, S
a
, of the magnitude of the Poynting
vector, is expressed as (Kerr, 1951; Raghavan, 2003):
1
*
SRe(EH)
a
2
=×
G
G
(8)
The asterisk signifies the complex conjugate while the vector
H
G
, associated with the
magnetic field
B
G
, is given in equation (9):
Bμ'H
=
G
G
(9)
The intensity, I, of an electromagnetic wave is proportional to S
a
(Jackson, 1999). Therefore,
by substituting equations (6), (7) and (9) into equation (8):
Humidity Measurements using Commercial Microwave Links
69
2
i(kz ωt) 2Im(k)z
I(z) e e
−−
∝=
(10)
Hence:
2Im(k)z
I(z) I e
0
−
=
(11)
Where I
0
and I are the intensity of the incident electromagnetic radiation and that after the
material, respectively.
On the other hand, according to Beer-Lambert law:
γ
z
I(z) I e
0
−
= (12)
While
γ [m
-1
] is the absorption coefficient.
Hence:
γ
2Im(k)=
(13)
The connection between the complex refractive index and the complex wave number is
known to be (Raghavan, 2003):
ck cRe(k) cIm(k)
n Re(n) iIm(n) i
ωω ω
=+ == +
(14)
Therefore, from equations (13) and (14):
2ω 4πf
γ
Im(n) Im(n)
cc
==
(15)
Finally, in order to obtain γ
in dB/km:
9" 6
4π f10N 10
[GHz] [N units]
10
γ
[dB/km]
5
ln10
310
[dB]
[km/s]
"
0.1820f N
[GHz] [N units]
−
⎡
⎤⎡ ⎤
⋅⋅ ⋅
⎢
⎥⎢ ⎥
⎡⎤
⎣
⎦⎣ ⎦
=
⎢⎥
⎣⎦
⋅
=
(16)
While N'' is the imaginary part of the refractive index in N units (the index of refraction, n, is
equivalent to (n-1)·106 N units).
3.3 Estimating humidity through wireless communication networks measurements
The attenuation γ [dB km
-1
] due to dry air and water vapour is well studied and can be
evaluated (Rec. ITU-R P.676-6, 2005, Liebe 1985 ) using:
γ= A
w
+ A
o
[dB km
-1
] (17)
Hence, according to equations (16) and (17):
Advanced Trends in Wireless Communications
70
A A 0.1820fN''
wo
+
= [dB km
-1
] (18)
Where:
A
w
: The specific attenuation due to water vapour [dB km
-1
].
A
o
: The specific attenuation due to dry air [dB km
-1
]
Assuming moist air A
o
, is one order of magnitude lower comparing to A
w
, since at
frequencies of ~22 GHz, the signal loss is caused predominantly by the water vapour
(assuming no precipitation, fog or other hydrometeors found along the propagation path).
f: The link's frequency [GHz].
N''= N''(p,T,ρ): The imaginary part of the complex refractivity measured in N units, a
function of the pressure p[hPa], temperature T[°C] and the water vapour density ρ[g m
-3
].
While:
N'' S F N''
ii D
i
=
+
∑
(19)
Si= Si (p,T): The strength of the i-th line [KHz].
Fi= Fi (p,T,ρ,f): Line shape factor [GHz
-1
].
N"
D
= N"
D
(p,T,f): The dry continuum due to pressure-induced nitrogen absorption and the
Debye spectrum.
The summation is of the individual resonance lines from oxygen and water vapour, the sum
extends over all lines up to 1000 GHz. The detailed expression of the functions of N" is
described in the literature (Rec. ITU-R P.676-6, 2005; Liebe, 1985).
3.4 Estimating humidity through surface station data
Since meteorological surface stations normally do not provide the absolute moisture ρ, it
was derived using the known relations (Rec. ITU-R P.676-6, 2005; Liebe 1985; Bolton, 1980):
17.67T
e 6.112exp
s
T 243.5
⎛⎞
=
⎜⎟
+
⎝⎠
(20)
T 273.15
e ρ
216.7
+
=
(21)
e
100% RH
e
s
≡ (22)
e
s
- The saturation water vapour pressure [hPa].
e- The water vapour partial pressure [hPa].
T- The temperature [°C].
ρ- The water vapour density [g/m
3
].
RH- The relative humidity [%].
Hence:
17.67T
exp
RH
T 243.5
ρ 1324.45
100% T 273.15
⎛⎞
⎜⎟
+
⎝⎠
=××
+
(23)
Humidity Measurements using Commercial Microwave Links
71
3.5 Statistical tests
We investigated the correlation between absolute humidity values calculated using the
method described, and those measured using a regular humidity gauge. The correlation
analysis was performed using the Pearson's correlation test with the level of significance at
0.05 (Neter, 1996
).
The Root Mean Square Difference (RMSD) was used according to the following
definition:
N
2
(ρρ)
mi gi
3
i1
RMSD [g/m ]
N
−
∑
=
= (24)
ρ
mi
- The i-th water vapour density measurement as measured using the microwave link
[g/m
3
].
ρ
g
i
- The i-th water vapour density measurement as measured using the humidity gauge
[g/m
3
].
N - Number of samples.
The humidity measurements taken via the microwave link were calculated from a signal
instantaneously sampled at 03:00 a.m. Humidity measurements with the regular humidity
gauge were taken at the surface stations every half hour, and from these measurements, the
ones relating to the same hour were selected.
4. Results
Humidity observations, based on commercial microwave links data, were made in several
different locations in Israel (Figure 1), and at several different times. The results presented
here (Figure 2) are for Haifa Bay area, northern Israel and Ramla region, central Israel (four
study cases are demonstrated here, two for each area). The observations of these four
microwave links were made during November 2005, May 2008 and September 2007, April-
May 2007, respectively.
Figures 2(a)-2(d) present the water vapour density ρ (g/m
3
) as estimated using RSL
measurements from the microwave link data (dark) vs. conventional humidity gauge data
(bright).
The results, presented here, show very good match between the conventional technique and
the novel method. The calculated correlation coefficients, in these cases, were between 0.82
to 0.9. The RMSD were found to be 1.8 [g/m
3
] and 2 [g/m
3
] for the links located by Harduf
and Kfar Bialik, respectively. The RMSD of the central site measurements (Ramla area) were
3.4 [g/m
3
] (for both cases in this region). Similar comparisons were performed for other
links and other time slots showing correlations in the range of 0.5-0.9. The system from
which the data were collected captures a single signal every 24 hours at 03:00 a.m. The
surface station observations used were taken from the vicinity of the link's area at the same
hour. Since rainfall causes additional signal-attenuation, days when showers occurred
approximately at 03:00 a.m. till 04:00 a.m. (according to close by surface stations), were
excluded.
Advanced Trends in Wireless Communications
72
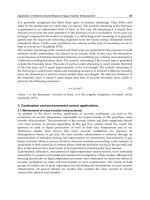
Fig. 1. The examined regions (taken from David et al., 2009).
1(a) North Israel: Two microwave links are presented (marked as lines) in front of Kiryat
Ata, Haifa bay (where the humidity gauge is located). The first link (3.86 km long) is located
on two hills, its transmiter and receiver are found at heights of 265 and 233 m Above Sea
Level (ASL). The distance from the surface station to a point located in the middle of this
wireless link is 7.5 km. The transmiting and receiving units of the second radio link (3.41
km) are situated 25 and 41 m ASL while the surface station- link distance is 3 km in this case.
The Kiryat Ata surface station is situated 45 m ASL.
1(b) Central Israel: The two microwave links in front of Ben-Gurion airport meteorological
station (humidity gauge's location). The distance from the surface station to a point located
in the middle of the 4.53 km link is 6.5 km. This link's transmitter and receiver are located at
heights of 95 and 63 m ASL. The longer link (11.05 km) is located 5 km from the surface
satation while its transmitting and receiving units are situated 116 and 98 m ASL. The
airport surface station is situated at 41 m ASL
Humidity Measurements using Commercial Microwave Links
73
Fig. 2(a). Northern Israel (taken from David et al., 2009) - The observations were made, by
the 3.86 km wireless link, during the month of November 2005, where 2 rainy days were
excluded (7 and 22 November). The rainfall data were taken from two different surface
stations situated in the Haifa District Municipal Association for the Environment (HDMAE)
and in Kiryat Ata, about 12.5 km and 7 km, respectively, from Harduf (see Fig. 1a). The
link's frequency is 22.725 GHz. The calculated correlation between the two curves is 0.9
while the RMSD is 1.8 [g/m
3
]
Fig. 2(b). Northern Israel - The humidity measurements were made, by the 3.41 km
microwave link, during May 2008. The correlation between the two measurements is 0.87
with RMSD of 2 [g/m
3
]. Link's frequency: 22.05 GHz
Advanced Trends in Wireless Communications
74
Fig. 2(c). Central Israel - The measurements were taken during the month of September 2007
(25 days). The link's frequency is 22.525 GHz and the calculated correlation between the
time series is 0.89 with RMSD of 3.4 [g/m
3
]
Fig. 2(d). Central Israel (taken from David et al., 2009) - The measurements were taken
between 20 April and 20 May 2007, excluding 2 days when showers occurred (5 and 19
May). The precipitation data were taken from Beit Gamliel surface station which is located
about 13 km from Ramla (see Fig. 1b). It should be noted that it is possible that the increased
attenuation in this case that is greater than the typical moist air attenuation, was caused as a
result of other interference such as wind moving the transmitter or receiver (Leijnse et al.,
2007). As there was a surface station that recorded precipitation in the area, the increased
attenuation was ascribed to precipitation. Further investigation is required to identify the
sources of these perturbations. The link's frequency is 21.325 GHz and the calculated
correlation between the time series is 0.82 with RMSD of 3.4 [g/m
3
]
Humidity Measurements using Commercial Microwave Links
75
The largest difference between the traditional and the novel measurement methods
(Figure 2d) appears on the night of 6 May 2007. This night was a holiday in Israel ("Lag
Ba'omer"), where hundreds of bonfires were lit all across the country. As a result, many
particles were released into the low atmosphere speeding up the creation of smog and
possibly fog (the measured relative humidity by a radiosonde launched at 03:00 a.m. from
Beit Dagan (Fig. 1b), a few km away from the microwave link, at an altitude of 95 m ASL
was 97%). The reason for the additional attenuation observed by the microwave link
(expressed by a higher moisture level) might be due to local fog (Raghavan, 2003),
implying that the system may provide the ability to monitor this phenomenon through
the use of wireless communication data. When excluding the 6 May measurement, the
correlation increases to 0.85 and the RMSD decreases to 2.9 [g/m
3
]. Further investigation
is needed concerning this point.
5. Uncertainties
Commercial microwave links are designed for efficient data transmission and high
communication performance rather than measuring the water vapour density. Hence,
estimation of the uncertainties for observations that are non-optimal in the first place is
fundamental in order to assure usability of the data. The uncertainty in measuring
temperature and pressure are of the magnitude 0.1 degrees Celsius, and 1 mb, respectively.
However, changes of this magnitude in pressure or temperature do not create a significant
change in the absolute humidity calculation based on this model (Rec. ITU-R P.676-6, 2005;
Liebe, 1985). The dominant uncertainty affecting the absolute humidity calculation is that of
the attenuation quantization error. The uncertainty depends on the path length. Since the
quantization error of the wireless system used is 0.1 dB per link, the uncertainty in
evaluating attenuation is ± 0.025 dB/km for a typical 4 km long link (a length which is of the
order of magnitude of three out of the four links used in the cases presented here). As a
result we get that the error in calculating absolute humidity for this link length is of the
magnitude of ± 1 g/m
3
. In the case of an 11.05 km link, the uncertainty in evaluating the
attenuation is ± 0.01 dB/km, hence the corresponding error in calculating the absolute
humidity is of the magnitude of ± 0.5 g/m
3
. The estimated uncertainty in measuring
humidity with regular humidity gauges is about 0.2 to 0.5 g/m
3
(depending on the relative
humidity and the temperature), while the error in measuring relative humidity was taken to
be 3%.
Dry air effect on attenuation is one order of magnitude lower than that of water vapour in
this case. Quantitatively it is about 0.01 dB/km for dry air and 0.19 dB/km as a result of
humidity (for a 1 km link, operating near 22 GHz, temperature of 15 °C, humidity of 7.5
g/m
3
and a sea level pressure). However, the algorithm takes into account the effects of dry
air, and corrects for them. Another atmospheric parameter which can be estimated based on
the model is the imaginary part of the refractive index- N'', as aforementioned, this variable
represents the absorption. Under the same atmospheric conditions as mentioned previously
and for a link operating near 22 GHz, a typical value which was obtained for this variable,
based on the model, is: 0.044 [N units] while the uncertainty is ± 0.006 [N units] for a 4 km
link and ± 0.003 [N units] for an 11 km link.
Rain, fog, snow and clouds create additional attenuation in relation to that caused by water
vapour. One of the research challenges we are faced with is separating the effects of
different attenuation sources. As we aim to prove feasibility, at this stage, the technique is
Advanced Trends in Wireless Communications
76
limited to periods where none of the aforementioned phenomena exist along the link line-of-
sight. The microwave links are sensitive to mechanical oscillations. Therefore, strong winds,
that may cause movement of either the receiver or the transmitter (or both), may also be
considered as a source of error (Leijnse et al., 2007).
6. Conclusions and future plan
Our results show very good agreement between the conventional way to measure water
vapour over the low troposphere and our proposed, novel method based on wireless
communication networks measurements. However, some disparities are expected of course.
That is since measurements from the microwave links are line integrated data, where in-situ
measurements as made by a typical humidity gauge are point measurements. In addition,
the difference in location between the measurement sites and particularly the difference in
the moisture level with altitude which can be significant at night hours, introduces
additional disparities between the microwave measurements and those made by the
conventional humidity gauges.
The measurements from the northern links present a better correspondence with the
humidity gauge readings, compared to the measurements which were made by the
microwave links located in central Israel. Additionally, it is possible to note that the Harduf
area link presents, in general, a better agreement with the humidity gauge data as compared
to that of the other three links. While it will need to be further investigated, we can suggest
several reasons for the observed discrepancy: The representativeness of the spot humidity
gauges is a factor. It is possible that the humidity gauge in the northern area better
represents the average humidity in the region than the Ben Gurion airport humidity gauge
does. Thus, it is possible that, the measurements of the central area humidity gauge do not
correspond as well to the measurements of the microwave link that represent the average
humidity along the paths ( distances of 4.5 km and 11.05 km). Moreover, it is important to
note that the transmitting and receiving units of the Harduf link are located on hilltops, and
are higher off the ground, so that the microwave beam travels over a valley. On the other
hand, while the other three links are located between 25 to 95 m ASL, their masts heights
(where the transmitters and receivers are installed) are only between 15 to 33 m above the
surface itself. It is possible then, that those links are more prone to reflection and surface
interference (Leijnse et al., 2007).
The wireless measurement technique can thus either replace existing techniques or
preferably be used in conjunction with them in order to obtain more accurate moisture
fields.
Given the newly available data provided by the wireless communication facilities, improved
initialization of atmospheric models can be achieved, thus enhancing prediction and
hazards warning skills as well as providing a better understanding of the global climate
system.
7. Acknowledgements
We wish to acknowledge and thank Y. Dagan, Y. Eisenberg (Cellcom), N. Dvela, A. Shilo
(Pelephone) for their cooperation and for providing the microwave data for our research.
We also thank B. Goldman (Haifa District Municipal Association for the Environment) and
A. Arie (Meteo-tech) for humidity gauge data.
Humidity Measurements using Commercial Microwave Links
77
In addition, we would like to thank our research team members: A. Zinevich, Y.
Ostromtzky, Dr. R. Samuels, D. Charkasky, O. Auslender and R. Radian (Tel Aviv
University) for their advice and assistance throughout this research.
This work was supported by a grant from the Yeshaya Horowitz Association, Jerusalem.
Additional support was given by the PROCEMA-BMBF project and by the GLOWA-JR
BMBF project.
8. References
Allan, R. P.; Shine, K. P.; Slingo, A. & Pamment, J. A. (1999). The dependence of clear-sky
outgoing long-wave radiation on surface temperature and relative humidity.
Q. J.
Roy. Meteor. Soc.
, 125, pp.2103-2126.
Bolton, D (1980). The computation of equivalent potential temperature.
Mon. Weather. Rev.,
108, pp.1046-1053.
Bean, BR.; Dutton, EJ. & Central Radio Propagation Laboratory. (1968).
Radio meteorology,
Dover Publications, New York
Ducrocq, V.; Ricard, D.; Lafore, J. P. & Orain, F. (2002). Storm-scale numerical rainfall
prediction for five precipitating events over France: On the importance of the initial
humidity field.
Weather Forecast., 17, pp.1236-1256.
David, N.; Alpert, P.; & Messer, H. (2009). Technical Note: Novel method for water vapour
monitoring using wireless communication networks measurements.
Atmos. Chem.
Phys.
, 9, pp.2413-2418, doi:10.5194/acp.9.2413.2009.
Goldshtein, O. ; Messer, H. & Zinevich, A. (2009). Rain rate estimation using measurements
from commercial telecommunications links.
IEEE T. Signal Proces., 57(4), pp.1616-
1625, doi:10.1109/TSP.2009.2012554.
Gunn, KLS. & East TWR. (1954). The microwave properties of precipitation particles.
Quart. J.Roy. Meteor.Soc
., 80, pp.522-545.
Jackson, JD. (1999).
Cssical electrodynamics. 3rd ed. Wiley, New York.
Jameson, A. (1991). A comparison of microwave techniques for measuring rainfall.
J. Appl.
Meteorol.
, 30, pp.32-54.
Kerr, DE. (1951). The propagation of short radio waves, MIT Radiation Laboratory Series 13,
McGraw-Hill, New York.
Leijnse, H.; Uijlenhoet, R. & Stricker, J. N. M. (2007). Rainfall measurement using radio links
from cellular communication networks.
Water Resour. Res., 43, W03201,
doi:10.1029/2006WR005631.
Leijnse, H.; Uijlenhoet, R. & Stricker, J. N. M. (2007). Hydrometeorological application of a
microwave link: 1. Evaporation.
Water Resour. Res., 43, W04416,
doi:10.1029/2006WR004988.
Leijnse, H.; Uijlenhoet, R. & Stricker, J. N. M. (2007). Hydrometeorological application of a
microwave link: 2. Precipitation.
Water Resour. Res., 43, W04417,
doi:10.1029/2006WR004989.
Leijnse, H. (2007). Hydrometeorological application of a microwave links: measurement of
evaporation and precipitation. Ph.D. thesis, Wageningen University.
Lilly, D. K. & Gal-Chen, T. (1983).
North Atlantic Treaty Organization & Scientific Affairs
Division. Mesoscale meteorology-theories, observations, and models
, Reidel, Dordrecht,
Netherlands.
Advanced Trends in Wireless Communications
78
Liebe, HJ. (1985). An updated model for millimeter wave propagation in moist air. Radio
Science
, 20, pp.1069-1089.
Meeks, M. L. (1976).
Methods of experimental physics: Astrophysics, Academic Press. New York.
Messer, H.; Zinevich, A. & Alpert, P. (2006). Environmental monitoring by wireless
communication networks,
Science, 312, pp.713.
Messer, H. (2007). Rainfall monitoring using cellular networks
, IEEE Signal Proc. Mag., 24,
pp.142-144.
Neter, J.; Kutner, M. H.; Nachtsheim, C. & Wasserman, W. (1996).
Applied Linear Statistical
Models, 4th Edition,
McGraw Hill, Inc., 640–645.
Olsen R.; Rogers, D. & Hodge, D. (1978). The aR
b
relation in the calculation of rain
attenuation,
IEEE Trans. Antennas Propagat., AP-26, pp. 318-329.
Raghavan, S. (2003).
Radar Meteorology. Kluwer Academic Publishers, Dordrecht.
Rec. ITU-R P.676-6. (2005). Attenuation by atmospheric gases, ITU-R Recommendations.
Upton, G.; Cummings, R. & Holt, A. (2007). Identification of melting snow using data from
dual-frequency microwave links.
IEEE Proc. Microwaves Antennas Propag., 1(2),
pp.282-288.
Van Vleck, JH. (1947). Absorption
of microwaves by uncondensed water vapor, Phys. Rev.,
71, pp.425-433.
Zinevich, A.; Alpert, P. & Messer, H. (2008). Estimation of rainfall fields using commercial
microwave communication networks of variable density.
Adv. Water Resour., 31(11),
pp.1470-1480, doi:10.1016/j.advwatres.2008.03.003.
Zinevich, A. ; Messer, H. & Alpert, P. (2009). Frontal rainfall observation by a commercial
microwave communication network.
J. Appl. Meteorol. Clim., 48(7), pp.1317-1334,
doi: 10.1175/2008jamc2014.1.
Zinevich, A.; Messer, H. & Alpert, P. (2010). Prediction of rainfall intensity measurement
errors using commercial microwave communication links.
Atmos. Meas. Tech., 3,
pp.1385-1402
Part 2
Antenna Design and Performance
Tommy Hult
1
and Abbas Mohammed
2
1
Department of Electrical and Information Technology, Lund University
2
School of Engineering, Blekinge Institute of Technology
Sweden
Over the last decade the world has witnessed explosive growth in the use of wireless mobile
communications. Looking around we find users with mobile phones, wireless PDAs, MP3
players, keyboards etc. and wireless headphones to connect to these devices - a small
testament of the impact of wireless communications on our daily lives. In addition the
burst of new technologies such as Bluetooth and other short-range wireless communications
are encouraging the further development of a wide variety of distributed wireless devices
(Mohammed, 2002).
Bluetooth is one of those short range wireless communication technology systems which aims
at replacing many proprietary c ables that connect one device with another with one universal
short-range radio link. Recently, many mobile devices (e.g., mobile phones, PDAs, computer
mice) with integrated Bluetooth modules have been introduced. Their wireless technology is
used to transfer any kind of data onto these devices.
Propagation of radio waves inside buildings is a very complicated issue, and it depends
significantly on the indoor environment (home, office, factory) and the topography (LOS: line
of sight and NLOS: non-line of sight). The statistics of the indoor channel v aries with time
due to movements of people and equipment (Obayashi & Zander, 1998). A survey of indoor
propagation measurement and models can be found in (Hashemi, 1993), and electromagnetic
propagation effects in (Sander & Reed, 1978). There are limited investigations in the open
literature on the measurements and simulations of multipath wave propagation effects on the
performance of live Bluetooth links.
In this chapter w e present measurement campaigns (signal power, bit error rate and data
rate) in an indoor office building for LOS a nd NLOS propagation scenarios and assess their
effects on the Bluetooth link. These measurements were carried out using various antennas
(omni-directional and directive antennas), and we will present comparative analysis to access
the potential improvement in system performance gained from the use of directive antennas.
We will also show the effect of antenna parameters (gain a nd efficiency) on the results and the
overall impact on the quality and coverage of the Bluetooth link.
The organization of this chapter is as follows. In section 2 we provide a brief description of
the building in the tested indoor office environment and the various types of antennas used
in the measurement trials and their related parameters. In section 3 we present the results of
these measurements. Finally, section 4 concludes the chapter.
Assessment of Indoor Propagation and Antenna
Performance for Bluetooth Wireless
Communication Links
5
2 Will-be-set-by-IN-TECH
1. Bluetooth
Bluetooth devices operate in the unlicensed industrial, scientific and medical (ISM) band at
2.4 GHz, and with a total bandwidth of 83.5 MHz (Bisdikian, 2001; Bluetooth, 2002; Haartsen,
2000). According to the IEEE 802.11 standard, this band is globally available, license-free and
follow a basic set of power, spectral emission and interference specifications.
There are two types of connections depending on the number and functions of the Bluetooth
system. These connections form a piconet topology which is either point-to-point or
point-to-multipoint networks. In the point-to-point connection, only two Bluetooth devices
are involved, while several Blutooth devices are connected in the point-to-multipoint
connection. In these configurations the Bluetooth device that first creates a connection
is designated as the master device and the others would then become slave devices. The
maximum number of eight Bluetooth devices can be connected into a piconet, (i.e.,1 master
and 7 slaves).
The topology of the connection can be extended to involve more piconets depending on
the function of each Bluetooth device. This extended net is called a scatternet, in which a
Bluetooth device could be active in more than one piconet.
The Bluetooth radio utilize s pectrum spreading through the use of frequency hopping
between 79 channels displaced by 1 MHz, from 2.402 GHz to 2.481 GHz, although in some
countries the frequency hopping range is reduced to 23 hops (McDermott-Wells, 2004). The
frequency hopping provides a redcution of interference from other devices in the busy ISM
band. Even though the Bluetooth technology includes a retransmission scheme for lost data
packets, the frequency hopping will minimize the possibility of data blocking when there
are many Bluetooth devices within range of each other. The gross data rate of the Bluetooth
technology is 1 Mbps (Bisdikian, 2001; Bluetooth, 2002; Miller & Bisdikian, 2001).
Each Bluetooth device is classified into 3 power classes,
• class 1 with a maximum transmit power of 20 dBm.
• class 2 with a maximum transmit power of 4 dBm.
• class 3, with a maximum transmit power of 0 dBm.
To obtain the most efficient use of the bandwidth within a channel while maintaining an
acceptable bit error rate, the digital bit stream is modulated using Gaussian Frequency Shift
Keying (GFSK).
The power emission is controlled at the receiver side by monitoring the Received Signal
Strength Indicator (RSSI) and sending Link Manager Protocol (LMP) control commands to
the transmitter asking for the transmit power to be reduced if the RSSI value is higher than
the necessary threshold required to m aintain a better link quality. If the RSSI value is too
low, then the receiver may request the power to be increased (Bisdikian, 2001; Bluetooth, 2002;
Miller & Bisdikian, 2001).
The Bluetooth protocol uses a combination of circuit and packet switching. Slots can be
reserved for three supported synchronous voice channels and one asynchronous data channel.
In addition there is a supported channel for both asynchronous data and synchronous voice.
2. The tested indoor office environment
The measurement trials were performed indoors in typical office environments. In this section
we will describe the building structure and material where the measurements took place and
later in the results section we show the sensitivity of the Bluetooth link, employing different
82
Advanced Trends in Wireless Communications
Assessment of Indoor Propagation and Antenna Performance for Bluetooth Wireless Communication Links 3
Fig. 1. Description of the indoor office environment used in the measurement scenarios for:
NLOS (top figure) and LOS (bottom figure).
antenna types, in these indoor environments. Figure 1 shows a typical example of office
environment which is quite common all over the world. The dimensions of the hallway of
the building in this figure are (45 x 1.85 x 2.30) meters. Most doors are mainly made of wood
except of the two outer doors, one at each end of the hallway, which are made of metal.
The inner walls in the hallway consists of a large single pane window in a wooden frame.
The walls between the rooms consists of two plasterboards supported by two vertical steel
crossbars and the plasterboards are nailed to vertical wooden crossbars that are situated at
regular intervals inside the wall. Mostly all the furniture in the office are made of wood and
plastic. The outer walls of the building are made of concrete isolated with thermal material
and dual pane windows surrounded by wooden/metal frames.
2.1 The used antennas
The antenna is the interface between the transmitter/receiver and the propagation medium,
and it therefore is a deciding factor in the performance of a radio communication system.
83
Assessment of Indoor Propagation and Antenna
Performance for Bluetooth Wireless Communication Links